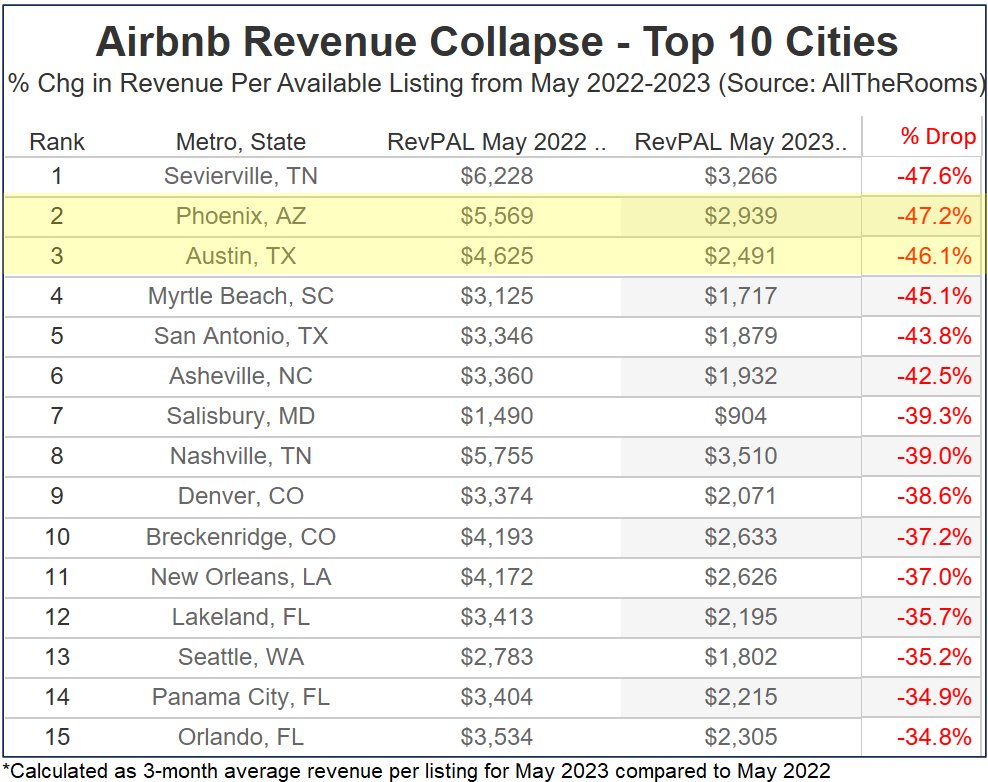
The Airbnb collapse is real.
Revenues are down nearly 50% in cities like Phoenix and Austin.
Watch out for a wave of forced selling from Airbnb owners later this year in the areas hit hardest by the revenue collapse.
Revenues are down nearly 50% in cities like Phoenix and Austin.
Watch out for a wave of forced selling from Airbnb owners later this year in the areas hit hardest by the revenue collapse.
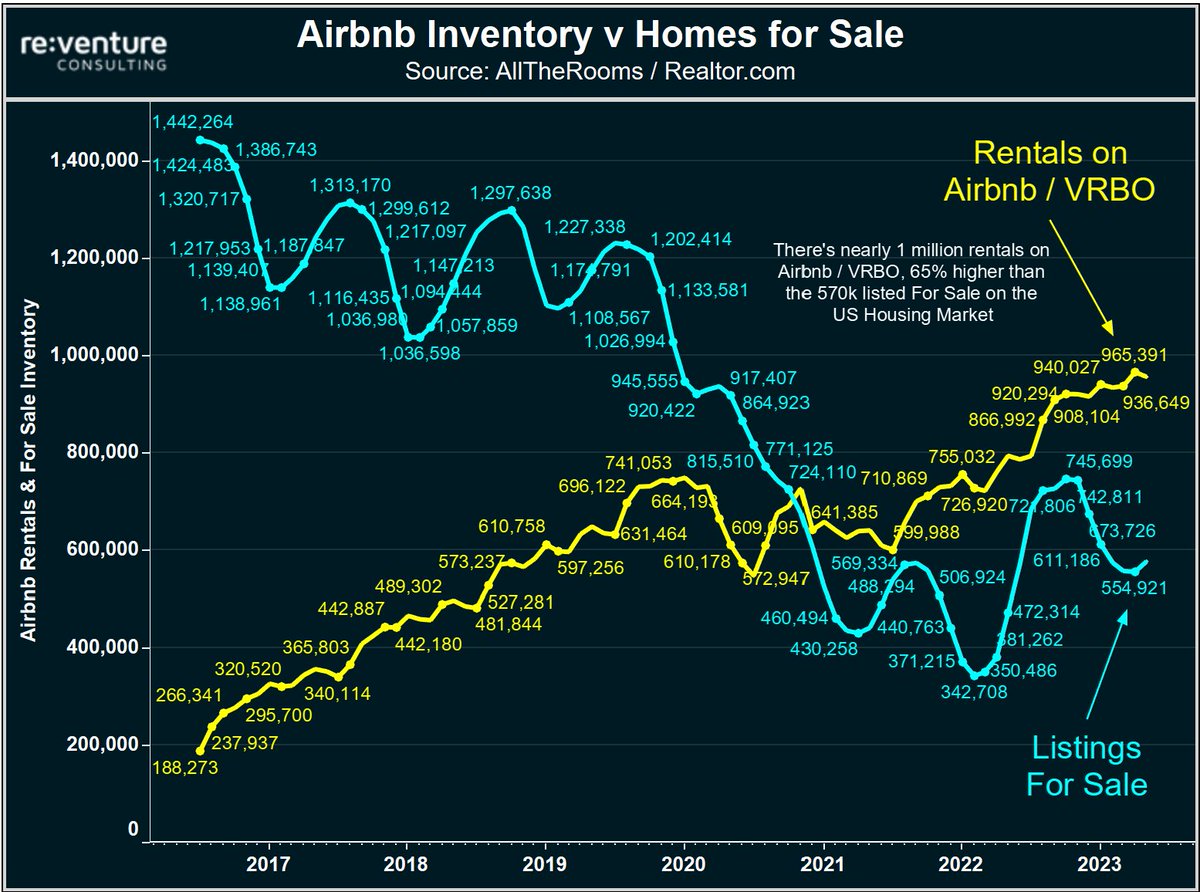
1) What's scary for the US Housing Market is just how many Airbnbs there are.
Data from AllTheRooms shows 1 million Airbnb / VRBO rentals.
Compared to only 570k homes for sale.
Creates huge home price downside if struggling Airbnb owners elect to sell.
Data from AllTheRooms shows 1 million Airbnb / VRBO rentals.
Compared to only 570k homes for sale.
Creates huge home price downside if struggling Airbnb owners elect to sell.
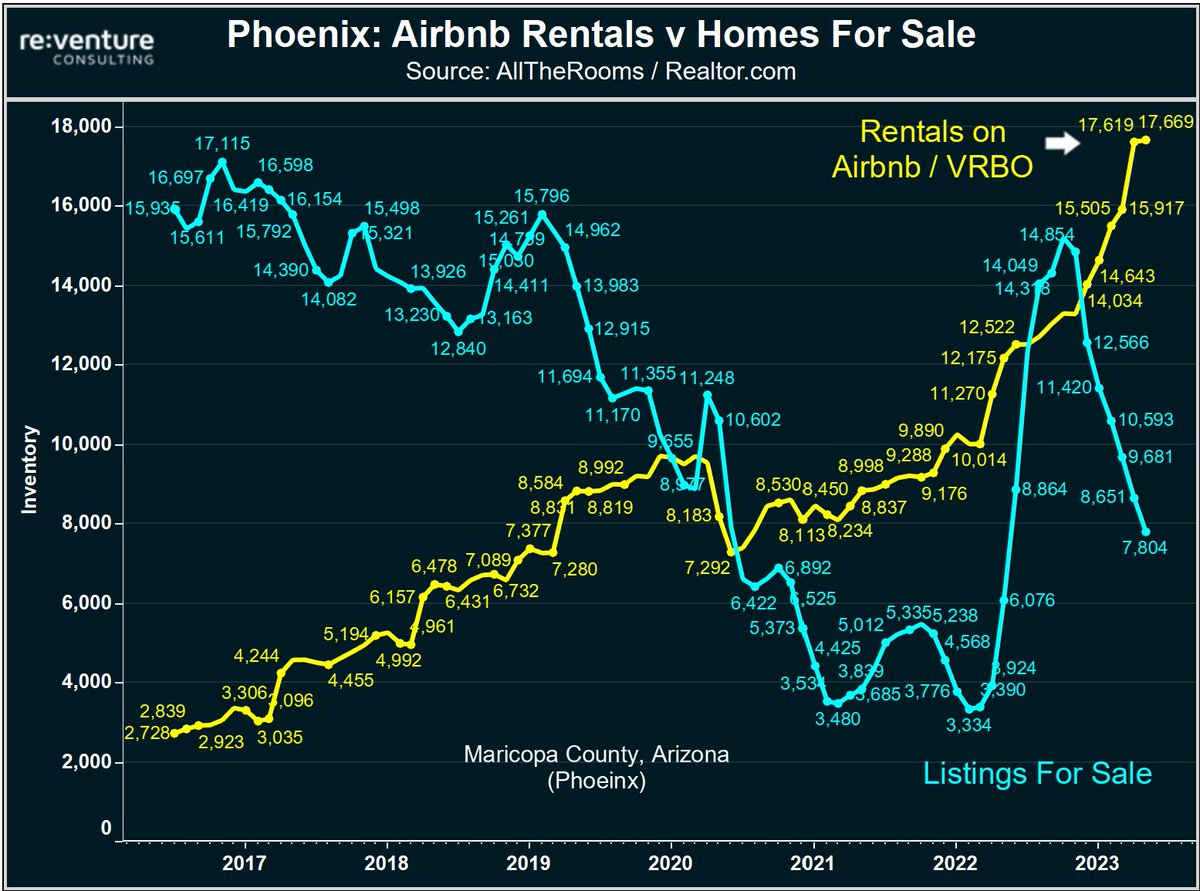
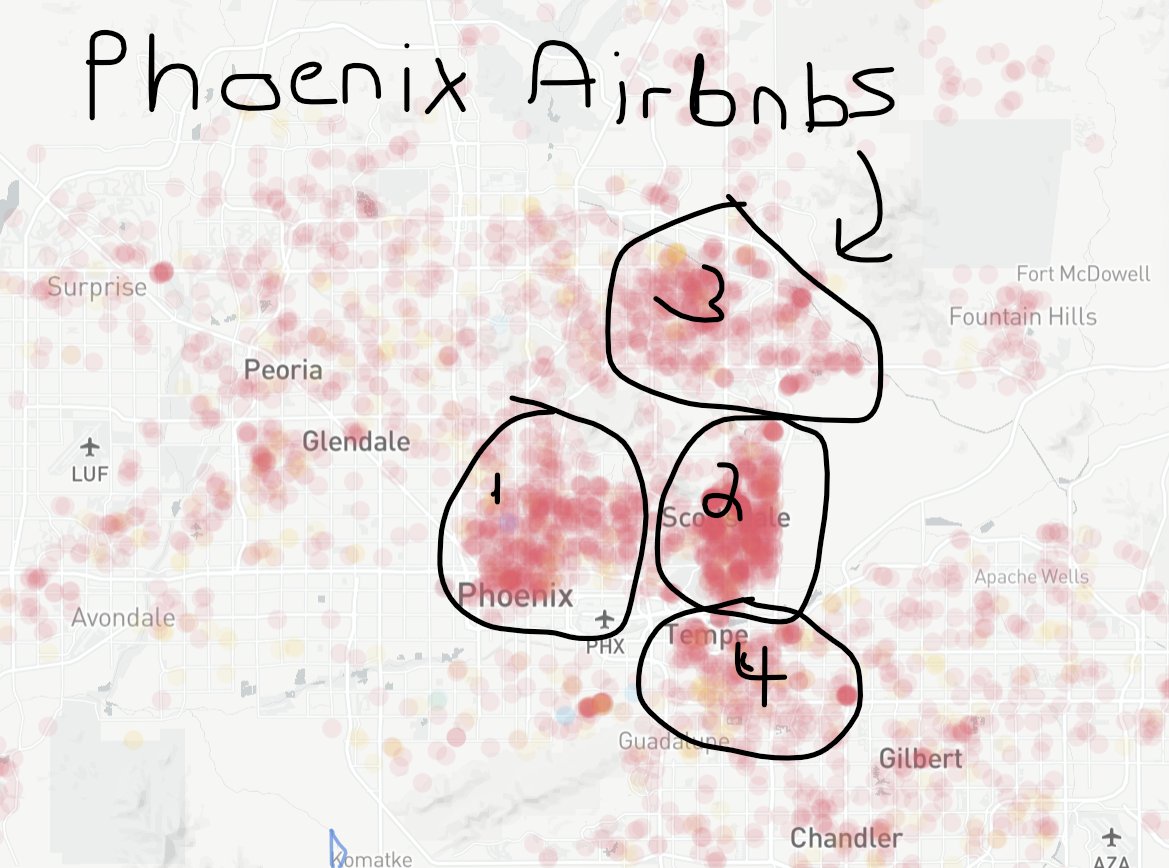
2) Ground zero for this Airbnb collapse is a city like PHOENIX.
Where the number of short-term rentals (18k) is more than DOUBLE the number of for sale listings (8k).
Mix the huge Airbnb supply with revenues down -50% and you get a cocktail for massive forced selling.
Where the number of short-term rentals (18k) is more than DOUBLE the number of for sale listings (8k).
Mix the huge Airbnb supply with revenues down -50% and you get a cocktail for massive forced selling.
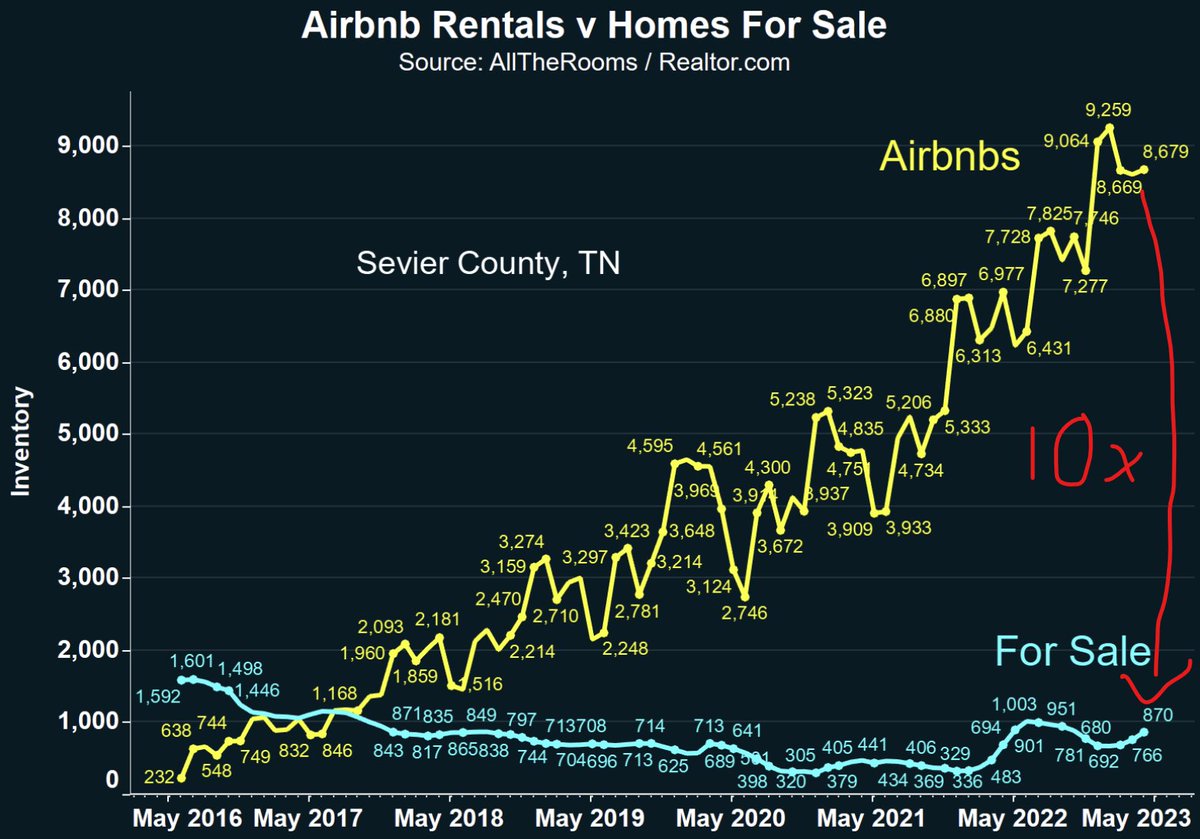
3) Another area with huge exposure is Eastern Tennessee.
Particularly a vacation town called Sevierville in the Smokey Mountains.
In this county there's 10x as many Airbnbs as homes listed for sale. While the revenue per owner is down nearly 50%.
Yikes.
Particularly a vacation town called Sevierville in the Smokey Mountains.
In this county there's 10x as many Airbnbs as homes listed for sale. While the revenue per owner is down nearly 50%.
Yikes.
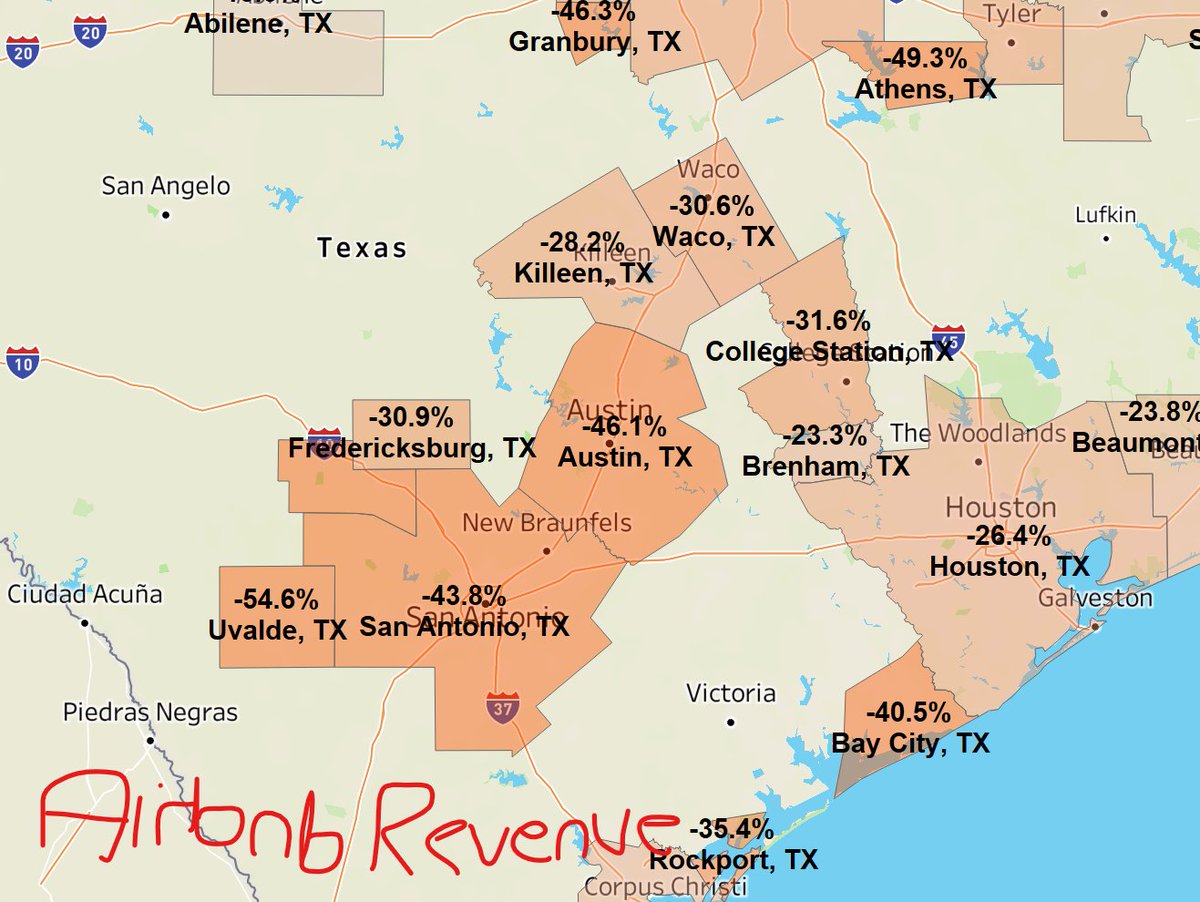
4) Another area to watch out for is Central Texas.
Data from AllTheRooms shows that Airbnb revenues are down 40-50% yoy across most of the area.
Particularly in Austin, San Antonio, Uvalde.
Data from AllTheRooms shows that Airbnb revenues are down 40-50% yoy across most of the area.
Particularly in Austin, San Antonio, Uvalde.
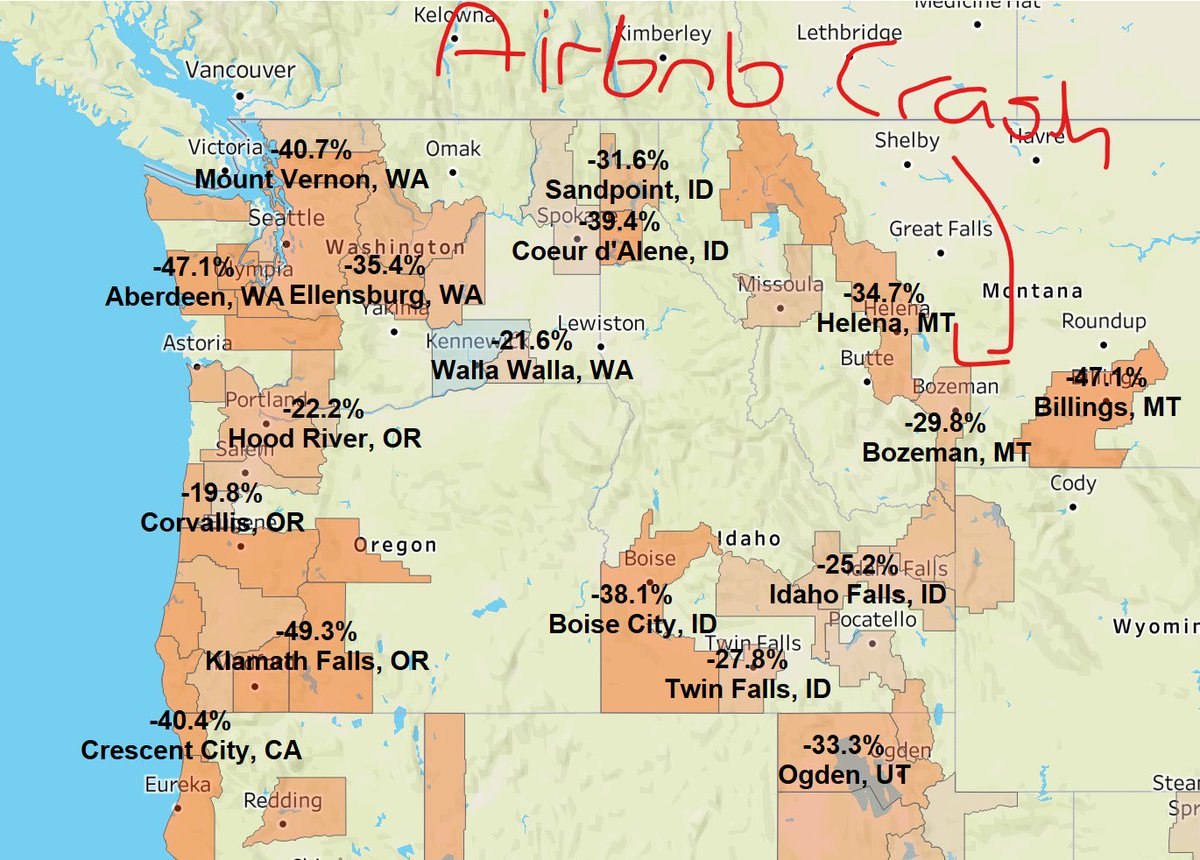
5) Another area that is getting smoked by the Airbnb Crash is the Pacific Northwest / Mountain Region.
States like Montana, Idaho, and Oregon.
Fewer people playing out their Yellowstone fantasies + way more supply = 40% declines in revenue per listing.
States like Montana, Idaho, and Oregon.
Fewer people playing out their Yellowstone fantasies + way more supply = 40% declines in revenue per listing.
6) And ultimately this Airbnb crash was to be expected.
The pandemic is over. Fewer people are working from home / vacationing in states like Montana, Texas, and Tennessee.
So the demand is way down. Just as the Airbnb supply went way up. So you get a crash.
The pandemic is over. Fewer people are working from home / vacationing in states like Montana, Texas, and Tennessee.
So the demand is way down. Just as the Airbnb supply went way up. So you get a crash.
7) What will be interesting is how "stubborn" Airbnb owners are in holding their properties.
Many of them are just now seeing their revenues down 50%.
But the mainstream narrative hasn't caught up to it yet. So owners might not realize the Airbnb crash is a broader trend.
Many of them are just now seeing their revenues down 50%.
But the mainstream narrative hasn't caught up to it yet. So owners might not realize the Airbnb crash is a broader trend.
8) Some Airbnb owners might elect to do a long-term rental in their properties instead.
But the problem with that is that there has already been a huge surge in long-term rentals hitting the market.
With vacant rentals in cities like Nashville exploding over the last year.
But the problem with that is that there has already been a huge surge in long-term rentals hitting the market.
With vacant rentals in cities like Nashville exploding over the last year.
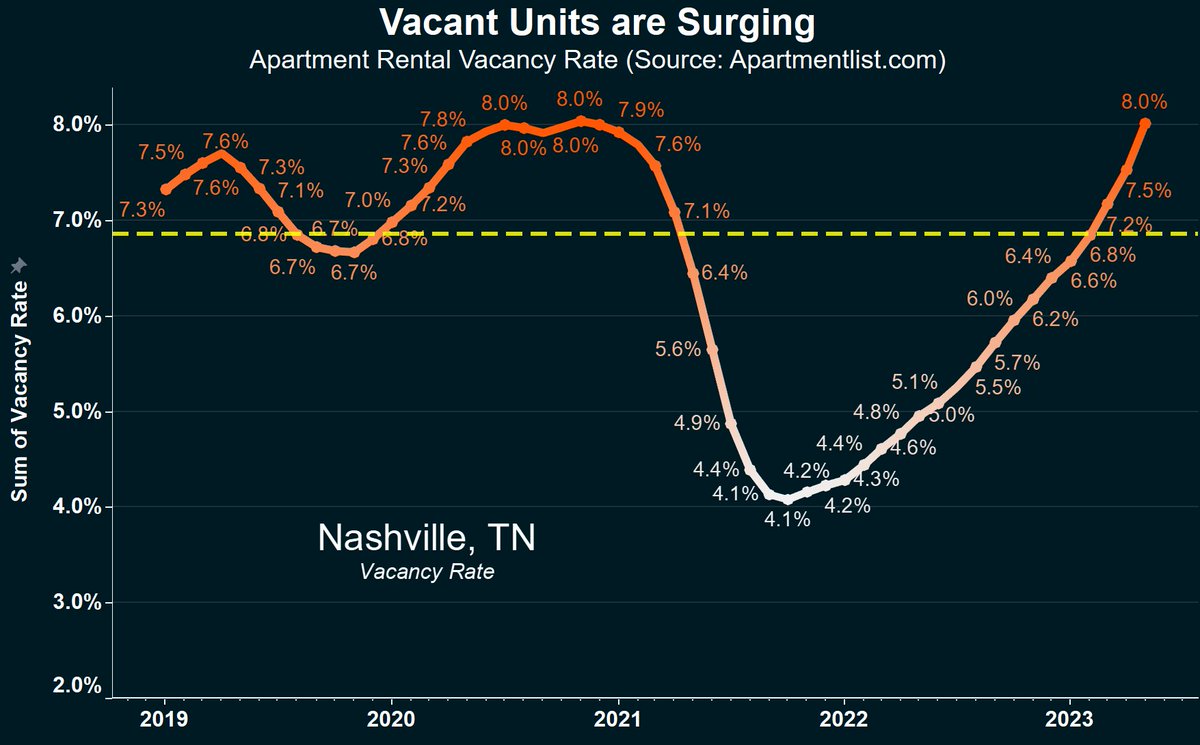
9) So if Airbnb owners "pivot" to long-term rentals, they'll likely crash that market as well.
Especially in dense urban areas. Which is where the majority of Airbnbs are located.
Check out the Airbnb heatmap in a metro like Phoenix to see areas with most exposure.
Especially in dense urban areas. Which is where the majority of Airbnbs are located.
Check out the Airbnb heatmap in a metro like Phoenix to see areas with most exposure.
10) I think "newbie" Airbnb owners who bought over the last 1-2 years with a mortgage are in trouble.
They got in at a high price. And have a high monthly payment. And little margin for error.
They could be some of the first to sell later in 2023 when the season ends.
They got in at a high price. And have a high monthly payment. And little margin for error.
They could be some of the first to sell later in 2023 when the season ends.
11) However, some of the more seasoned Airbnb operators who got in before the pandemic likely have room to work with.
They paid less for their Airbnb. Have a cheaper mortgage rate. And more experience.
They will be less inclined to sell.
They paid less for their Airbnb. Have a cheaper mortgage rate. And more experience.
They will be less inclined to sell.
12) I'll have more content and data on the Airbnb crash in coming weeks.
The data used in this Tweet thread came from AllTheRooms. They're a short-term rental data provider who tracks Airbnb supply, rates, and revenue for every market in the country.
alltherooms.com
The data used in this Tweet thread came from AllTheRooms. They're a short-term rental data provider who tracks Airbnb supply, rates, and revenue for every market in the country.
alltherooms.com
• • •
Missing some Tweet in this thread? You can try to
force a refresh