Prof. Eliot Jacobson Profile picture
Jun 30 2 tweets 1 min read Twitter logo Read on Twitter
It finally happened, breaking 5 sigma, the same statistical threshold physicists used to prove the existence of the Higgs boson.

At 2,700,000 km² below the 1991-2020 mean, Antarctic sea ice extent was 5.14σ below the mean, roughly a 1-in-7,400,000 chance.
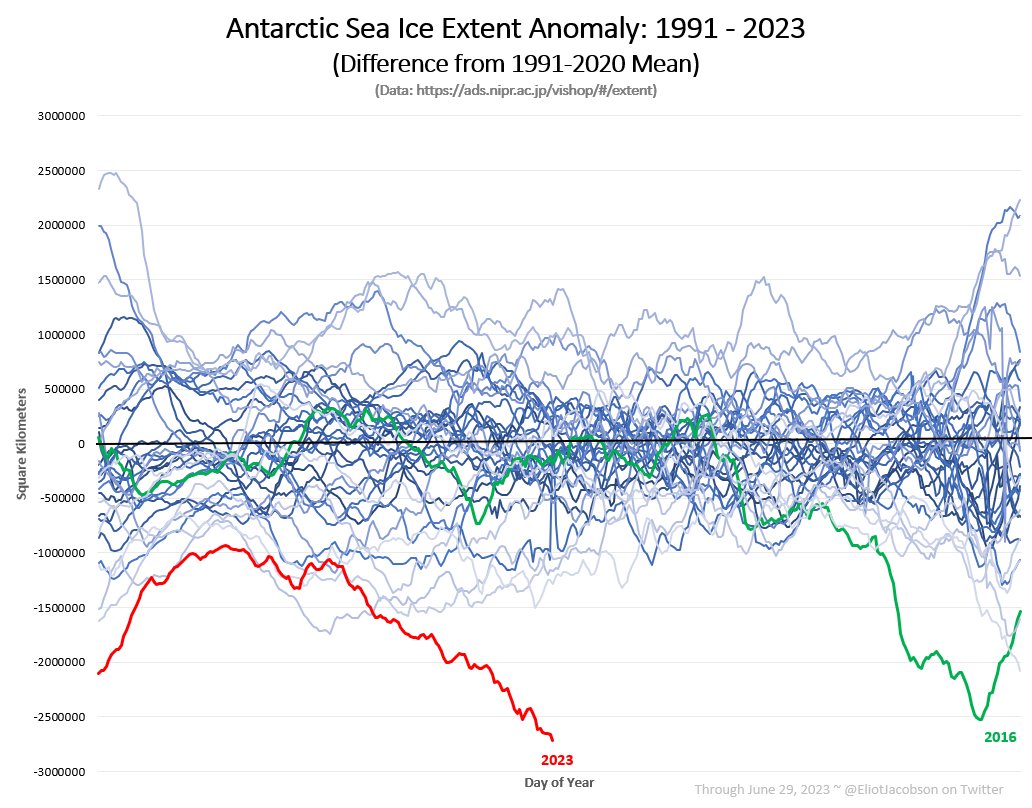
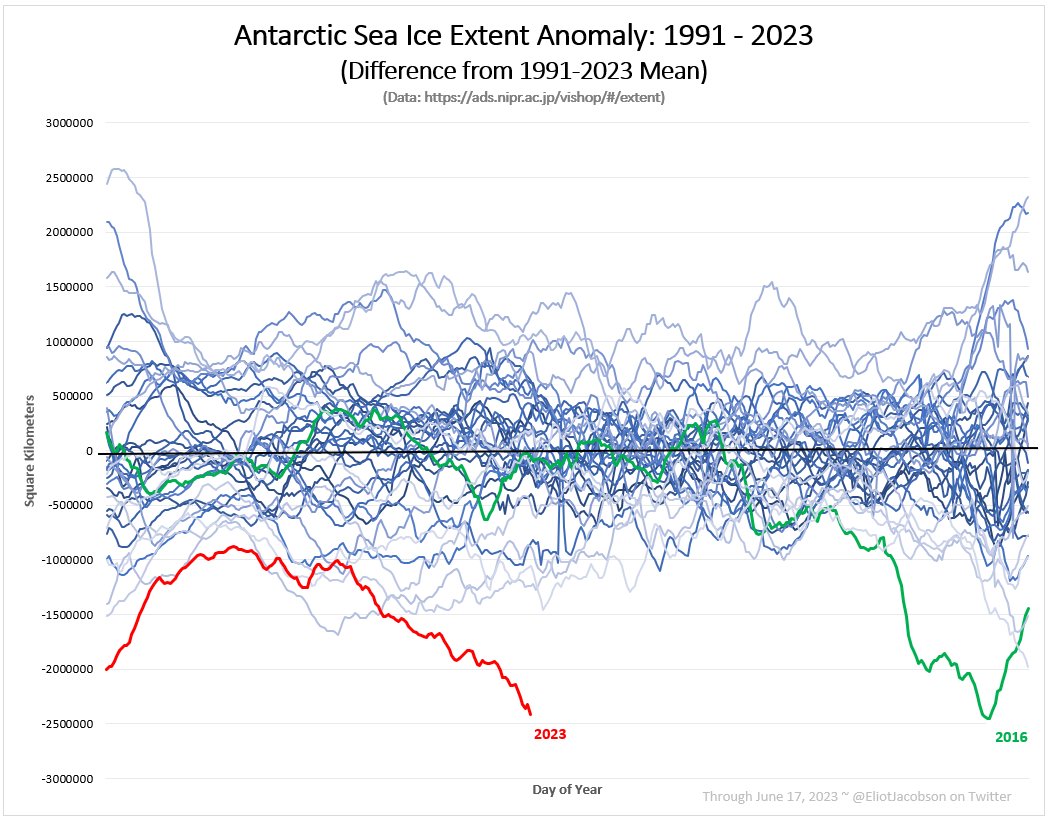
This graph above is a picture of the sea ice anomaly. Antarctic sea ice continues to grow, just at an extremely slow pace.

• • •

Missing some Tweet in this thread? You can try to force a refresh
 

Keep Current with Prof. Eliot Jacobson

Prof. Eliot Jacobson Profile picture

Stay in touch and get notified when new unrolls are available from this author!

Read all threads

This Thread may be Removed Anytime!

PDF

Twitter may remove this content at anytime! Save it as PDF for later use!

Try unrolling a thread yourself!

how to unroll video
  1. Follow @ThreadReaderApp to mention us!

  2. From a Twitter thread mention us with a keyword "unroll"
@threadreaderapp unroll

Practice here first or read more on our help page!

More from @EliotJacobson

Jun 20
Wow!

The Australian Bureau of Meteorology has had both the most extreme and most accurate forecasts of the developing El Niño. But this forecast, just released, is so extreme it's hard to believe I'm seeing it.

3.0°C by October.
3.2°C by November.

Wow!
bom.gov.au/climate/model-… Image
And yes, they need a bigger y-axis. Their graphic maxes out at 2.8°C.

@LeonSimons8 Image
And to get an idea of just how massive the developing El Niño could be, the previous record high super El Niño peaked at 2.6°C in November/December of 2015. The 1997 El Niño peaked at 2.4°C. And this one is now modelled by the BoM to break 3.0°C.

Data:
origin.cpc.ncep.noaa.gov/products/analy…
Read 7 tweets
Jun 18
What's happening to Antarctic sea ice extent isn't getting enough global media attention. And by "enough" I mean none. Nothing. This ongoing and dramatic collapse is completely absent from today's news.

Yesterday's sea ice extent was 4.02σ below the 1991-2023 mean (1-in-34,000). Image
This is an anomaly chart.

By collapse I mean that the rate of increase of sea ice has collapsed. Sorry for the confusing language. The sea ice is increasing, just at a record slow rate in the modern era.
Each horizontal blue wavy line is a year’s worth of measured sea-ice extent. Starting with the average extent over the period 1991-2023, I simply compare each day’s extent with that average and plot that point on the year’s blue line. The years shown in this image are 1991-2023.
Read 4 tweets
Apr 24
I confess, this is terrifying. Takes my breath away terrifying. I am out of superlatives to describe the present moment. And tomorrow and tomorrow and tomorrow? No idea.

Data: climatereanalyzer.org/clim/sst_daily… Image
1/x

Background.

Every day since 1982, a global 60S-60N SST has been recorded. The first 30 years of that was 1982-2011. We use that as the baseline (30 years is standard). With that data, for each day we can compute the 1982-2011 mean temperature and standard deviation.
2/x

Once you know the mean and standard deviation for a day of the year, you can then measure how far away today's SST is from that mean. So, for today:

1982-2011 mean = 20.33633°C
1982-2011 SD = 0.149954°C
Todays SST = 21.04°C
Read 8 tweets
Feb 23
How many ancient plants decayed to create the gas for you to drive to Starbucks so you could buy that grande mocha frappuccino?

To make one liter of gas it takes about 25 tons of ancient organic material, about the same as the amount of wheat grown in a 10 acre field.
Additionally, there is the carbon required to mine and process the stuff that goes into manufacturing your car, the roads & other infrastructure, the petrol station, the Starbucks store, its machines & cups, etc.
Read 4 tweets
Sep 5, 2022
My simple thought on Truss as PM: I am now convinced that the UK is going to be the first "first world" country to completely implode and collapse, and that its going to happen very soon, maybe by next summer. I have no idea what this will trigger worldwide, but it won't be good.
CNBC: Deutsche Bank says risk of a 'sterling crisis' is rising as Truss becomes UK prime minister.
cnbc.com/2022/09/05/uk-…
Read 8 tweets
Aug 30, 2022
I apologize for tweeting so much about this particular heatwave, but OMFG, it just gets more terrifying with every GFS run. We are now seeing widespread 115-120 towards the end of next week. Image
European model more or less in agreement, 44C-48C through the region. Image
Read 4 tweets

Did Thread Reader help you today?

Support us! We are indie developers!


This site is made by just two indie developers on a laptop doing marketing, support and development! Read more about the story.

Become a Premium Member ($3/month or $30/year) and get exclusive features!

Become Premium

Don't want to be a Premium member but still want to support us?

Make a small donation by buying us coffee ($5) or help with server cost ($10)

Donate via Paypal

Or Donate anonymously using crypto!

Ethereum

0xfe58350B80634f60Fa6Dc149a72b4DFbc17D341E copy

Bitcoin

3ATGMxNzCUFzxpMCHL5sWSt4DVtS8UqXpi copy

Thank you for your support!

Follow Us on Twitter!

:(