Bravos Research Profile picture
Jul 5, 2023 18 tweets 5 min read Read on X
Consumer savings are expected to run out by Sept 2023

This might be the turning point for the US economy

A thread 🧵
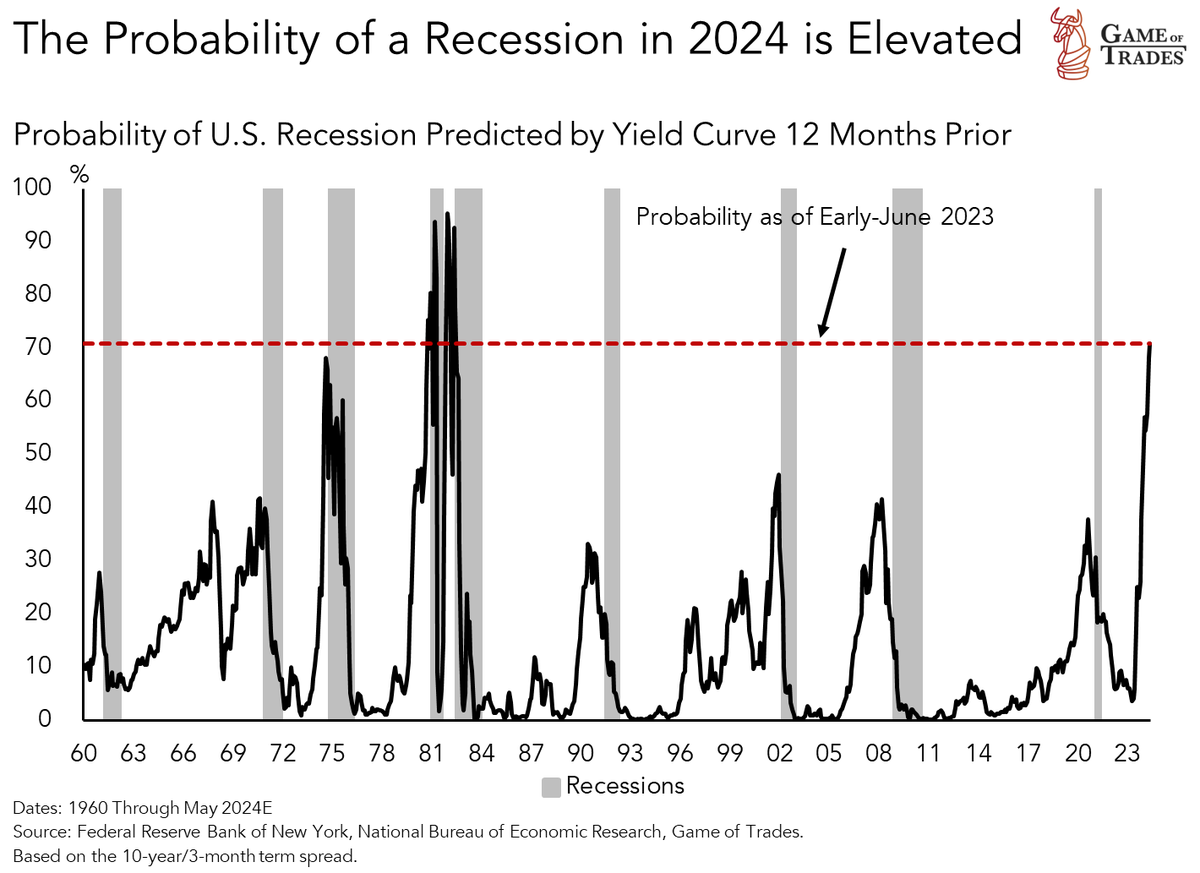
2/ In 2022, many economists predicted a U.S. recession by H1 2023
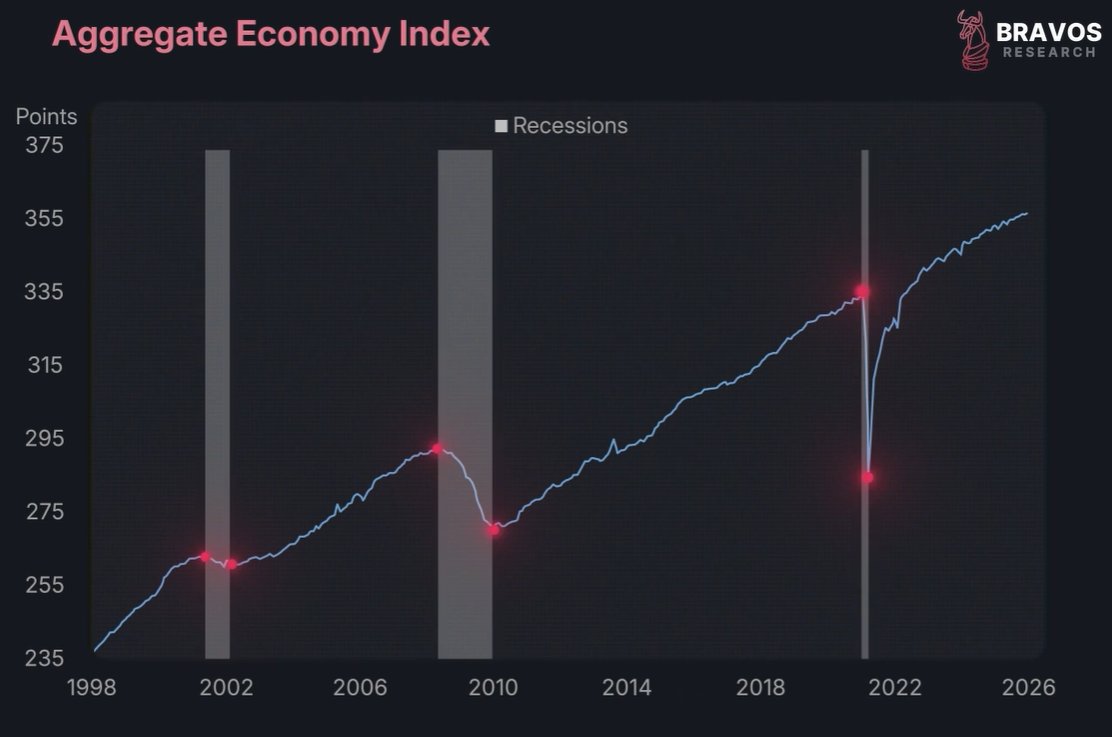
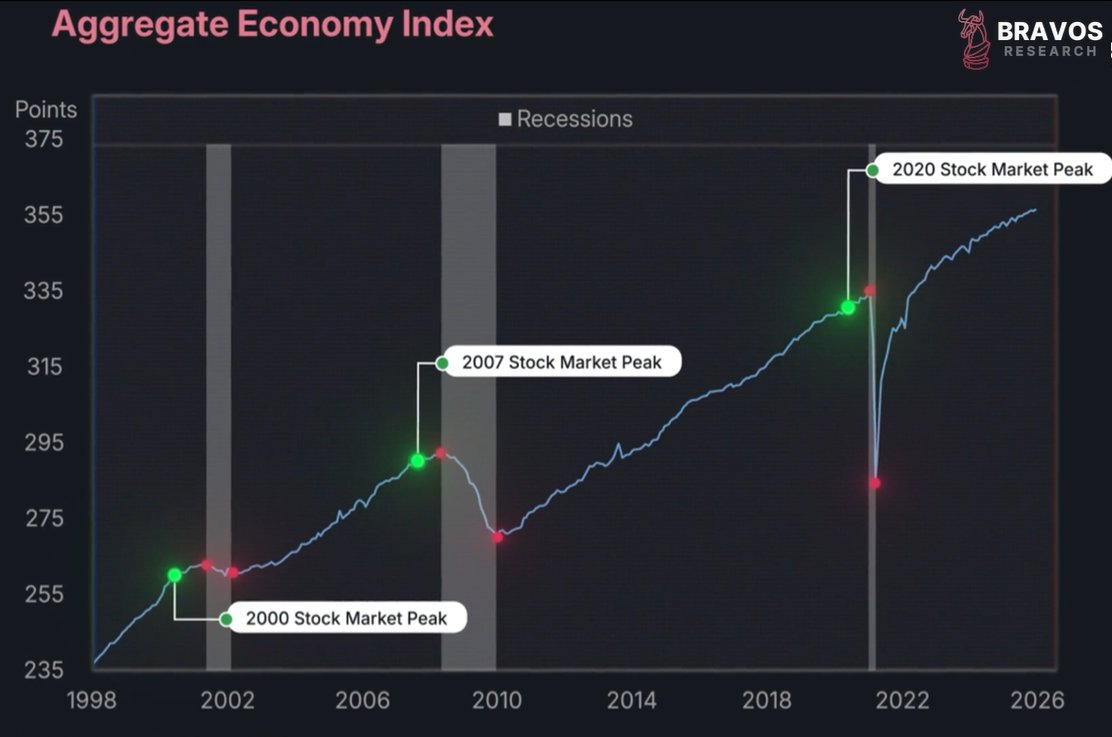
3/ Hard economic data indicates the U.S. has so far avoided a recession, with yearly economic production remaining positive
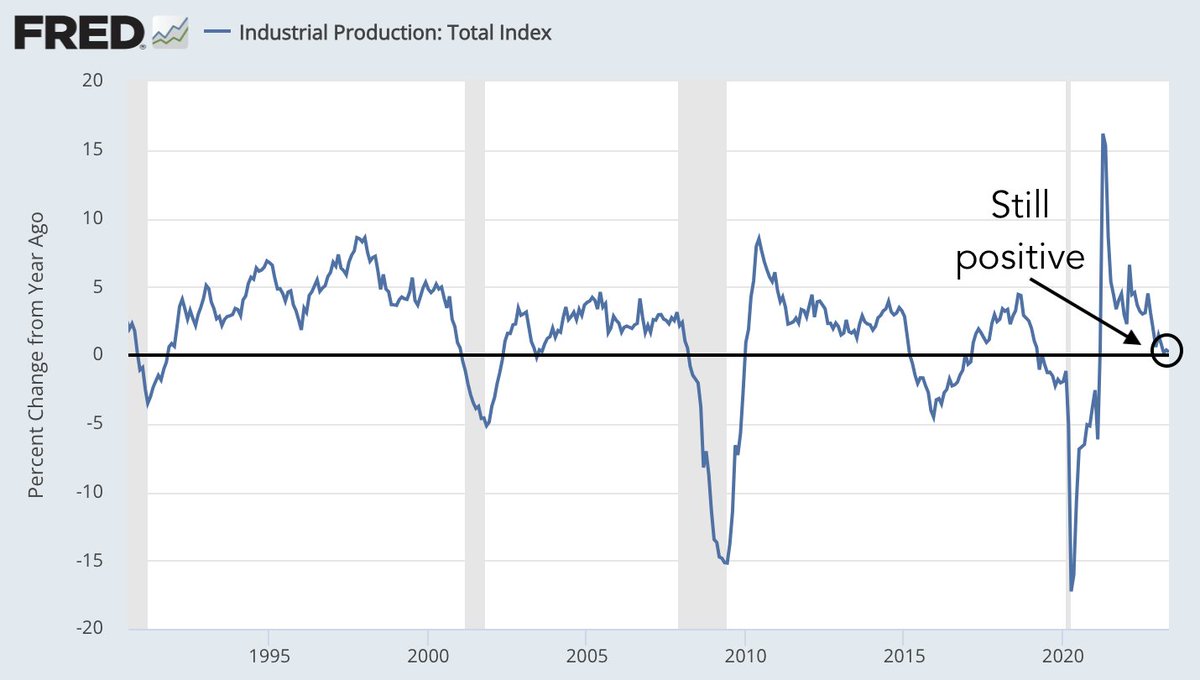
4/ Recessions typically involve significant contraction in economic production
5/ 2 key factors have held up the U.S. economy:

1. High post-pandemic consumer savings
2. Strong labor market

However, these are expected to weaken in H2 2023
6/ Post-COVID fiscal stimulus led to the highest savings rate since WWII
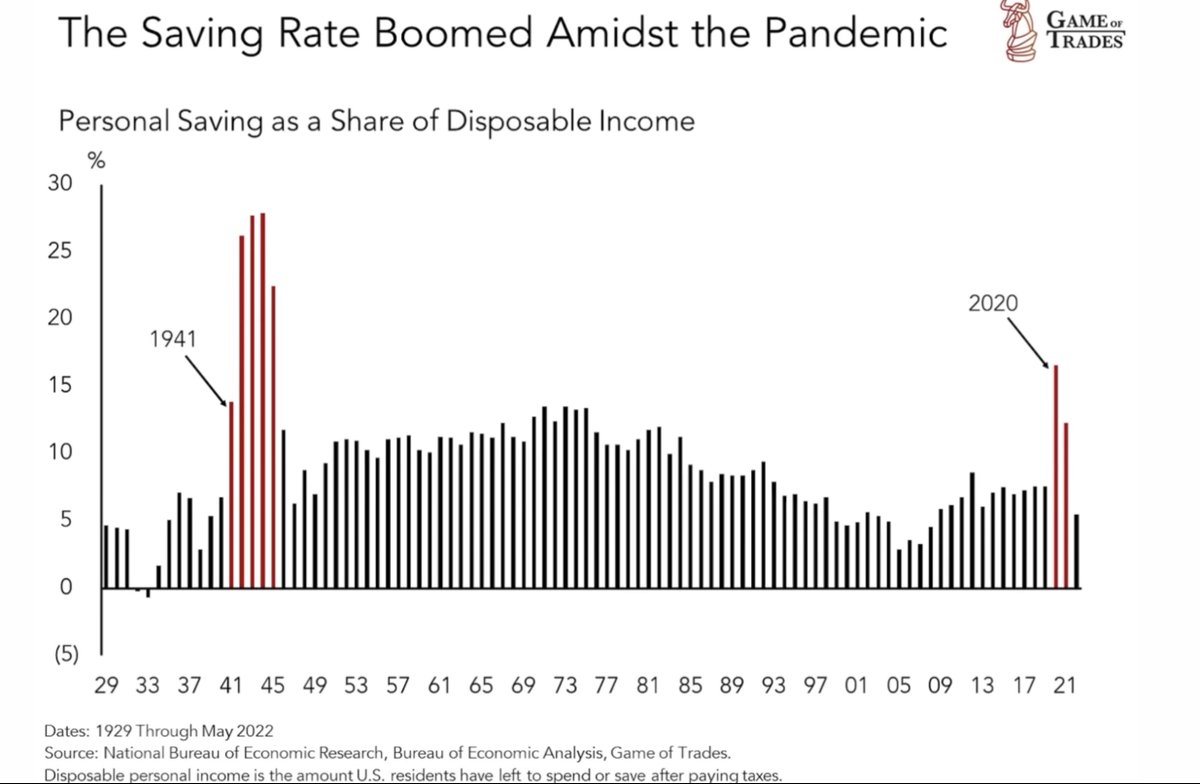
7/ High savings have helped consumers weather high inflation, tight monetary policy and economic weakening seen in 2022 and 2023
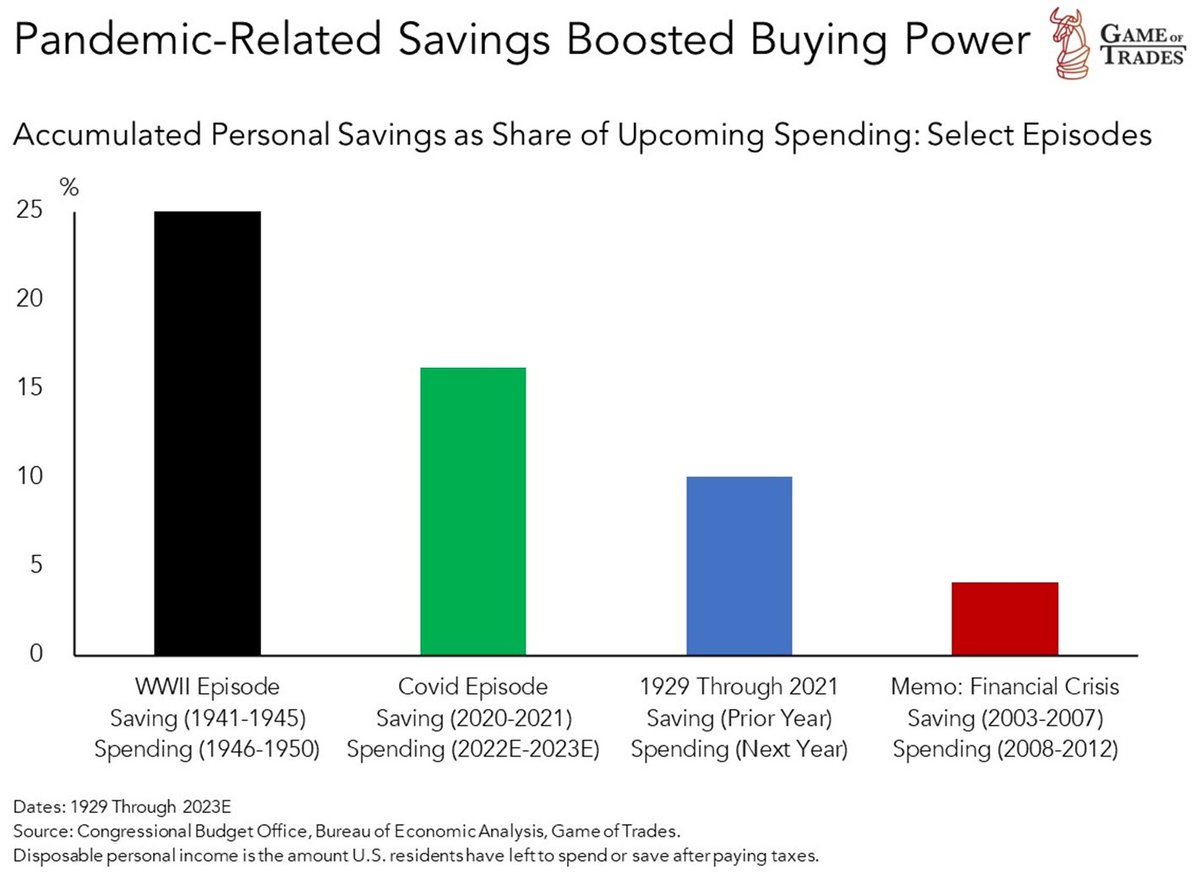
8/ In July 2022, we highlighted on that consumer savings in 2022 (green bar) were 50% higher than the 1929-2021 average (blue bar) https://t.co/oQRXBxWBaGgameoftrades.net
9/ During that period, retail interest spiked towards recessions, as most were expecting an imminent economic deterioration

The term "recession" hit record interest levels in June/July 2022
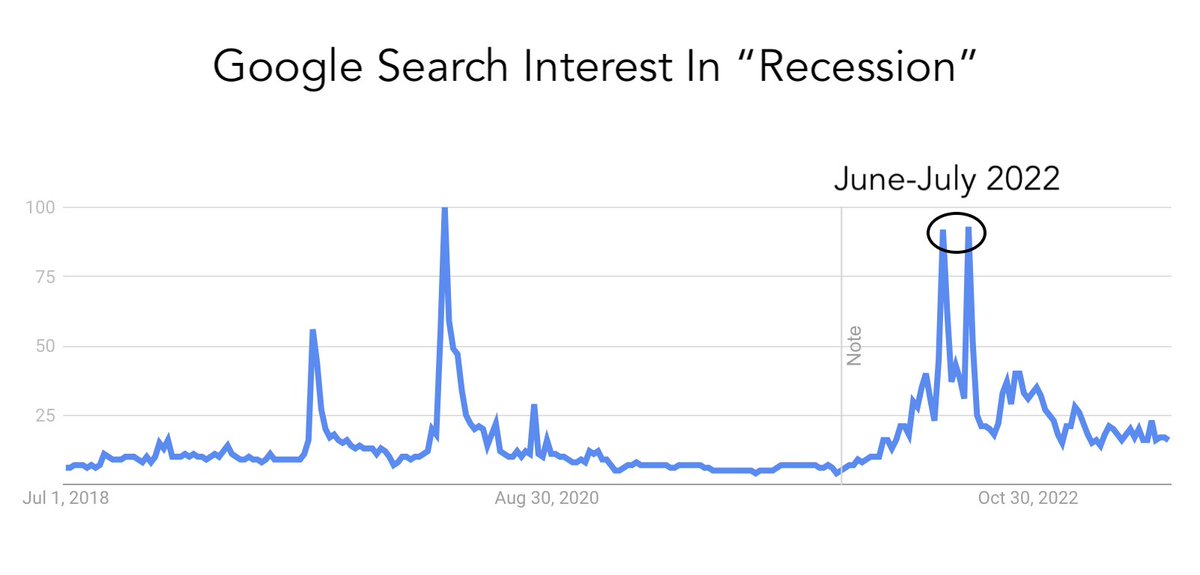
10/ Despite retail expecting a recession, consumers were financially healthier in mid-2022

The situation has since changed, as we'll discuss next
11/ By end of 2022, the savings rate dropped to historic lows as consumers tapped into savings due to a challenging macro environment
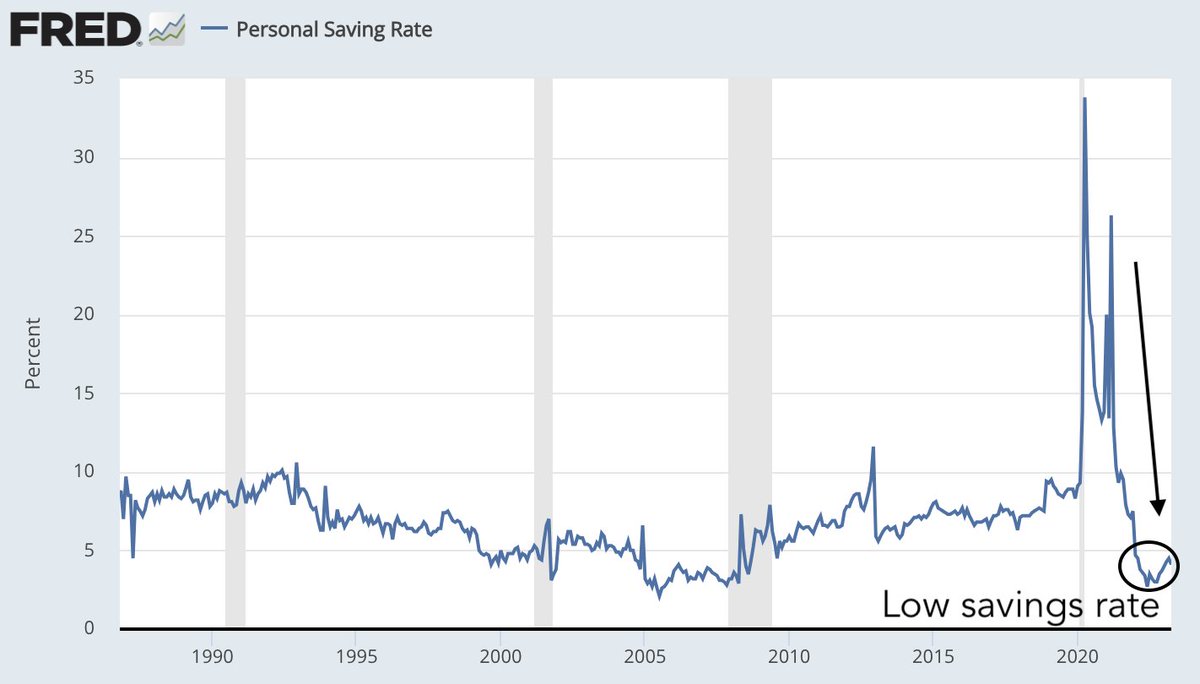
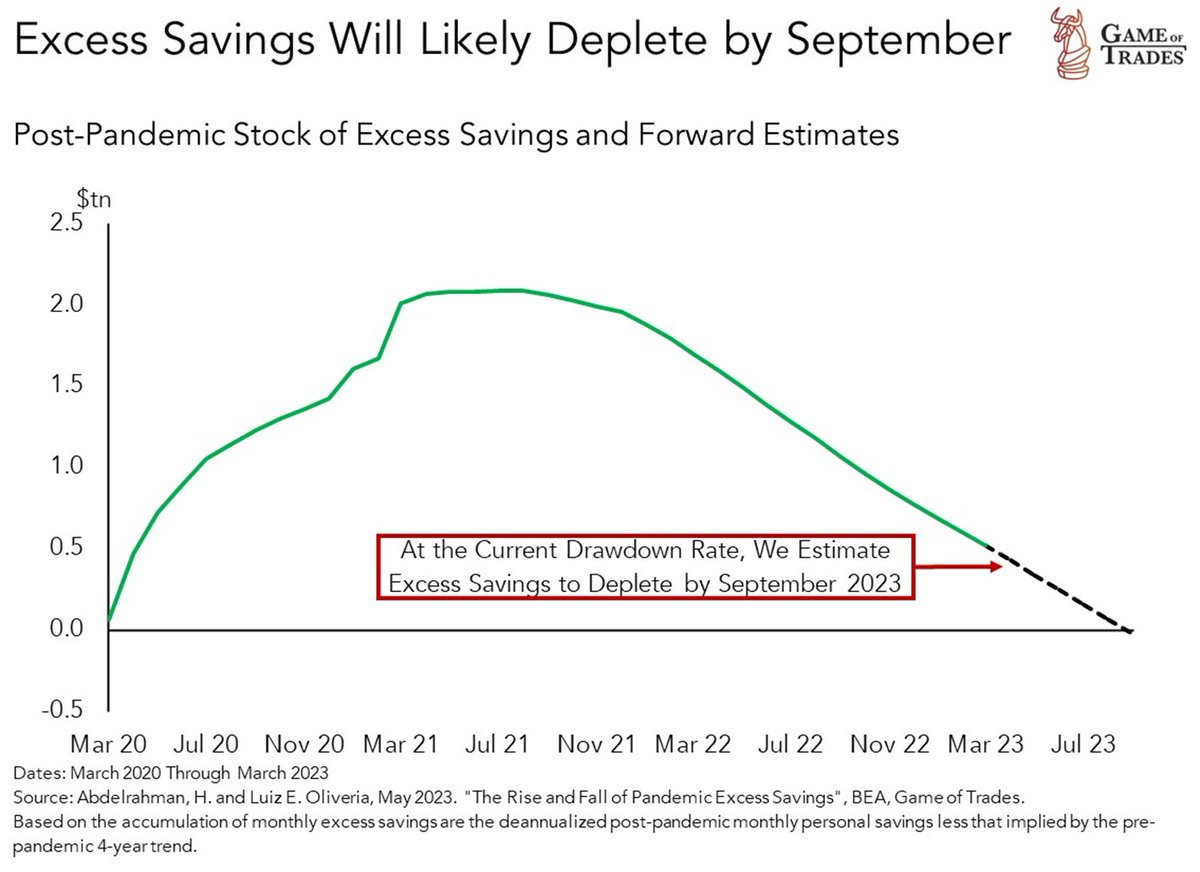
12/ Post-pandemic savings peaked at over $2tn in July 2021, but have been decreasing since

Current savings stand at $0.5tn and are expected to deplete by Sept 2023
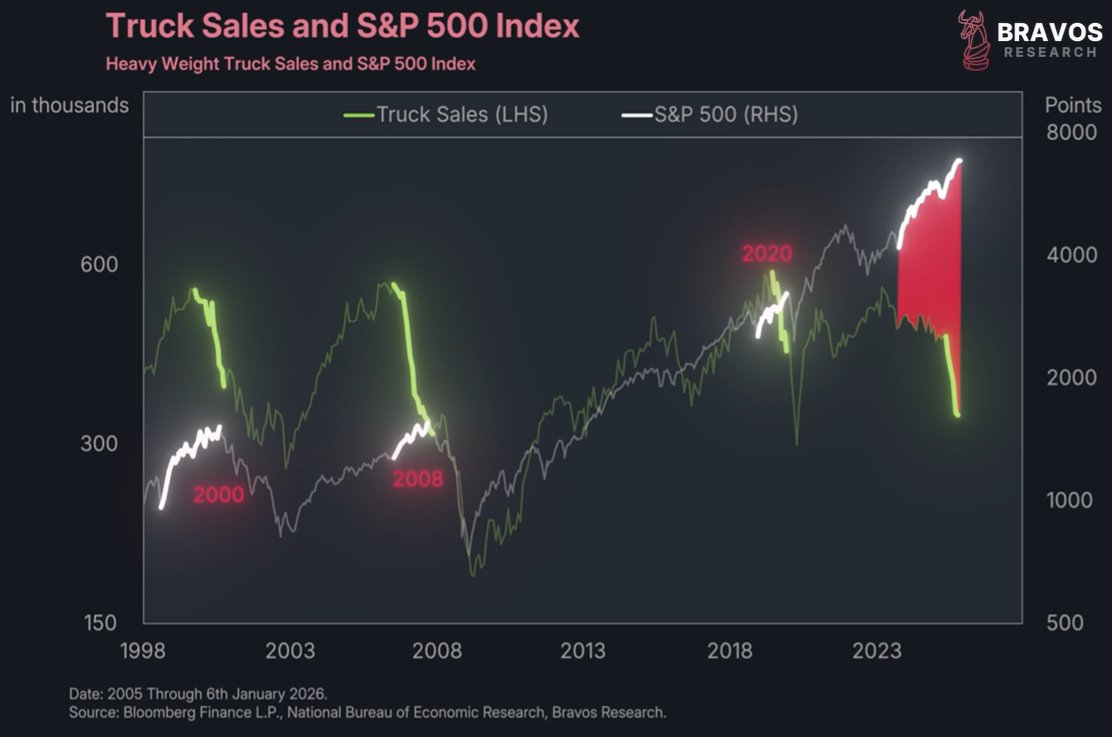
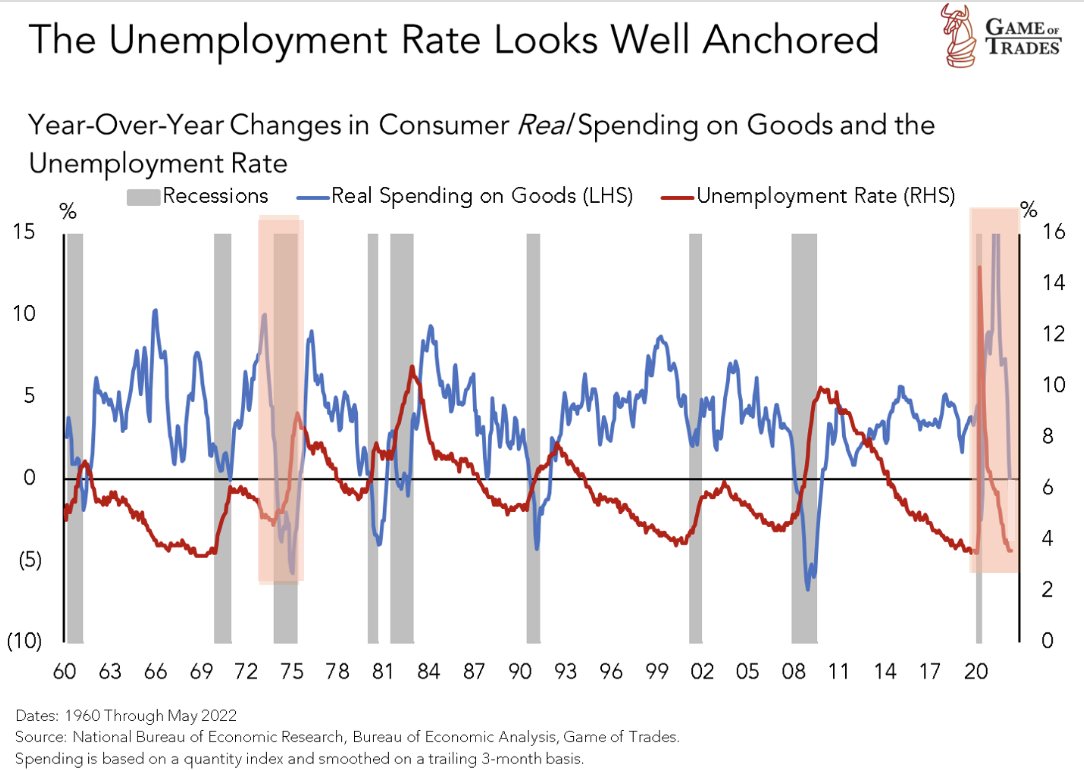
13/ The second factor preventing a recession so far is the robust labor market, with unemployment at historic lows
14/ A strong labor market usually boosts consumer spending

But as unemployment rises, consumer spending declines, often leading to a recession
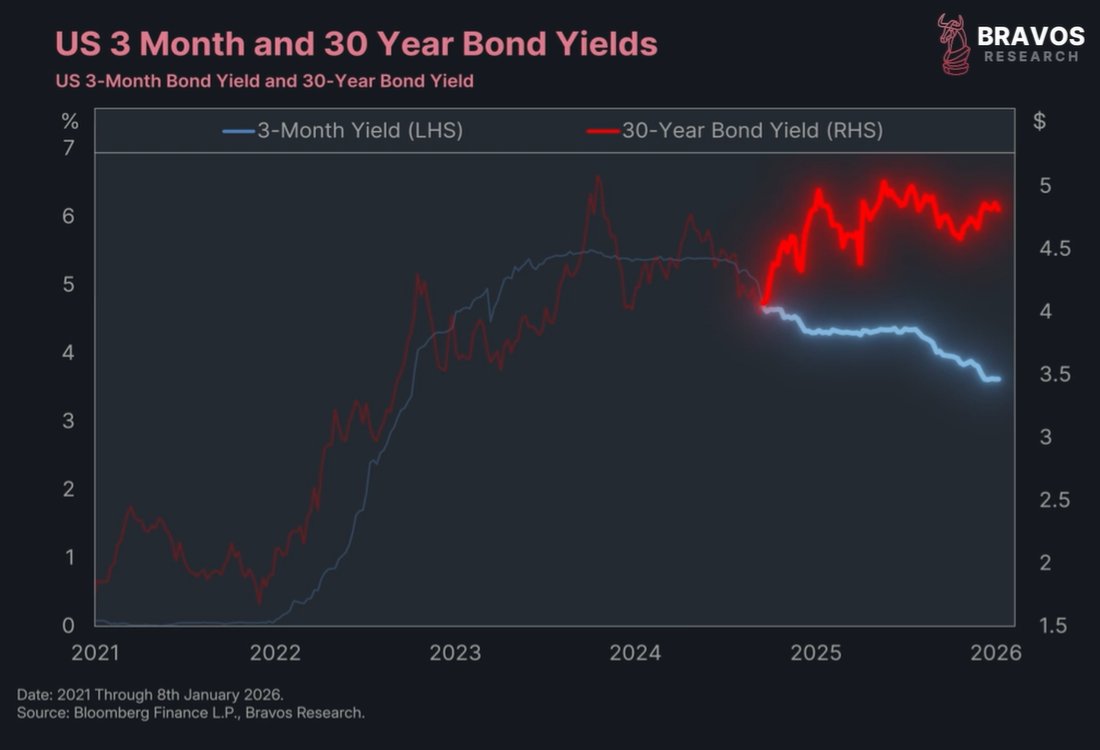
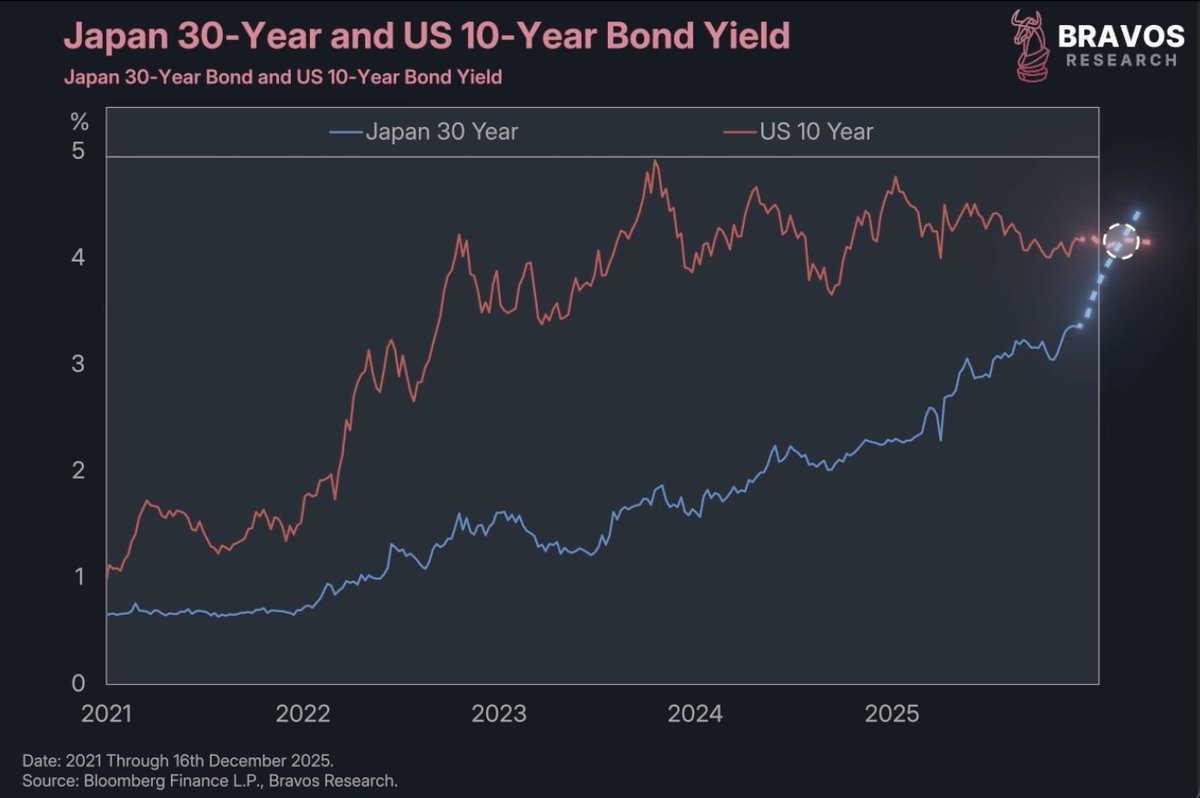
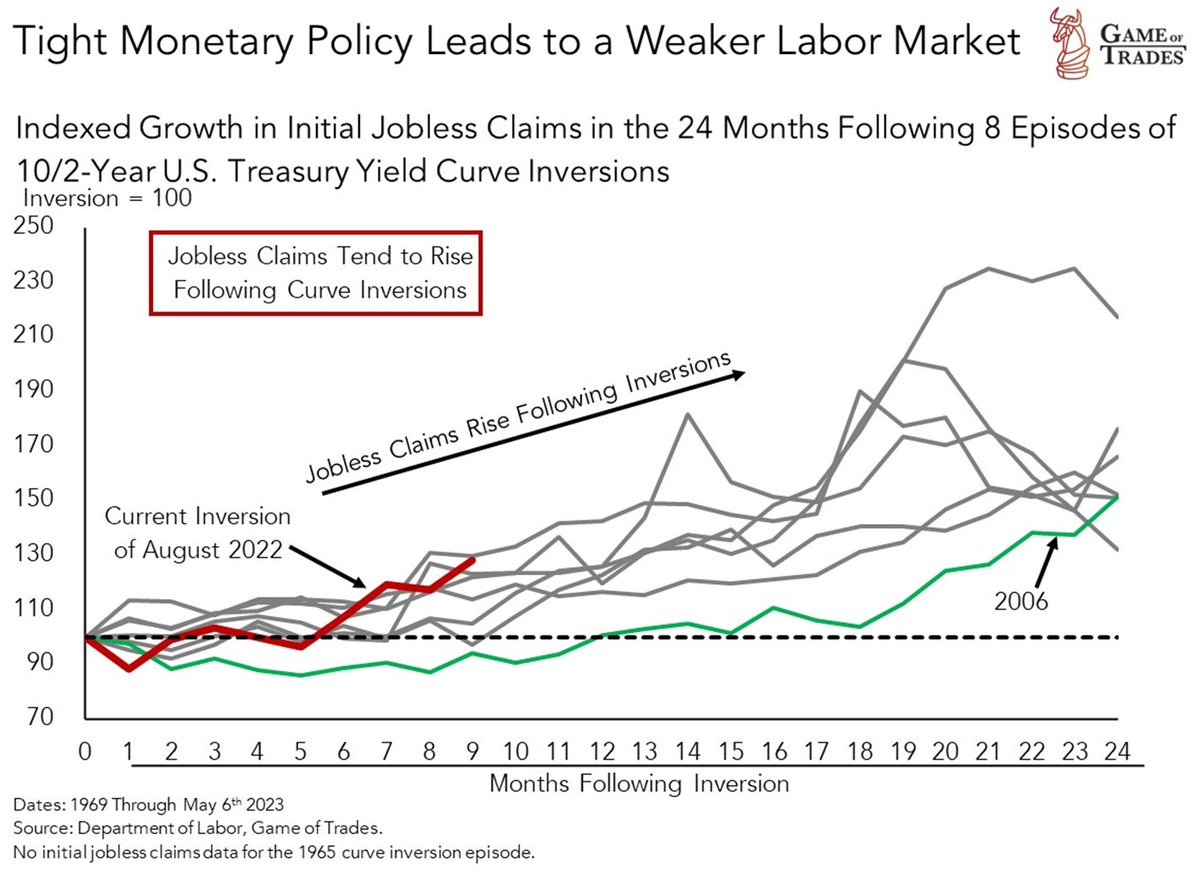
15/ Tight monetary policy has resulted in the deepest yield curve inversion since the 1980s
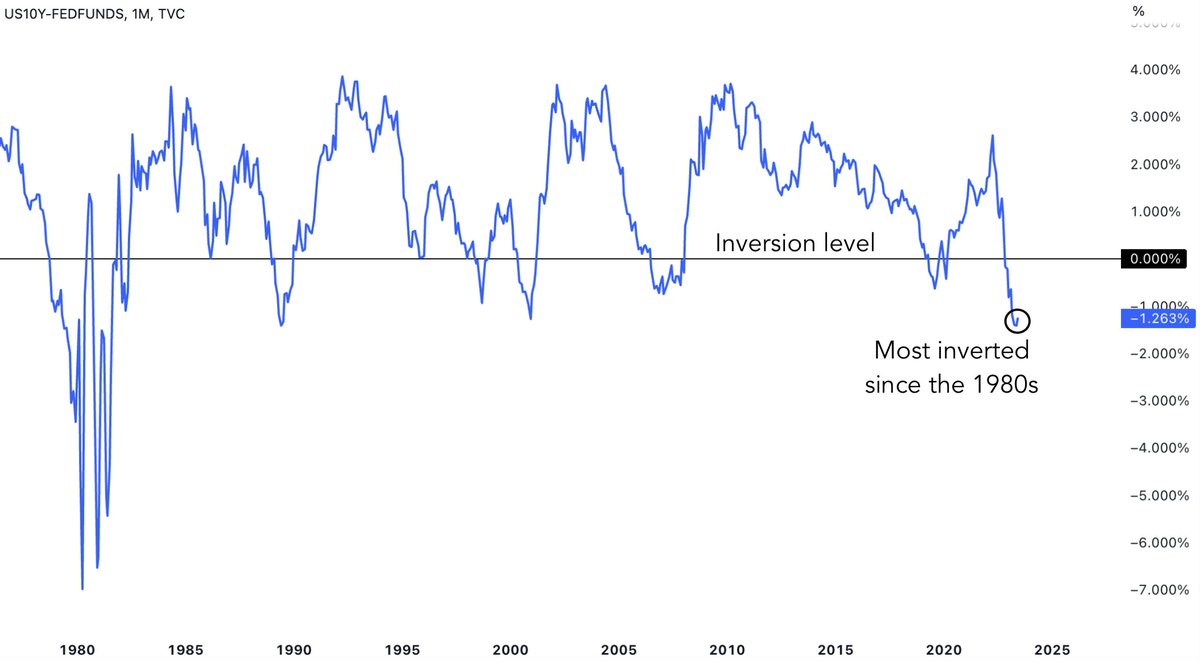
16/ After 8 inversions since 1969, jobless claims have typically risen for up to 24 months

Indicating that the labor market will likely weaken in the coming months, leading to a contraction in consumer spending - a typical recessionary development
17/ Despite economic uncertainties, there's one certainty you can bank on:

Our 20% OFF 4th of July sale!

Valid for a LIMITED time

Get a FREE trial at gameoftrades.net
18/ Thanks for reading!

If you found this thread valuable, please ❤️ and 🔁 the first tweet below

And follow @gameoftrades_ for more market insights, finance and investment strategies

• • •

Missing some Tweet in this thread? You can try to force a refresh
 

Keep Current with Bravos Research

Bravos Research Profile picture

Stay in touch and get notified when new unrolls are available from this author!

Read all threads

This Thread may be Removed Anytime!

PDF

Twitter may remove this content at anytime! Save it as PDF for later use!

Try unrolling a thread yourself!

how to unroll video
  1. Follow @ThreadReaderApp to mention us!

  2. From a Twitter thread mention us with a keyword "unroll"
@threadreaderapp unroll

Practice here first or read more on our help page!

More from @bravosresearch

Jul 18
Bitcoin surged 5,000% in 2016, 1,000% in 2020

And crashed 70% in both 2018 and 2022

This 1 Macro signal flashed before all of these moves

A thread 🧵 Image
2/ It’s a force every investor knows exists, but very few actually know how to use

It’s called global liquidity Image
3/ We can track global liquidity using this chart of global M2 money supply

Which reflects the liquidity provided by the world’s 20 largest central banks

Right now, that money supply is breaking out to the highest level ever recorded Image
Read 16 tweets
Jul 16
This is actually happening on Bitcoin

Buckle up.

A thread 🧵 Image
2/ What if I told you there’s 1 macro force that’s appeared before every major move Bitcoin has made over the last decade?

It showed up before Bitcoin’s 5,000% rally in 2016–2017

Before the 1,000% surge in 2020–2021

And right before the 70% crashes in 2018 and 2022 Image
3/ It’s a force every investor knows exists, but very few actually know how to use

It’s called global liquidity

And believe it or not, it’s flashing another major signal right now that could tell us where Bitcoin is headed by August of this year Image
Read 31 tweets
Jul 11
US stock market has rallied +25% in just 60 trading days

This has only happened 8 times since the 1970s

Here’s what typically happens next

A thread 🧵 Image
2/ We just sold most of our US stock market exposure on our website

The S&P 500 is at all-time highs after a spectacular melt-up

We've been holding multiple tech and industrial trades over the last few months

But we've now sent out sell alerts to all of our clients Image
3/ We're making this move because we believe a major opportunity is coming in the next month

And we want to be ready to take advantage of it

Also, this is your last chance to use our 4th of July 30% DISCOUNT

Only a few hours left before it expires Image
Read 28 tweets
Jul 9
History is REPEATING

Buckle up.

A thread 🧵 Image
2/ June 2009, June 2020, and June 2025 have each kicked off V-shaped recoveries for stocks

In all 3 cases, the S&P 500 surged more than 20% in just 55 trading days

Something that hasn’t occurred at any other point in the last 15 years Image
3/ In both 2009 and 2020, the rally didn’t stop there

The S&P 500 added another 20% in the following 80 days

So far, 2025 is shaping up to be another strong year for us Image
Read 25 tweets
Jul 4
Every major US recession since 1980 was preceded by this signal

And it has just triggered once again

Buckle up.

A thread 🧵 Image
2/ This line you see here has surged right before every US recession since the 1980s

It’s from the Conference Board’s Consumer Confidence Survey, showing how consumers feel about the future of the job market Image
3/ More precisely, it tracks the percentage of consumers expecting fewer jobs over the next 6 months

Today, that number sits around 30% Image
Read 25 tweets
Jul 3
US stock market has completed a V-shaped recovery

This is what typically happens next…

A thread 🧵 Image
2/ The S&P 500 has hit new all time highs following a V-shaped recovery

That rally’s been powered by a wave of FOMO buying

Plus a short squeeze

As investors hedging for downside had to cover, forcing them to buy the index Image
3/ After a rapid V-shaped recovery, investors rush back into the market

They pour into a handful of large cap companies

And right as the index makes a new all-time high, everyone is convinced the market is heading higher

That’s the moment it actually corrects, before resuming higher
Read 10 tweets

Did Thread Reader help you today?

Support us! We are indie developers!


This site is made by just two indie developers on a laptop doing marketing, support and development! Read more about the story.

Become a Premium Member ($3/month or $30/year) and get exclusive features!

Become Premium

Don't want to be a Premium member but still want to support us?

Make a small donation by buying us coffee ($5) or help with server cost ($10)

Donate via Paypal

Or Donate anonymously using crypto!

Ethereum

0xfe58350B80634f60Fa6Dc149a72b4DFbc17D341E copy

Bitcoin

3ATGMxNzCUFzxpMCHL5sWSt4DVtS8UqXpi copy

Thank you for your support!

Follow Us!

:(