"HOW TO TRADE A RANGE? "
Content:
I. What Defines a Range?
II. Components of a Range
III. Power of Equilibrium
IV. Trading a Deviation
V. Examples
🧵(1/13)
Content:
I. What Defines a Range?
II. Components of a Range
III. Power of Equilibrium
IV. Trading a Deviation
V. Examples
🧵(1/13)

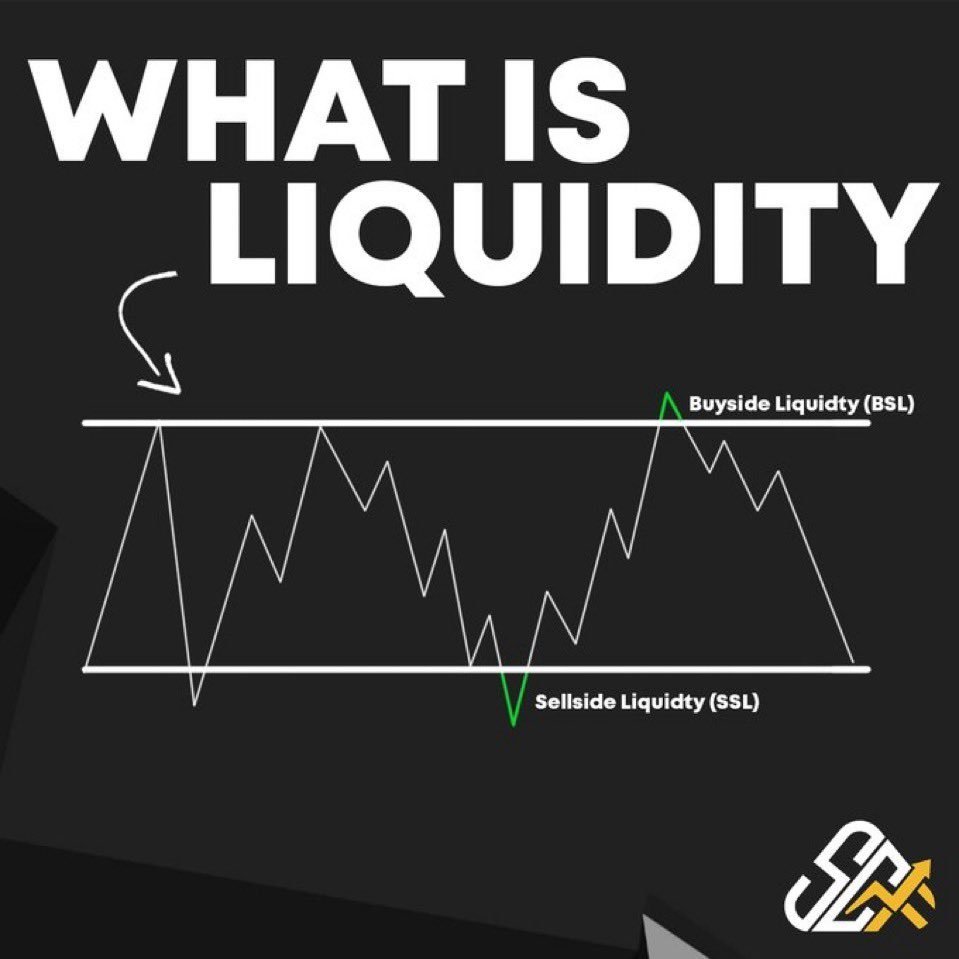
WHAT DEFINES AS A RANGE?
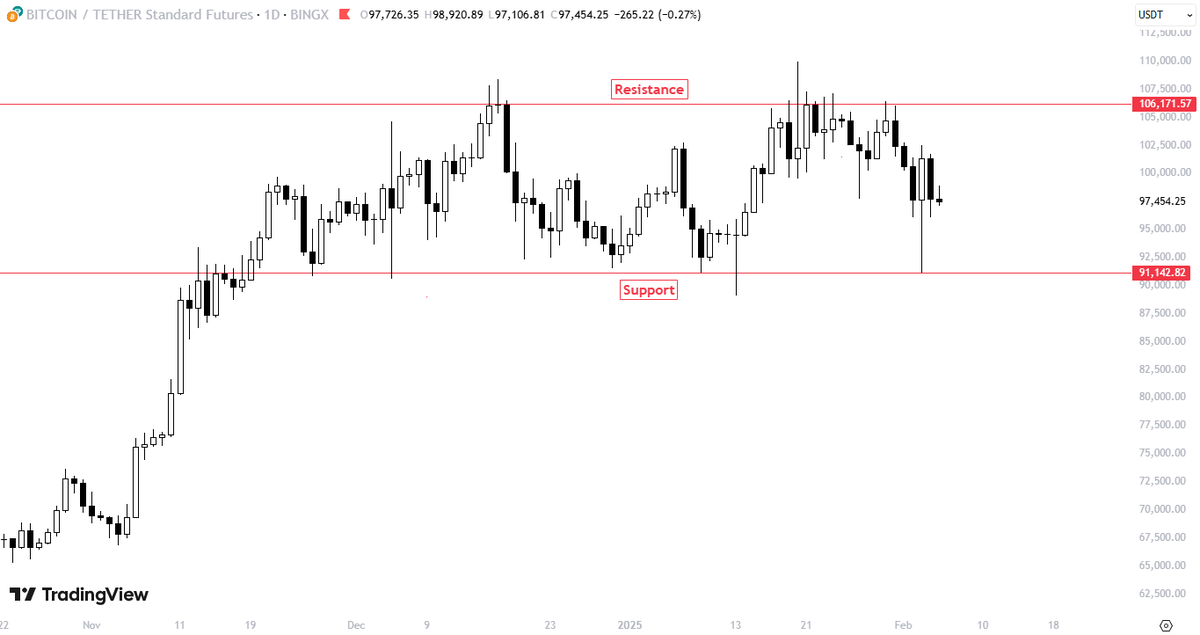
In a chart, a range refers to a recognizable pattern where prices consistently reach similar high and low points at specific levels or prices.
This pattern creates a distinct range on the chart, with clear upper and lower boundaries.
In a chart, a range refers to a recognizable pattern where prices consistently reach similar high and low points at specific levels or prices.
This pattern creates a distinct range on the chart, with clear upper and lower boundaries.

Prices tend to stay within a certain range, showing consolidation.
The lines shown in the chart represent important levels where the price repeatedly bounces back, creating a clear range.
These lines act like barriers that prevent the price from moving beyond a certain range
The lines shown in the chart represent important levels where the price repeatedly bounces back, creating a clear range.
These lines act like barriers that prevent the price from moving beyond a certain range
II. COMPONENTS OF A RANGE
To make a range, you need to check off the following criteria below:
1. A High where price tends to bounce back from
2. A Low where price tends to bounce back from
3. The 50% of the middle of the High and Low
To make a range, you need to check off the following criteria below:
1. A High where price tends to bounce back from
2. A Low where price tends to bounce back from
3. The 50% of the middle of the High and Low
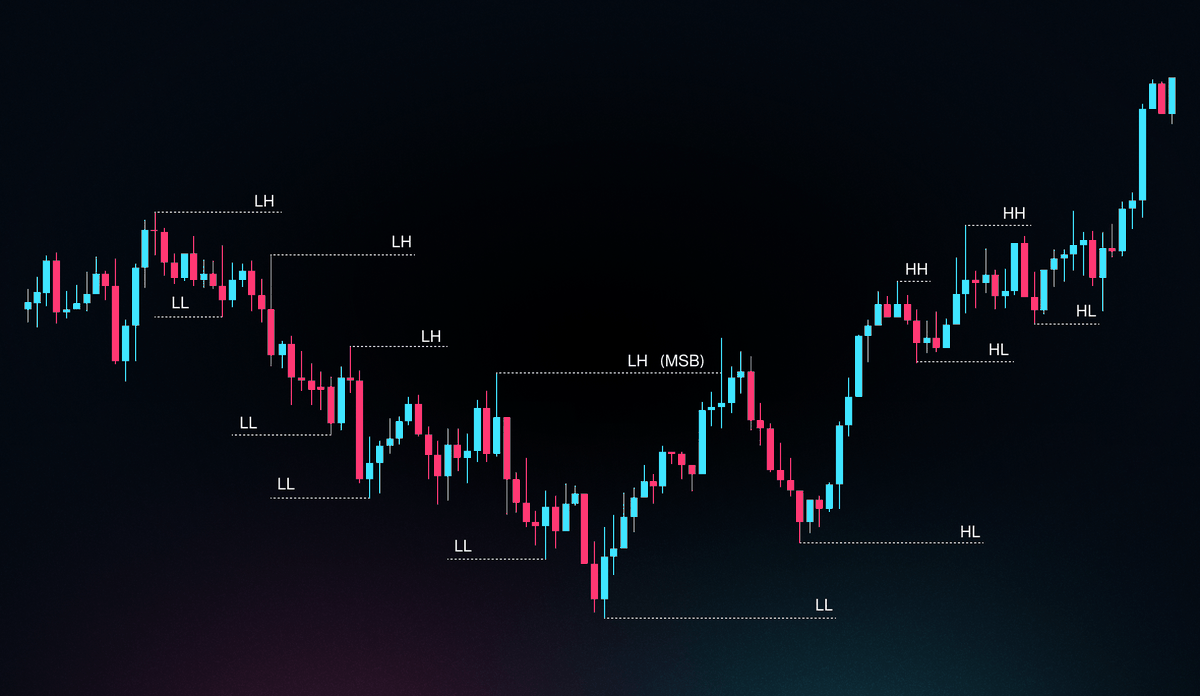
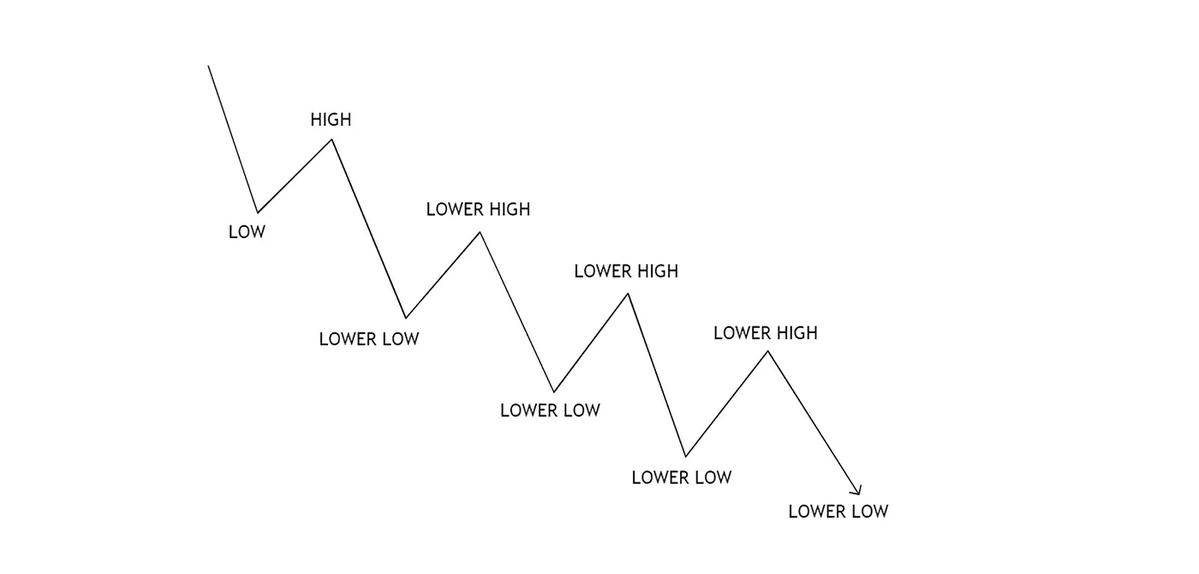
HOW TO ANTICIPATE A RANGE?
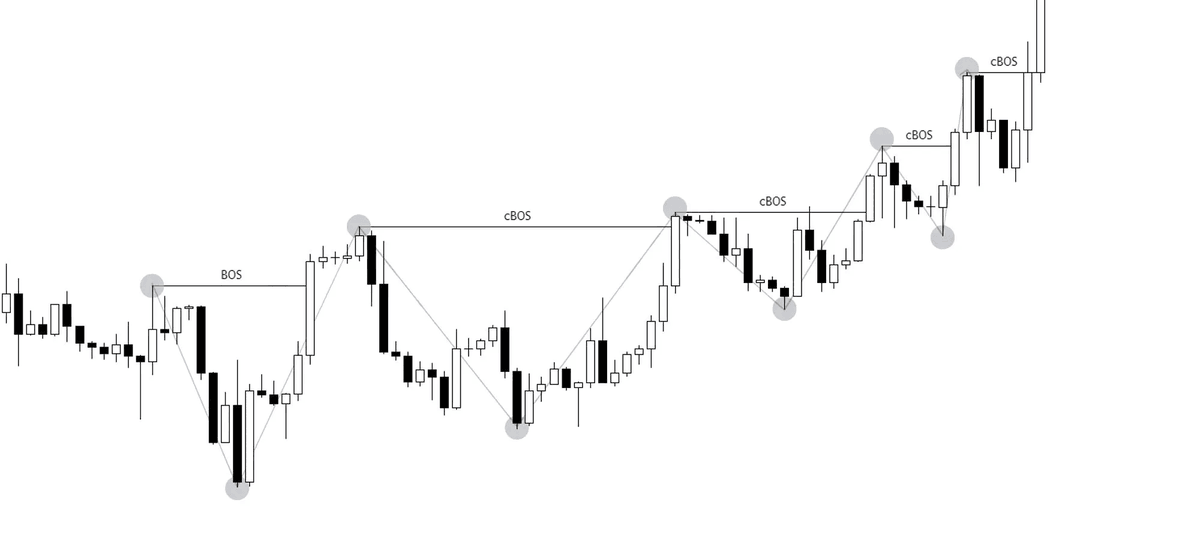
1. Let’s say that price is trending heavily on the upside, what we will do is wait for price to make this specific price movement:
It is when price makes a short term high then puts a low and then breaks the short term high.
1. Let’s say that price is trending heavily on the upside, what we will do is wait for price to make this specific price movement:
It is when price makes a short term high then puts a low and then breaks the short term high.

2. Once we establish this, we can now put on our Parallel Channel tool with our 50% or Equilibrium level.
We will also wait for the candle close of the new High that was made to anticipate whether there is momentum or not.
We will also wait for the candle close of the new High that was made to anticipate whether there is momentum or not.

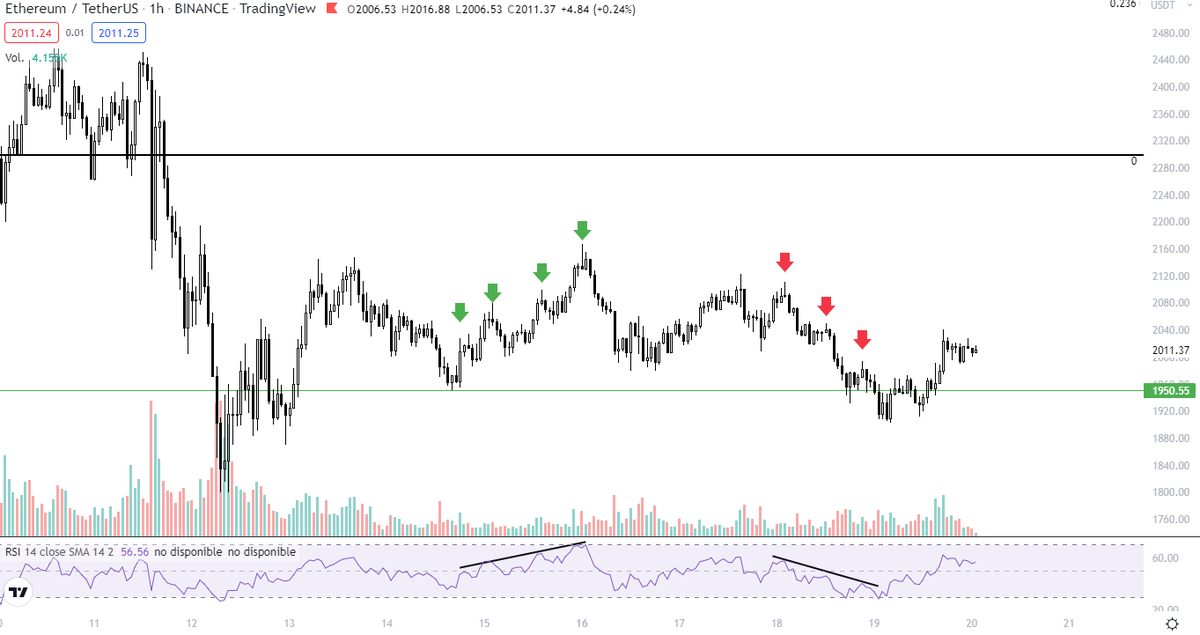
3. We can now wait for signals from the indicators you are using, candlestick patterns or just pure Price Action for price to reverse.
A good indicator that price might reverse is when the next candle is bearish candle.
A good indicator that price might reverse is when the next candle is bearish candle.

4. Once we reach the Low, we will wait for any good indication that price will bounce back into the range, either via an indicator, candlestick patterns or Price Action.
Another good indication is a bullish engulfing going back into the range.
Another good indication is a bullish engulfing going back into the range.

5. Then we can just repeat this, until the Range is invalidated.
A good indication of a range being invalidated is continuous big candles forming without any sign of stopping.
That’s why PATIENCE is key when playing a range, we always wait for a good indication of reversal.
A good indication of a range being invalidated is continuous big candles forming without any sign of stopping.
That’s why PATIENCE is key when playing a range, we always wait for a good indication of reversal.

III. POWER OF EQUILIBRIUM
The equilibrium or the 50% of the Range is a powerful tool to utilize.
It can be used as a level price can really bounce off of. You can see below how price reacts a lot on the Equilibrium.
How can we utilize this?
The equilibrium or the 50% of the Range is a powerful tool to utilize.
It can be used as a level price can really bounce off of. You can see below how price reacts a lot on the Equilibrium.
How can we utilize this?

1. We can use it as place to put a TP, since we know price tends to bounce back or get rejected here, so we can secure profits.
2. We can also use it as a level of interest on the HTF and place a trade on the LTF, waiting for the price to get bounce from there.
2. We can also use it as a level of interest on the HTF and place a trade on the LTF, waiting for the price to get bounce from there.
IV. TRADING A DEVIATION
Is arguably the best PA pattern you can come across.
This PA pattern is powerful to use, we will just wait for a close back above the range and wait for any indication of price wanting to go higher
Real example:
Is arguably the best PA pattern you can come across.
This PA pattern is powerful to use, we will just wait for a close back above the range and wait for any indication of price wanting to go higher
Real example:


This is a simple but comprehensive guide on Ranges. It's the basics of it, ranges can be invalidated.
If you liked the thread consider to SUBSCRIBE to the YouTube channel:
LIKE and RT for expand the free knowledge is highly appreciated.youtube.com/@SCFcrypto
If you liked the thread consider to SUBSCRIBE to the YouTube channel:
LIKE and RT for expand the free knowledge is highly appreciated.youtube.com/@SCFcrypto
• • •
Missing some Tweet in this thread? You can try to
force a refresh