
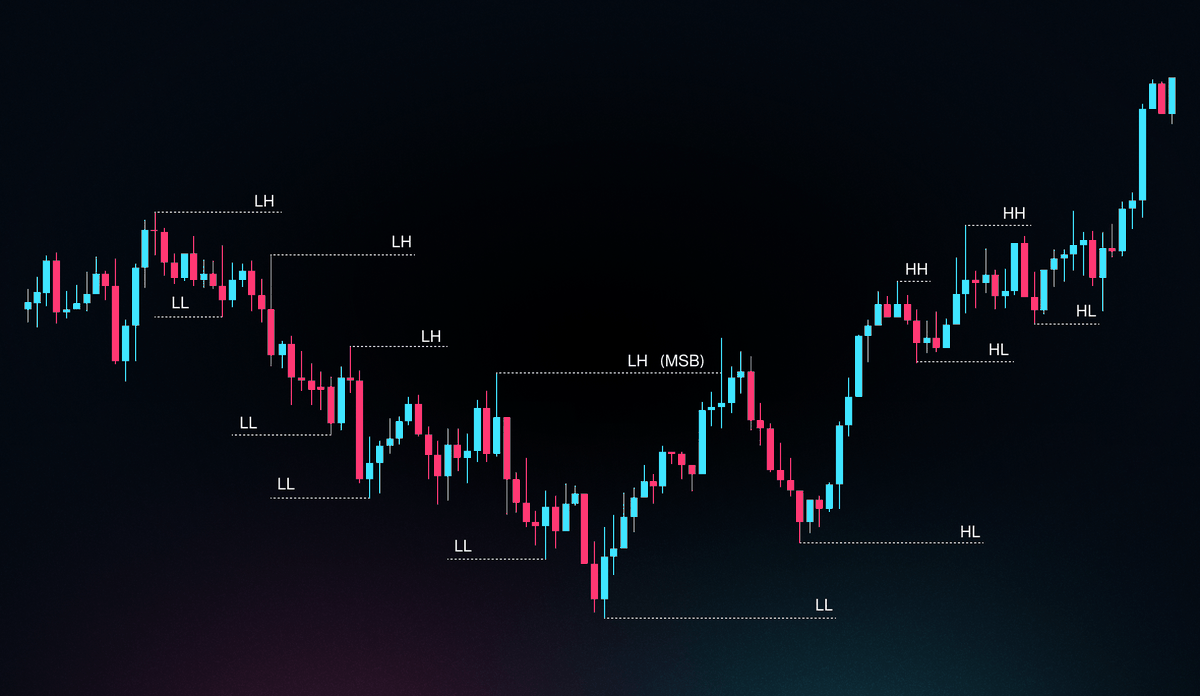
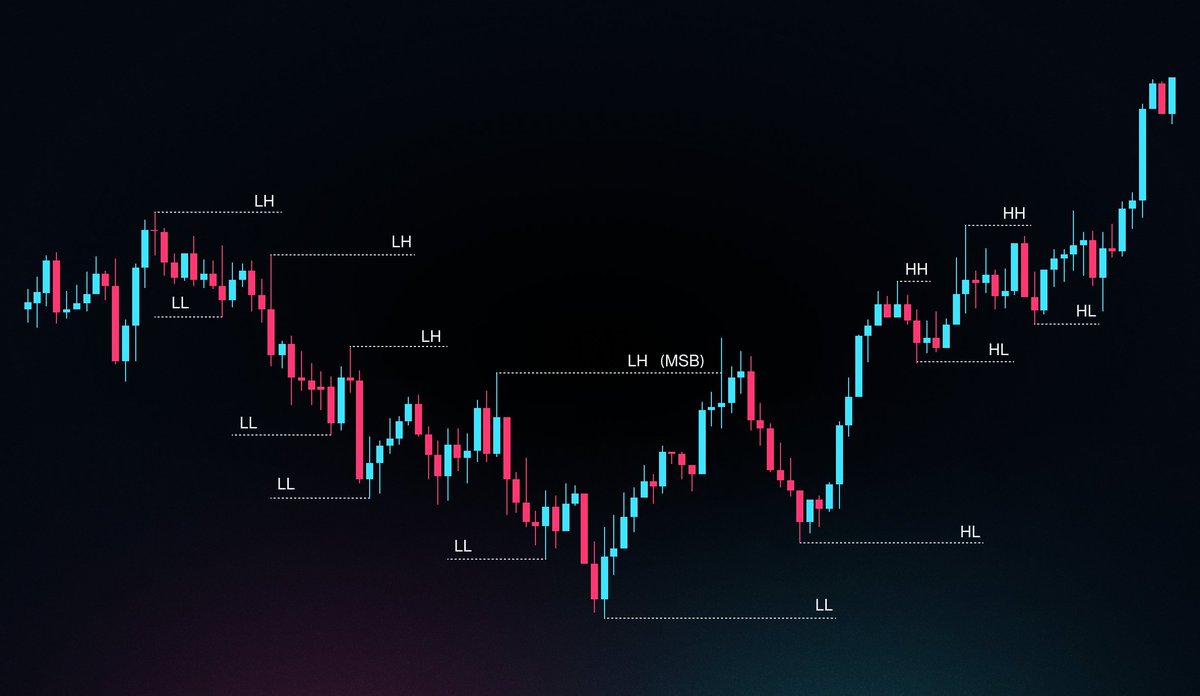
 1. What is Market Structure?
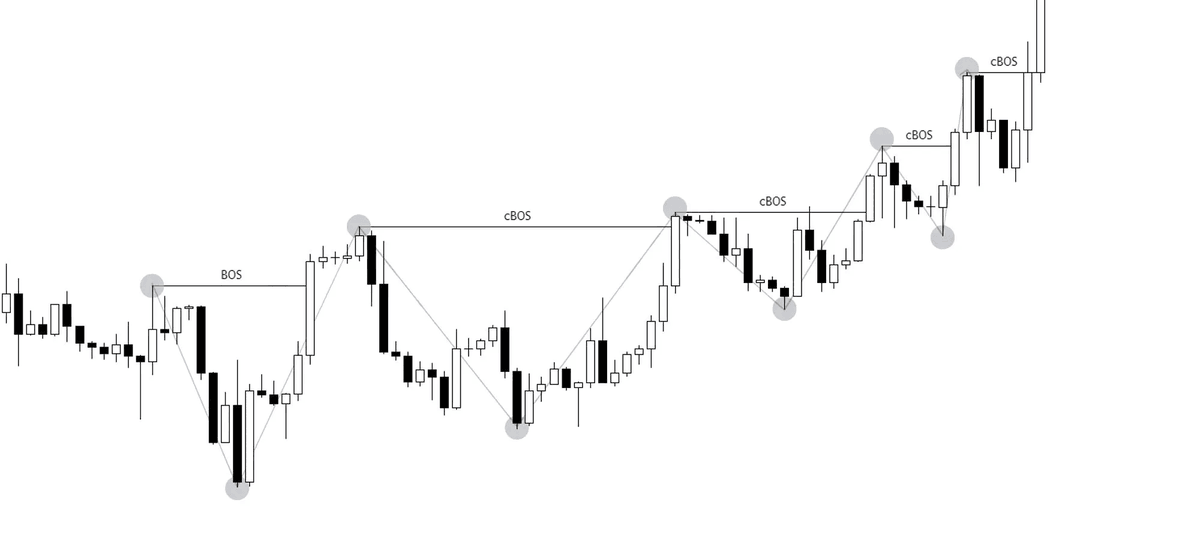
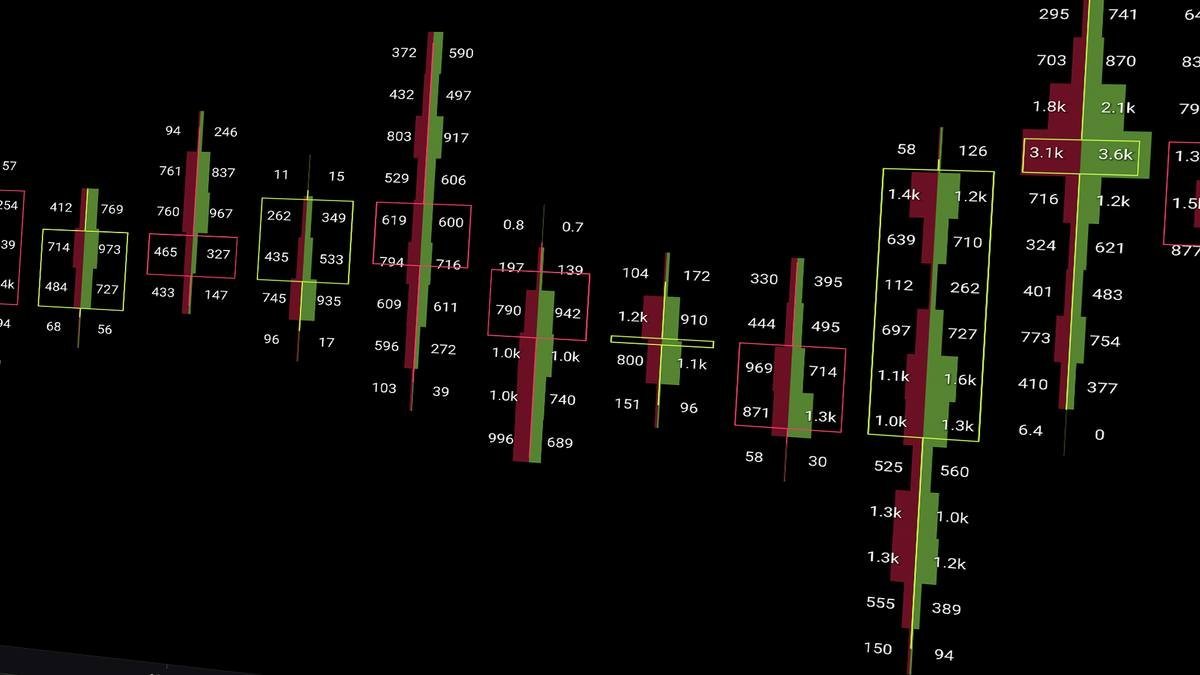 1. Footprint Charts
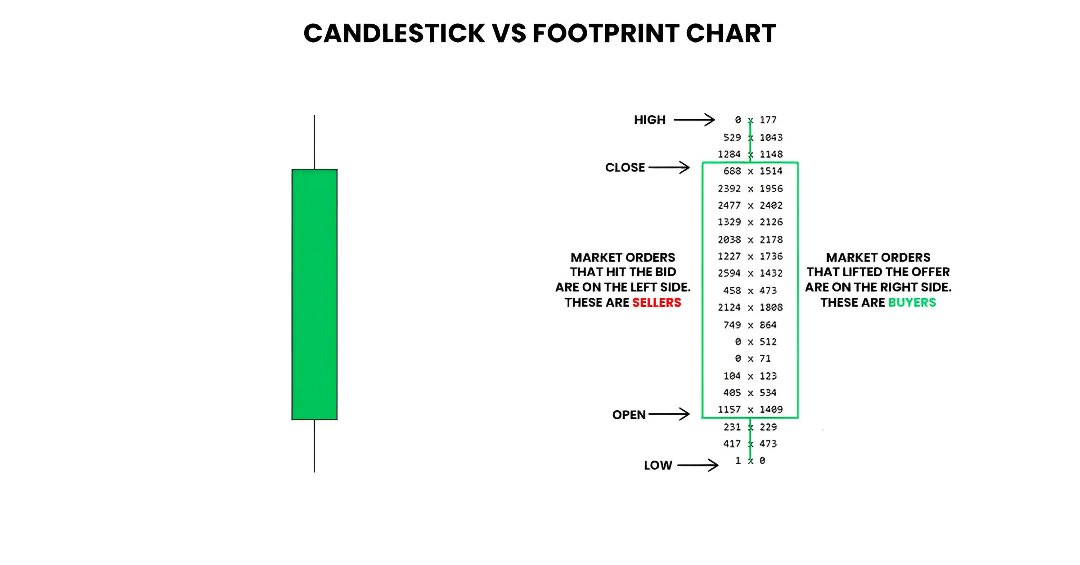
 1. MACD
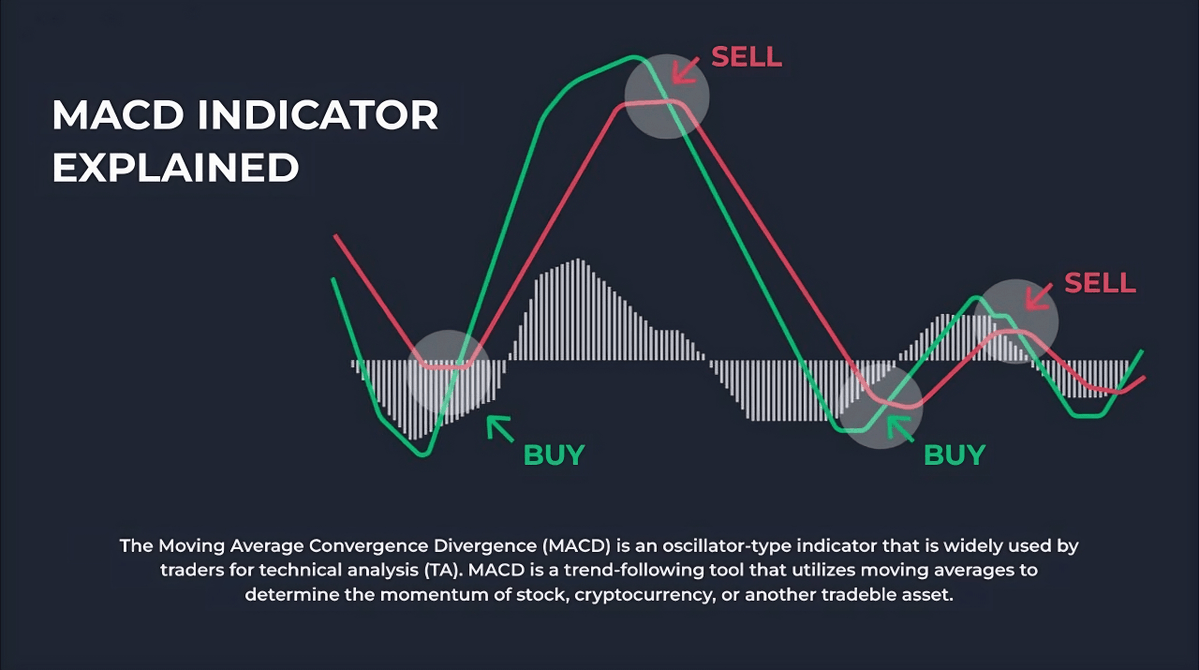
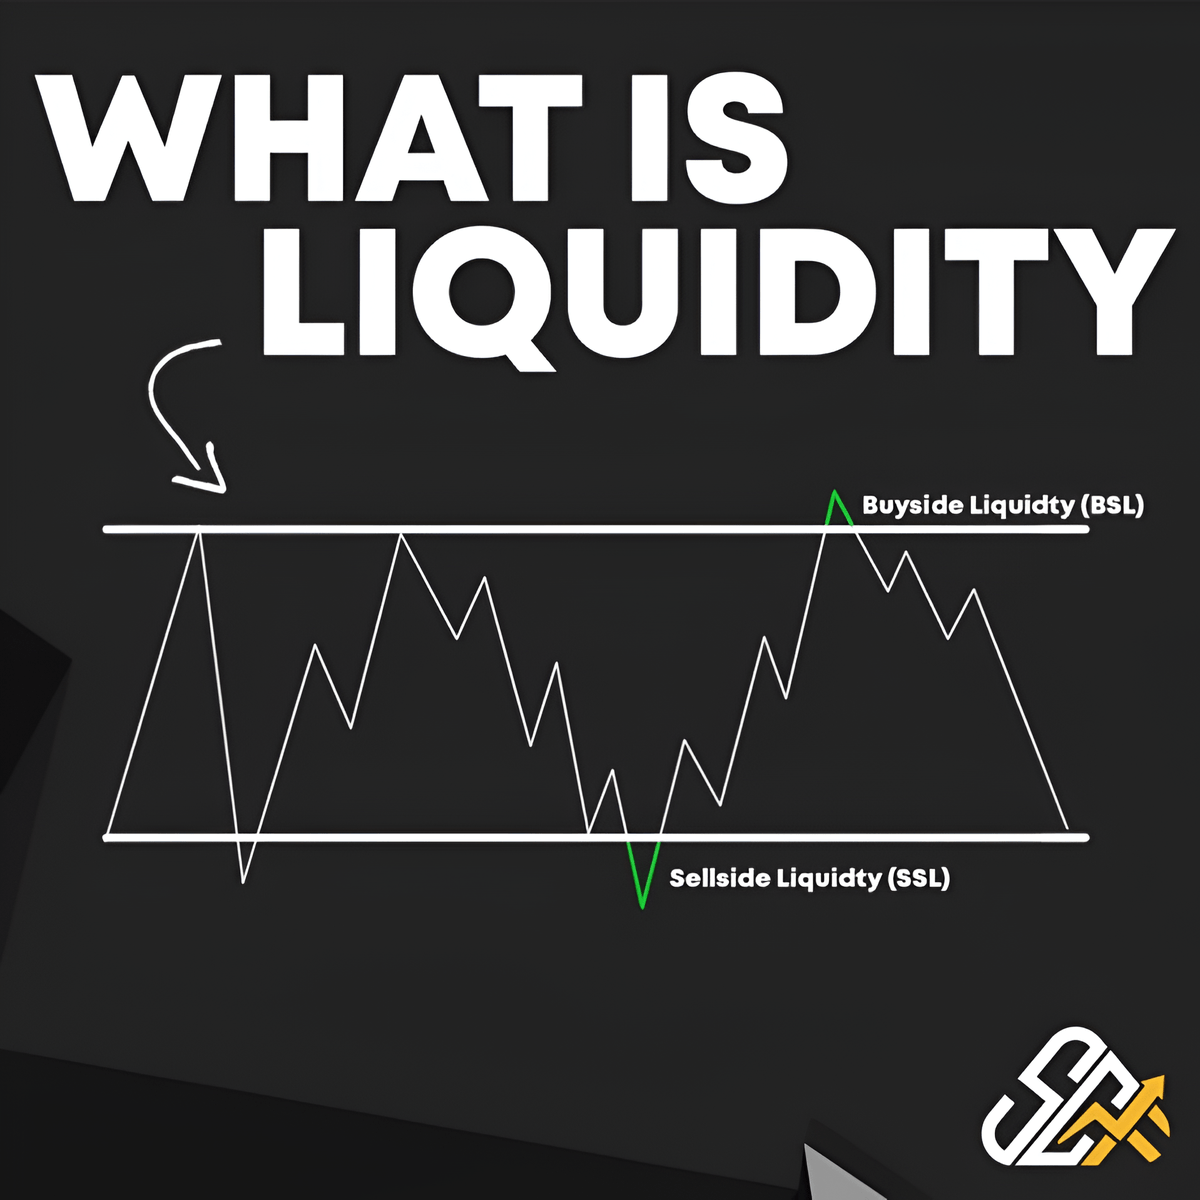
 1. Where is the Liquidity?
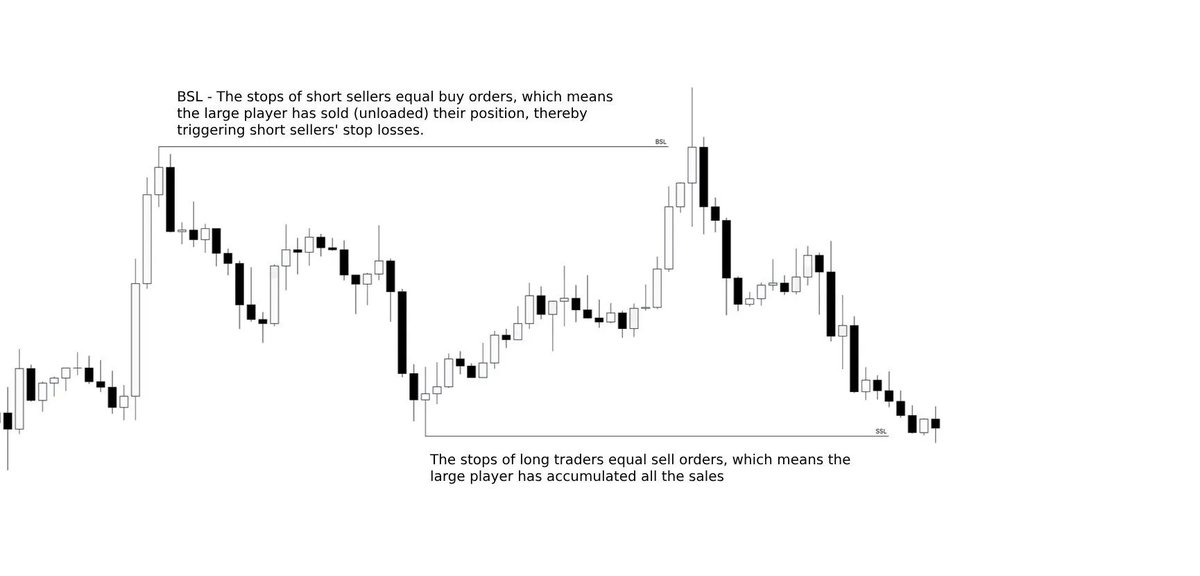

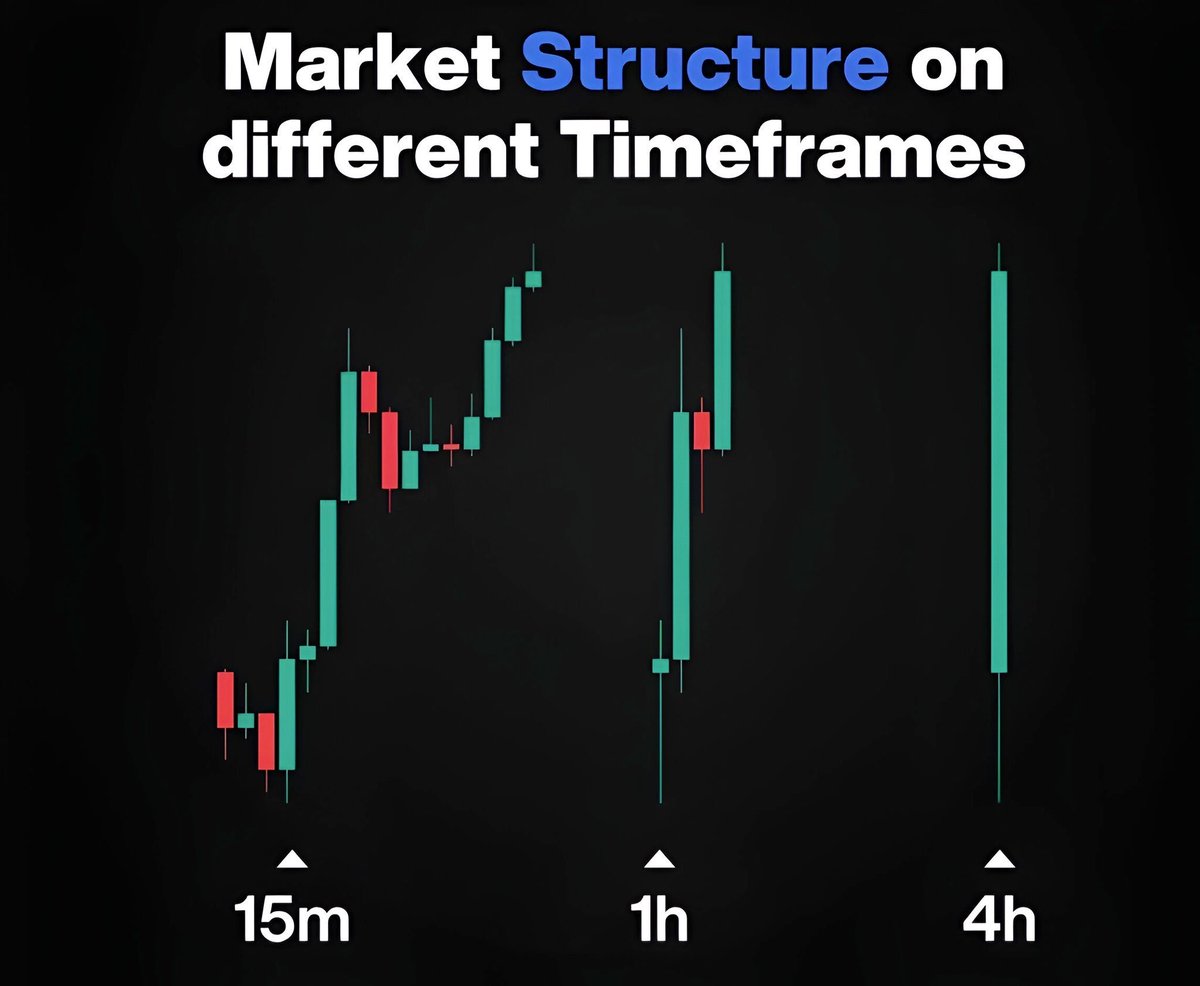 1. Higher Timeframe
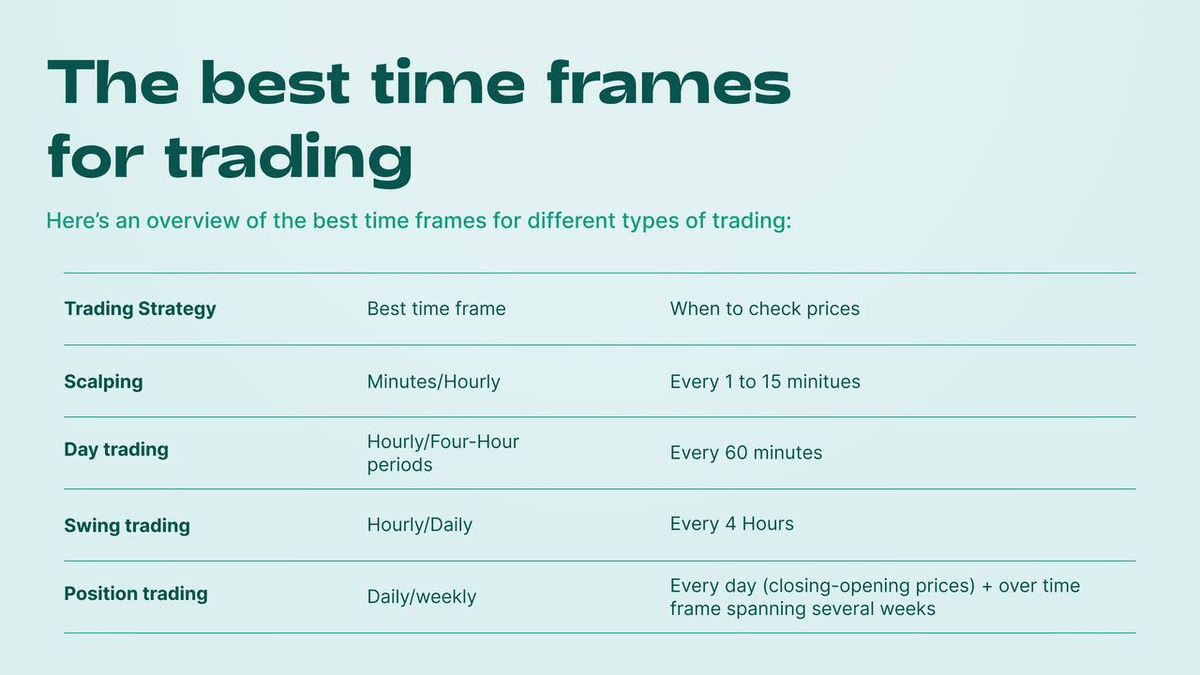
 1. RSI
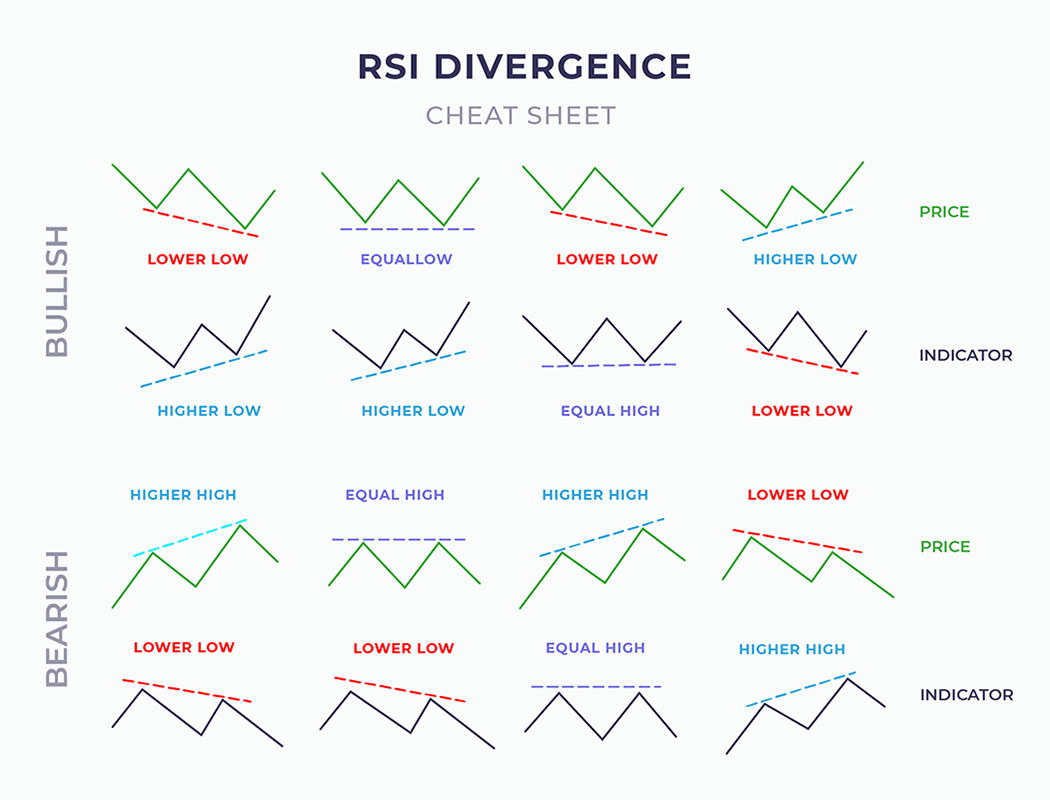
 1. Support and Resistance
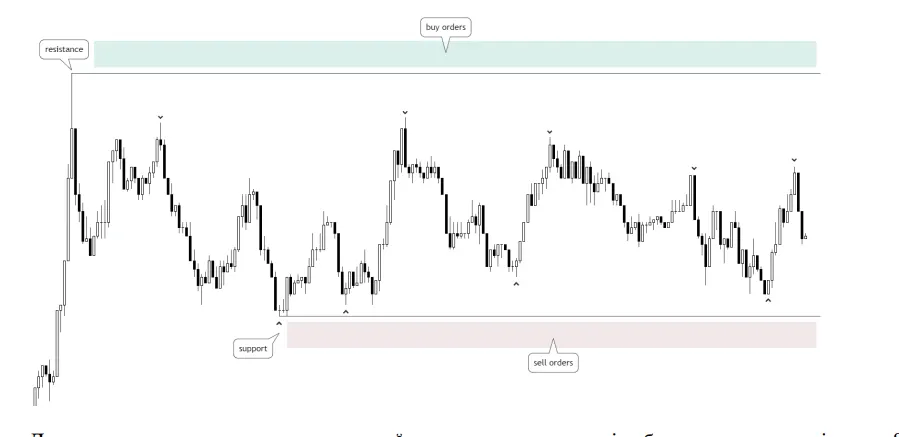
 1. What is Market Structure?
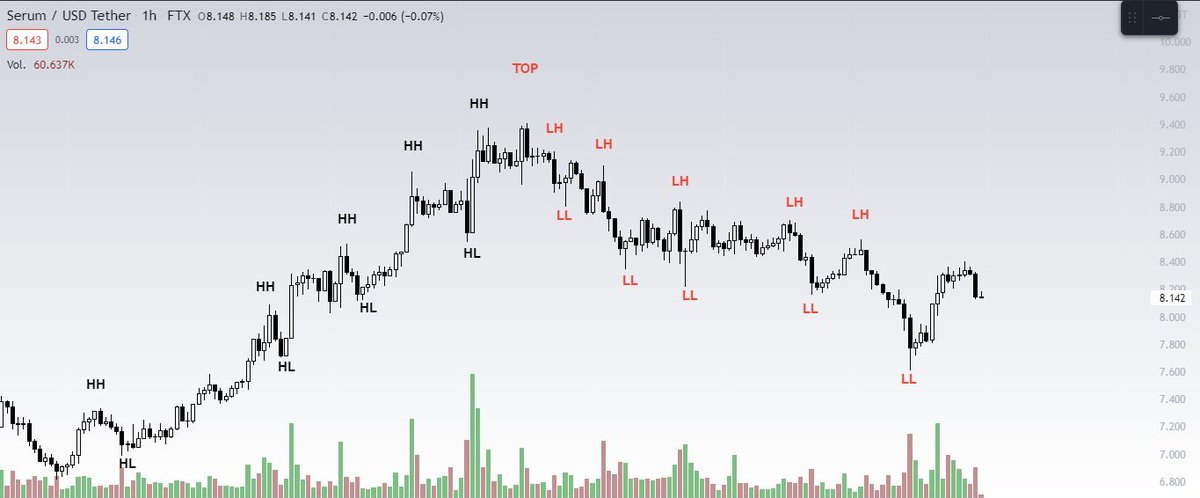
 1. Where is the Liquidity?
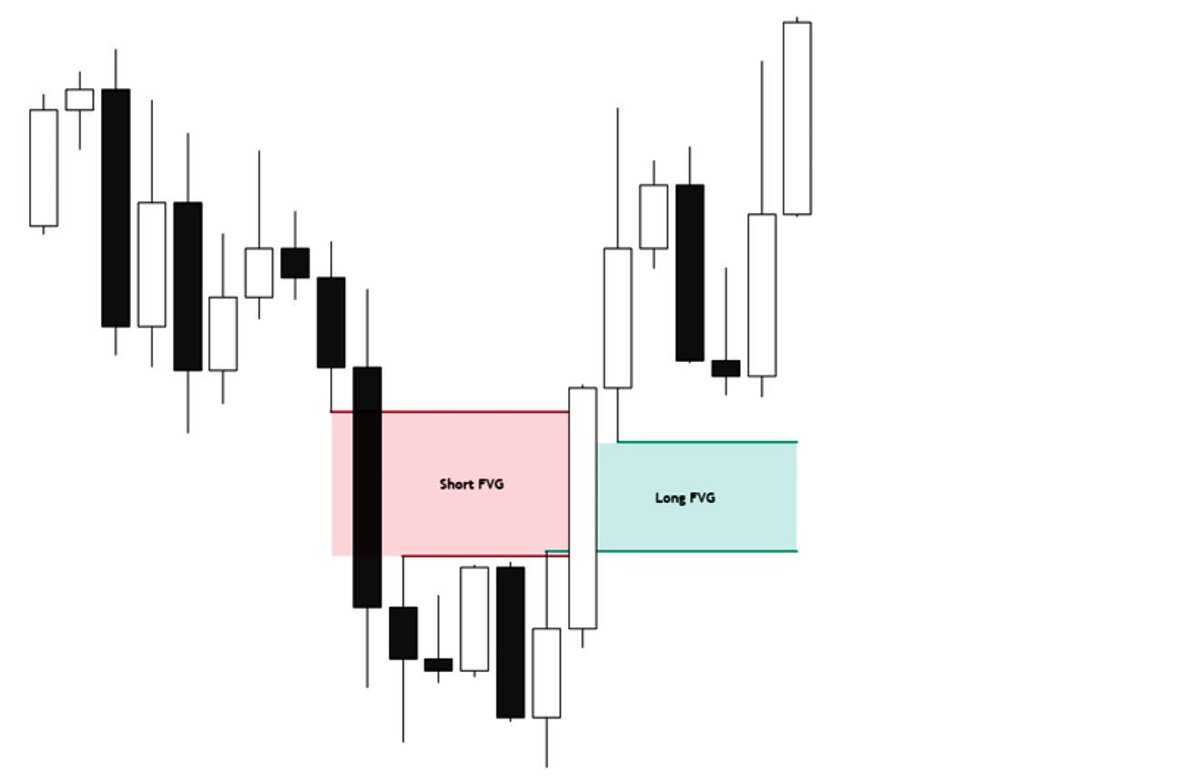
 1. Where is the Liquidity?
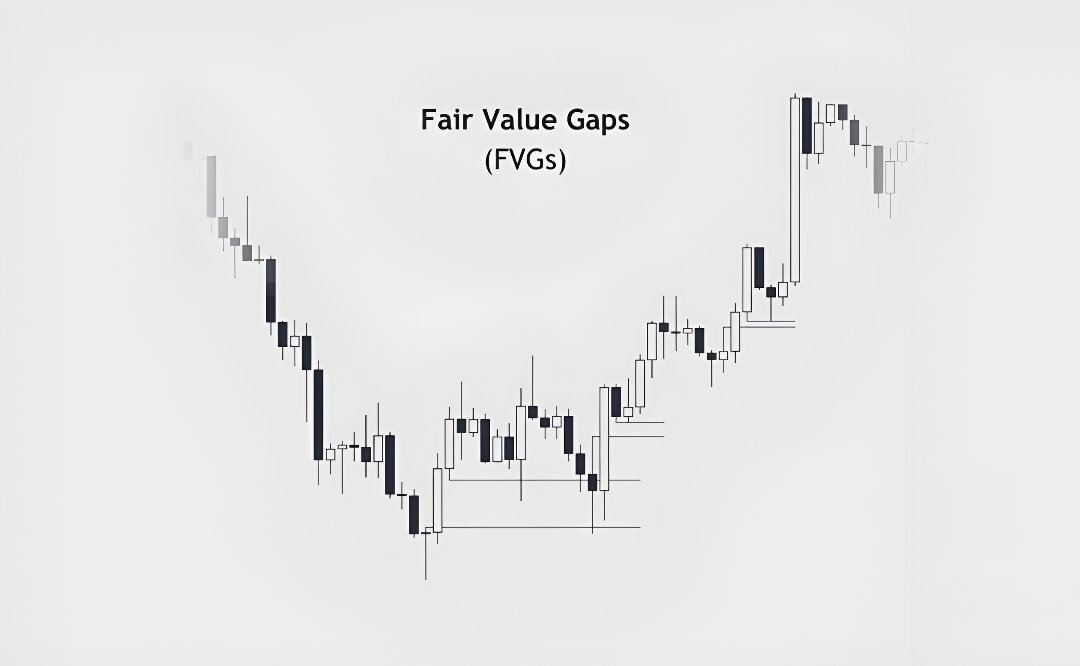 1. What is a “FVG”
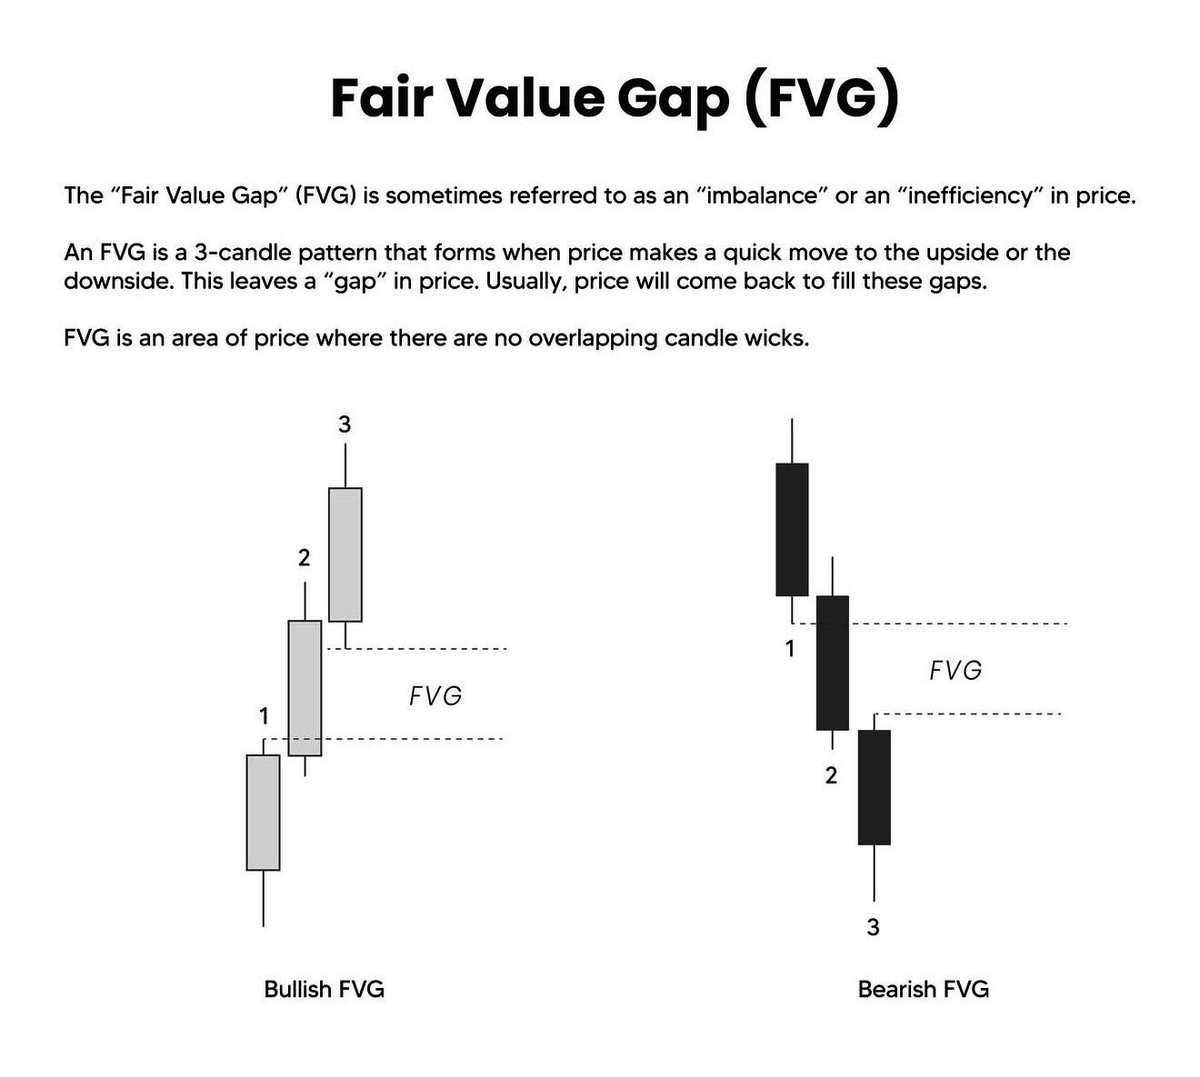
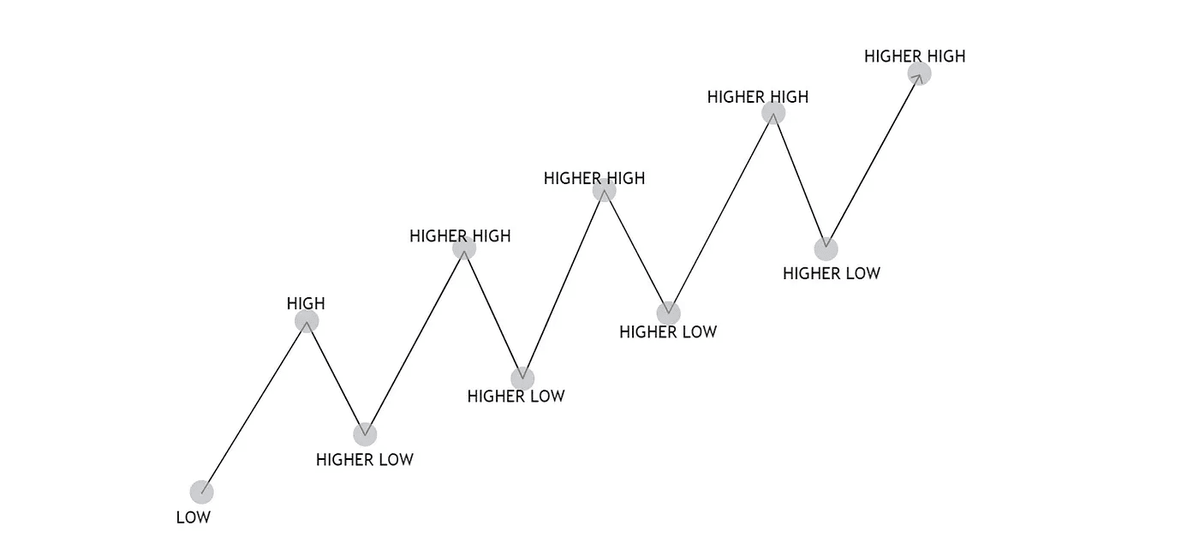
 1. What is Market Structure?
 1. Volume
 1. Order book Heatmap
 1. Footprint Charts
 1. FVG
 1. Fibonacci Retracement
 1. SMC
 1. MACD
 1. What is Market Structure?
 1. Footprint Charts