Think it is progress of sorts when a New York Times feature on "China by the numbers" doesn't mention Chinese holdings of Treasuries but does mention China's belt and road lending ...
China's holdings of US Treasuries did increase sharply from 2002 to 2010, reaching about 10% of US GDP (and far higher share of China's GDP). But they are now only about 5% of US GDP.
(China also holds a lot of Agencies for the record)
2/
As a share of the "available for sale" Treasury market, China's holdings rose to almost 20% of the market, but are now down to just over 5% ...
3/
That's because China's holdings of Treasuries have essentially been flat (slightly declining recently even with the adjustment for Euroclear custodied Treasuries thanks to a shift to Agencies) while the stock of Treasuries increased massively ...
4/
And it is because China made a policy decision back in 2010 that it had plenty of reserves (and plenty of Treasuries) and started to consciously move fx into the hands of the policy banks and investment funds to support what became the Belt and Road.
5/
I tell this story, with plenty of institutional details, in an article that I recently did for the China Project.
The net result: it took 10ys, but China now has more credit exposure to the belt and road than the US Treasury!
Bloomberg has picked up on my China Project story outlining all the pools of foreign assets that China's government holds that aren't counted as formal foreign exchange reserves ...
These aren't necessary hidden sources of liquid foreign currency (not all of China's $3 trillion and change in formal reserves are liquid either, SAFE has a big investment portfolio). But they are funds that China could have held as fx reserves and choose not to.
2/
Some of these pools of FX are well known and not controversial -- the PBOC holds $140b in fx from the banks required reserves for example (other foreign assets) that aren't consolidated into its formal reserves (the orange bars below)
a) China is in fact running massive surpluses: the counterpart trade data suggests a bigger surplus than appears in China's BoP data;
b) rate differentials favor the USD &expectations now favor the USD, so exporters are hoarding fx
The highest frequency data (while incomplete -- the numbers don't capture the net fx position of the policy banks/ other funds that deploy SAFE's fx) suggests China stopped adding to the fx position of the SCBs and the PBOC after April of last year
China so far has -- best I can tell, but do correct me if you see the flow -- only recently tried to slow depreciation, and it has done so via signaling (the fix) rather than a real show of force. PBOC and SCBs haven't dipped into the big stocks of fx from 20 and 21 ...
It didn't take long for Zambia's bonds to be priced for (restructuring) perfection -- or perhaps for a very soft application of the principle of comparability of treatment to official credits.
Zambia's bonds have long traded a bit rich relative to the IMF's debt sustainability analysis -- and at 55-56 cents on the dollar, I think they are trading a bit rich relative to the deal that Zambia struck with China Exim.
2/
A bit of bond math. The $3b in bonds probably have about $600m, maybe a bit more in accrued interest. So if that is honored, and the face of the "claim" is cut in half and the coupon on the official deal is doubled ...
3/
. @KeithBradsher asks an important question in the New York Times -- just how much growth can China get from exports to help wean its economy off investment ...
China been investing close to 45% of its GDP for some time now (ever since the global crisis) and that growth engine is running into limits.
But even 45% of GDP investment never generated a current account deficit ...
2/
More background: China accounts for 30% of global manufacturing output (more than its share of the global economy) and the rest of the world is worried about the vulnerability to economic coercion created by China's manufacturing dominance. 3/
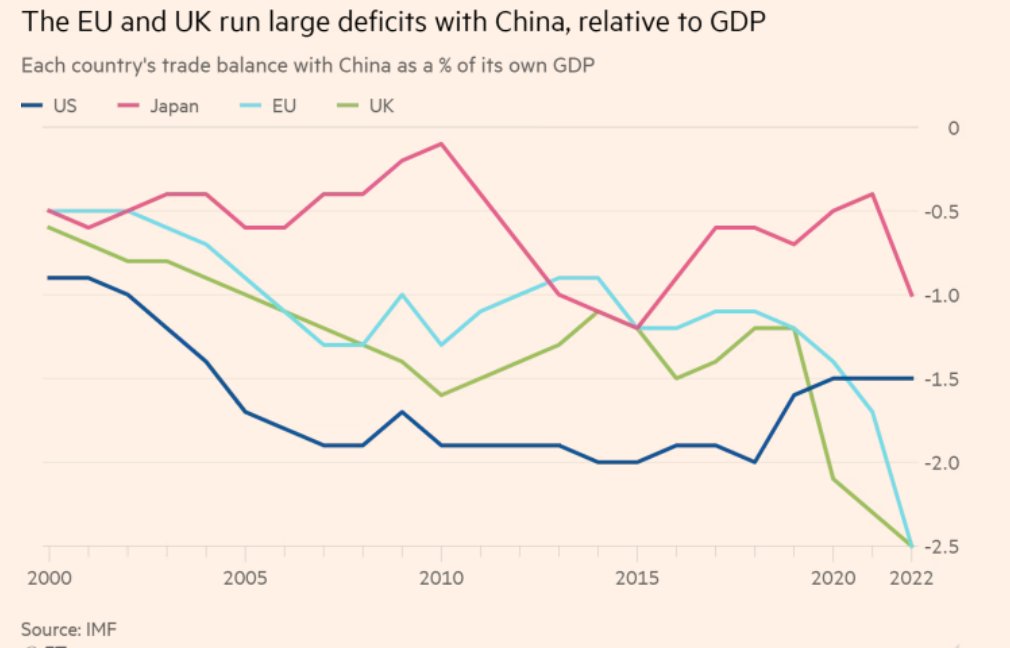
I tip my hat to Martin Wolf's chart game, which remains unsurpassed.
Great, great chart --
Massive swings in China's bilateral balance with the EU, the UK and Japan over the last three years.
Wolf's chart shows the fall in the US bilateral deficit with China -- which no doubt reflects the incentive to minimize bilateral trade created by the Trump tariffs. There though is a lot of embedded Chinese content in US imports from the rest of Asia.
China's rising surpluses with Europe (and the UK) and Japan are consistent with an important but often overlooked global fact -- China's share of the global goods surplus is higher now than in the past ...
But there is also no real doubt that China's EV industry developed in a protected (by tariffs and de facto tho not de jure Chinese content requirements) local market, and there are multiple trade cases against China that the EU could pursue