Nethrapal Profile picture
Jul 9, 2023 6 tweets 4 min read Read on X
Scheduled Castes list is a homogeneous class formed by a set of criteria defined across several census

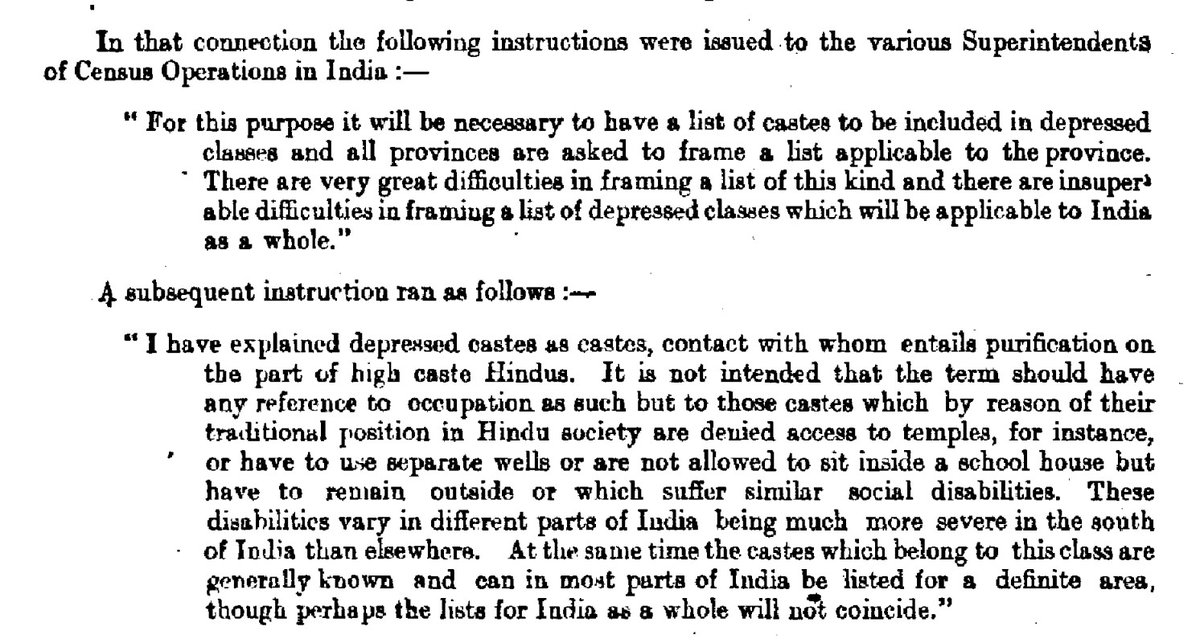
Extracts/Graphics show the extracts from 1931 census where the definition of exterior class that is the current scheduled caste is defined.

It states that depressed castes… https://t.co/5NJKnOiVUhtwitter.com/i/web/status/1…
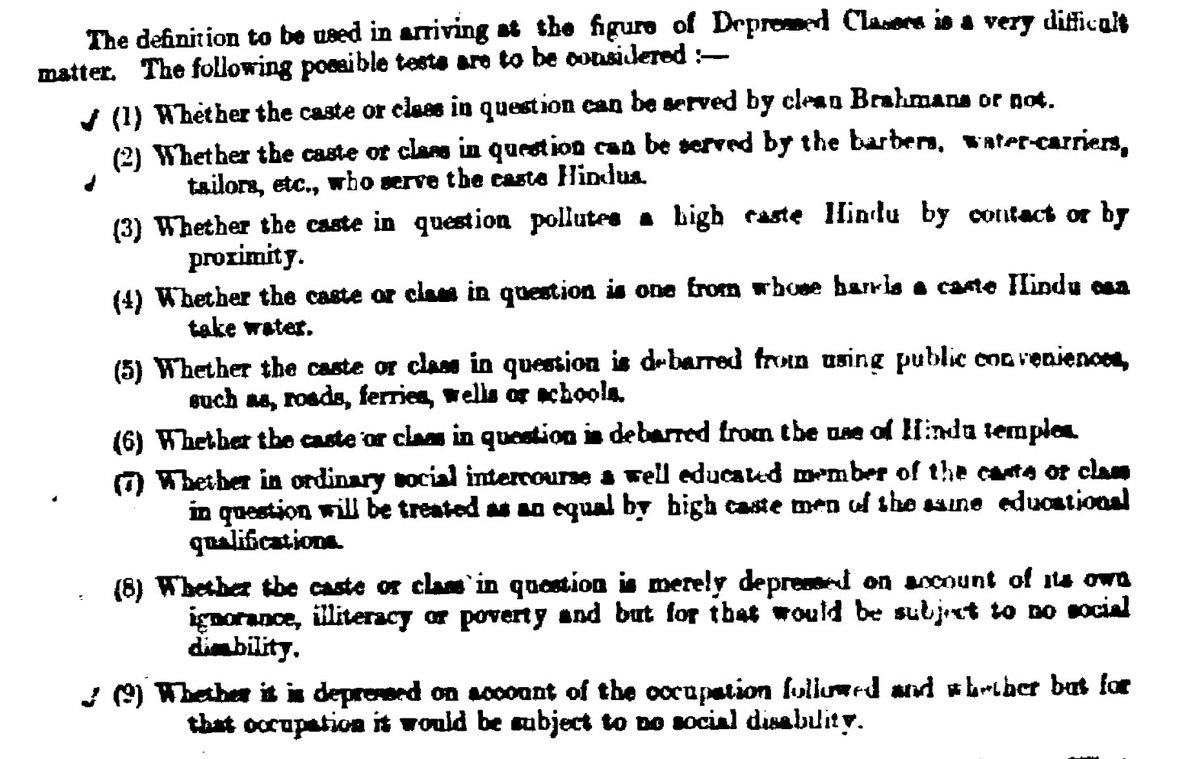
The possible tests for scheduled castes were also defined in 1931 census

Snap shot from 1931 census attached below

The British India new that identifying depressed classes would be extremely difficult. So they came up with the following possible tests which are defined below… https://t.co/SVK6qzYWHhtwitter.com/i/web/status/1…
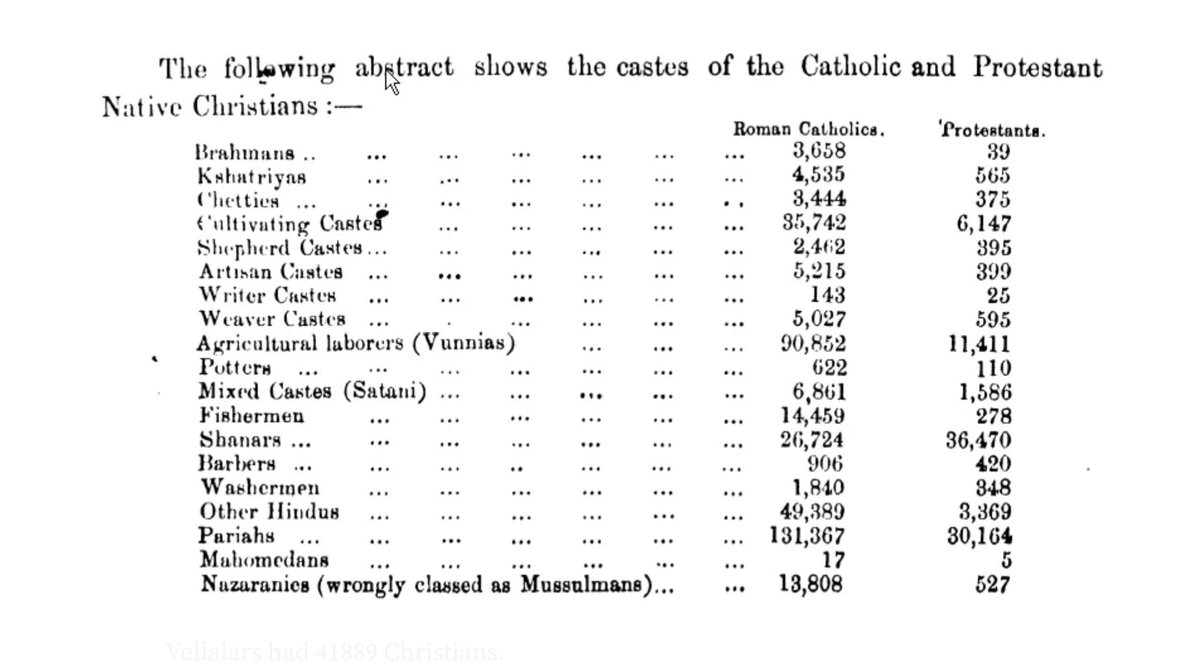
The caste census clearly showed that there were converts to Christianity

The 1871 census document clearly showed that many lower castes converted to Christianity.
Attached Graphic shows that a larger number of lower caste pariahs got converted to Christianity
There is no proof… https://t.co/lanF0Ak3yytwitter.com/i/web/status/1…
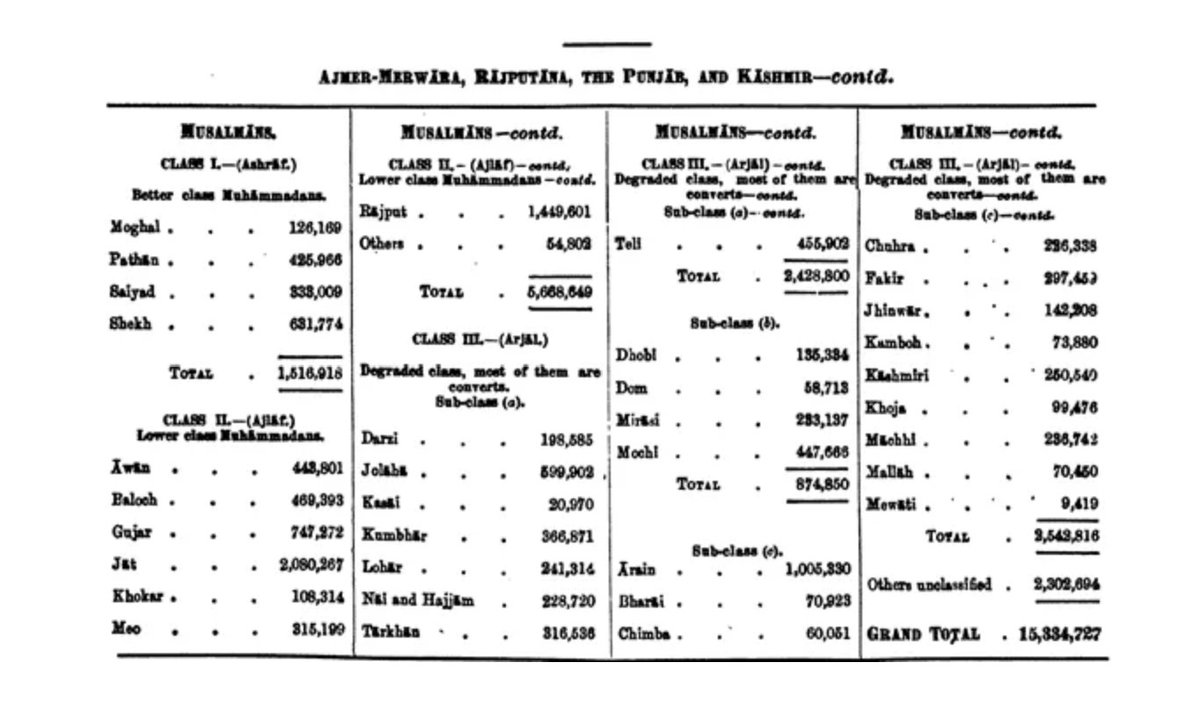
The caste census showed that there was hierarchy in Muslims

The graphics enclosed below show that there was clear evidence for hierarchy in the Muslim community even during the British Caste Census.

There is no dispute about this.

But the question is: why did not the… https://t.co/ANPU3lypQatwitter.com/i/web/status/1…
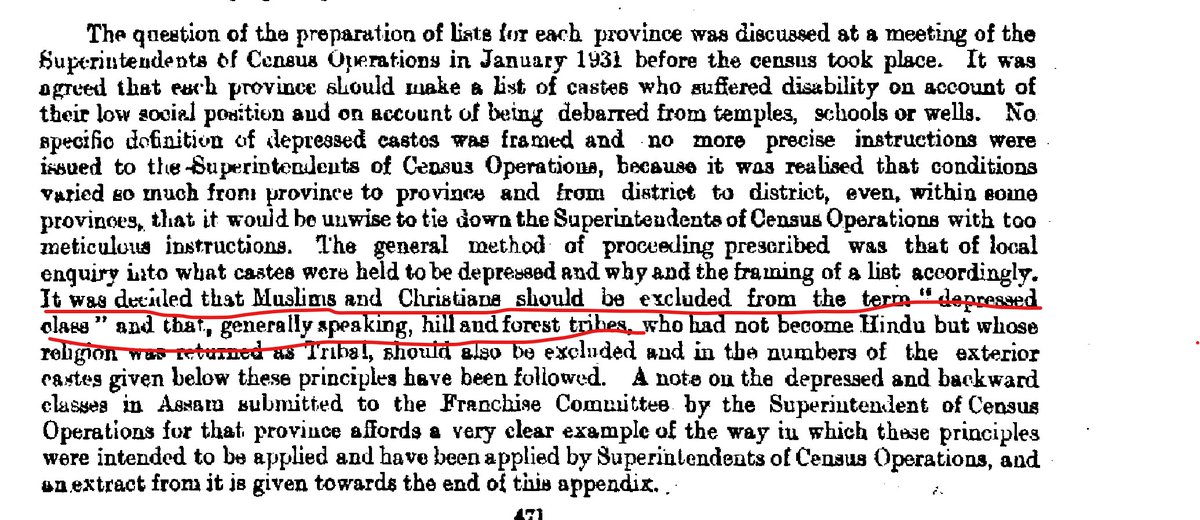
1931 census expressly kept the Muslims and Christians away from the exterior caste list

The attached graphic from page 471 of the 1931 census clearly shows that Muslims and Christians were excluded from the scheduled caste list since they were not subjugated to untouchability… https://t.co/NRcuFprLJitwitter.com/i/web/status/1…
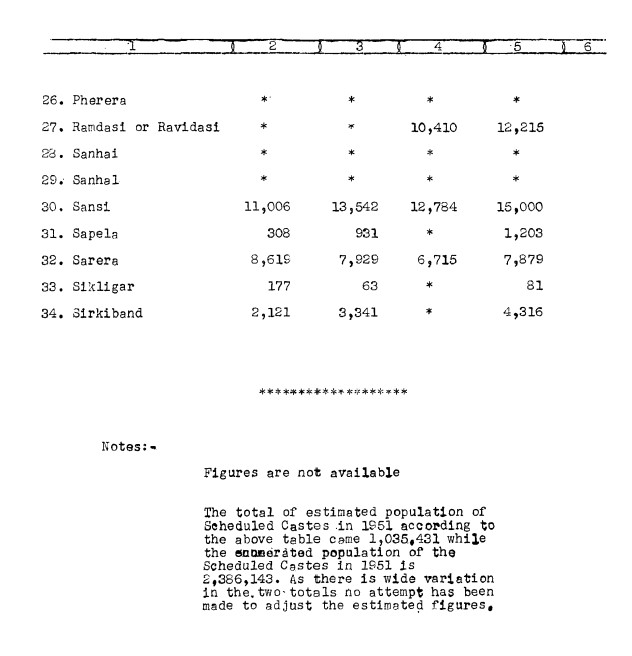
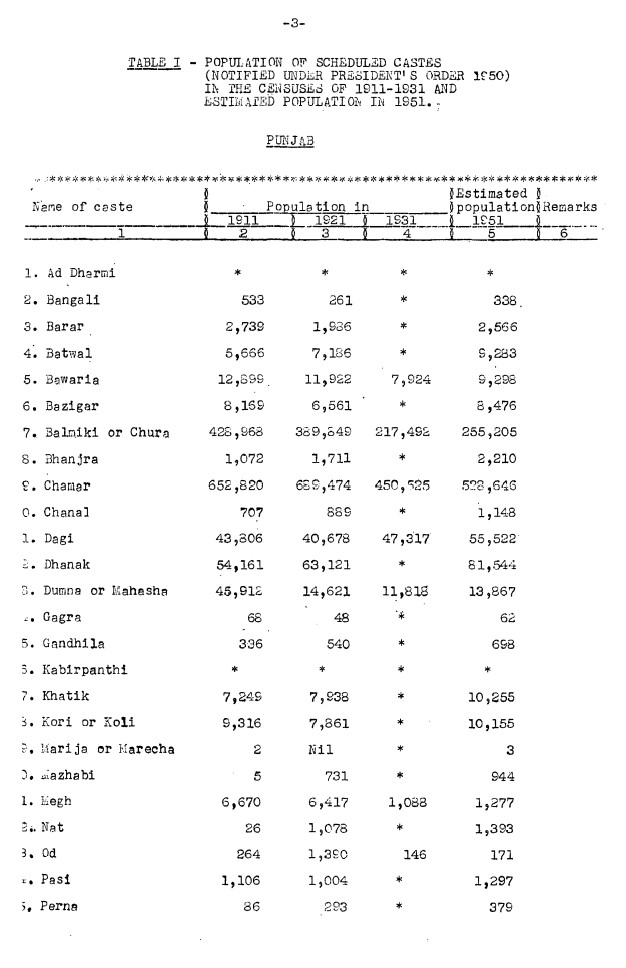
In case of Sikhs, they were included as Scheduled castes right from 1921

They were not included later on. The attached graphic from the 1951 estimate shows who were the scheduled castes, and the earlier census data also clearly proves that they were actually included because of… https://t.co/oN7T8f23TVtwitter.com/i/web/status/1…


• • •

Missing some Tweet in this thread? You can try to force a refresh
 

Keep Current with Nethrapal

Nethrapal Profile picture

Stay in touch and get notified when new unrolls are available from this author!

Read all threads

This Thread may be Removed Anytime!

PDF

Twitter may remove this content at anytime! Save it as PDF for later use!

Try unrolling a thread yourself!

how to unroll video
  1. Follow @ThreadReaderApp to mention us!

  2. From a Twitter thread mention us with a keyword "unroll"
@threadreaderapp unroll

Practice here first or read more on our help page!

More from @nethrapal

May 16, 2025
In UPSC, do SC candidates get lower interview marks if they get higher written marks?

I took the recent marks list of 2025 and did an analysis to check this out.

Scatter plots of Written vs. Interview marks for SC and UR candidates, with trend lines.

The SC plot shows a downward slope (negative correlation): many top written SC performers cluster at lower interview scores.

The UR plot shows a mild upward trend, indicating a positive correlation between written and interview marks in the UR group. This divergence is evident in the exam results.

Such inverse pairing of low written–high interview and high written–low interview is prevalent in the SC data, contributing to the negative correlation. By contrast, in the UR group, strong written performance is often met with decent or even high interview marks (e.g. an UR candidate scoring 825 written was awarded 210 in interview

What conclusions can you draw from this?Image
Despite having comparable outstanding written scores, SC candidates in the top quartile received lower interview scores on average (~164) than their UR counterparts (~177). This ~13-point difference in interview means suggests a disparity. The distribution of interview marks further highlights this:
Box plot of interview scores for the top 25% written scorers in SC vs UR. The median interview score for top SC writers (red line) is visibly lower and the spread extends to lower values compared to UR. High-written SC candidates often received interview marks on the lower end of the range, whereas top-written UR candidates’ interviews are generally higher. Notably, several SC candidates with very high written scores received surprisingly low interviews. For example, one SC candidate with 828 marks in written got only 151 in the interview. In contrast, some UR/general category candidates with slightly lower or similar written scores earned much higher interview marks – e.g. an UR candidate with 785 written scored 193 in the interviewImage
Merit is a myth.
The gap in written marks between OBC and UR is just 1.30% and for SC/ST it is less than 2%.
Even in the total, the gap is very, very low.
The competition is so intense that UPSC invariably gets the best candidates across all categories Image
Read 8 tweets
Dec 24, 2024
In 1956, Savarkar published an article against Ambedkar in his newspaper Kesari. This thread has the entire article. Read on
(1/8) Image
(2/8) Image
(3/8) Image
Read 8 tweets
Jun 17, 2024
Did #reservations cause train accidents?

A detailed thread against a viral image which is being used
(1/n)
🧵 Image
"Best among failed candidates" is from a Mumbai mirror report dated October 7 2017. The report spoke about an internal test conducted to fill the post of assistant commercial managers.
Now 20 employees from Group C category failed the exams. But using the best among failed candidates were called for interviews.
Now those selected under this scheme were are not directly promoted. They are considered for an ad-hoc promotion during a six month trial and then made permanent only if they are found suitable
(2/n)
The scheme will only be applied  “in selections for promotions from Group D to C, within Group C and Group C to B in non-safety categories ( which are said to be non-vital for train operations) only.”
(3/n)Image
Read 10 tweets
Jun 15, 2024
Upper caste own 88.4% of the wealth compared to just 9.0% for OBCs and 2.6% for SCs in 2022.

Please see below 👇👇👇

Pura Kabza…

With no assets, intergenerational wealth, no networks, no connections it is next to impossible for these communities go up the ladder without #reservations.

The saddest part in this is OBC’s wealth share of 17.3% in 2013 has reduced to 9.0% in 2022.

This is big dip showing OBCs who owned traditional small and medium scale businesses are shutting down.

The economic power is getting concentrated in upper castes.

Kabza is only increasing..Image
Most of the enterprises are owned by Upper castes and OBCs. However representation of OBCs is only in enterprise size of 20 employees and less. SC and ST have negligible representation. This is the reason why SC STs should concentrate only on permanent organised salaried jobs in government and private sector. Cutting government jobs have the biggest impact on themImage
If we remove the billionaire list too, SC and ST have the lowest share in wealth. This is complete neglect of SC and ST in Businesses Image
Read 6 tweets
May 29, 2024
A detailed thread on the issue of how SC/ST/OBC reservations were avoided in 10,000 schools using minority status certificates after RTE 2009 Act.

🧵
Read the full thread
(1/n)
Right to Education 2009 act gave all children, in the age of 6 to 14 years, a constitutional right of equal and high quality education. RTE act under section 12 mandated 25% of the seats in private schools to be reserved for children from economically weaker section and disadvantaged group.
(2/n)Image
One controversy has been that 25% of this seats should be for economically weaker sections and not SC/ST. However as per section 2(2)(d) of the RTE act, defines disadvantaged group has belonging to SC,ST,OBC or any other group notified by the government. EWS is also covered now.
(3/n)Image
Read 20 tweets
Jan 23, 2024
Why can not Marathas be given OBC reservations?
A detailed thread
In 1901, Maratha were included in Class II-Kshatriya, and Kunbi's were included in Class III-Vaishyas and were never included in Sudras, the current-day OBCs.
Including Marathas and Kunbis would be reverse discrimination against the existing OBC/EBC population.
1/nImage
Image
Statistcs shows that Maratha community committed 43.52% of the atrocities against SC/ST much more than Brahmins.
(2/n) Image
49 percent of Marathas, 57 percent Patels and 82 percent Jats own or cultivate land which is much lower among other OBCs and SC/STs

(3/n) ceda.ashoka.edu.in/dominant-or-ba…
Image
Read 13 tweets

Did Thread Reader help you today?

Support us! We are indie developers!


This site is made by just two indie developers on a laptop doing marketing, support and development! Read more about the story.

Become a Premium Member ($3/month or $30/year) and get exclusive features!

Become Premium

Don't want to be a Premium member but still want to support us?

Make a small donation by buying us coffee ($5) or help with server cost ($10)

Donate via Paypal

Or Donate anonymously using crypto!

Ethereum

0xfe58350B80634f60Fa6Dc149a72b4DFbc17D341E copy

Bitcoin

3ATGMxNzCUFzxpMCHL5sWSt4DVtS8UqXpi copy

Thank you for your support!

Follow Us!

:(