Part 2 – Religion in America: Evidence from Cellphone Data
Based on the 2.1M cellphones in my main sample that I discussed in “Part 1”, here is the estimated number of worshippers in the US each week from April 2019 to Feb 2020:
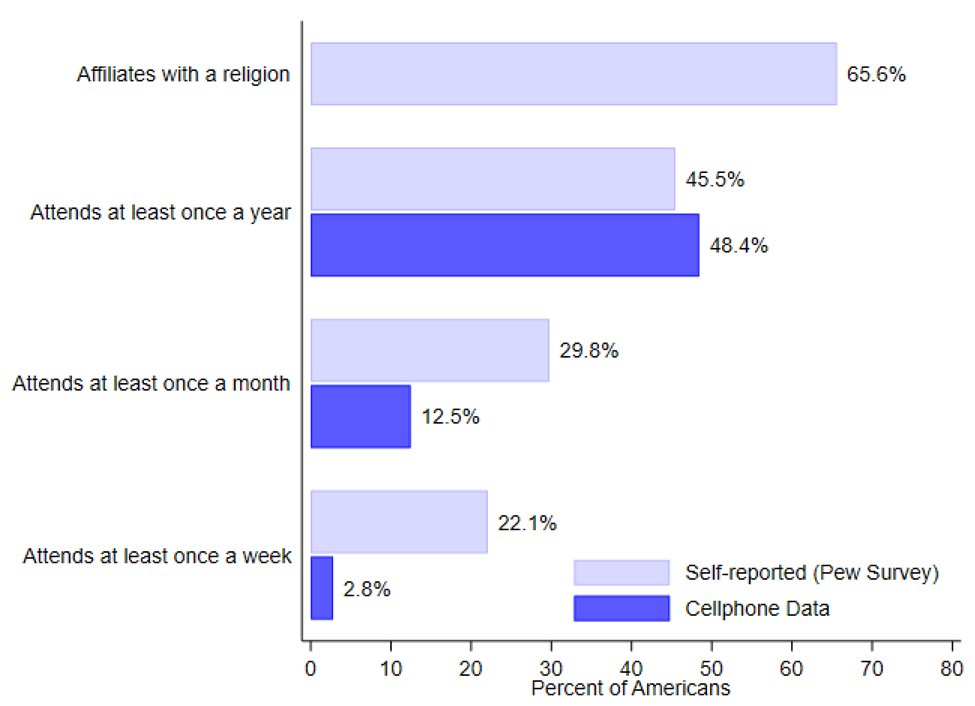
~30 million Americans attend a worship service each week. Attendance increases by ~50% for Easter and Christmas. There are dips in attendance on holiday weekends.
In the next 8 figures, I show attendance separately for the 8 largest religions (using Pew's classification).
Protestants: ~22M in attendance each week. Large Easter and Christmas spikes.
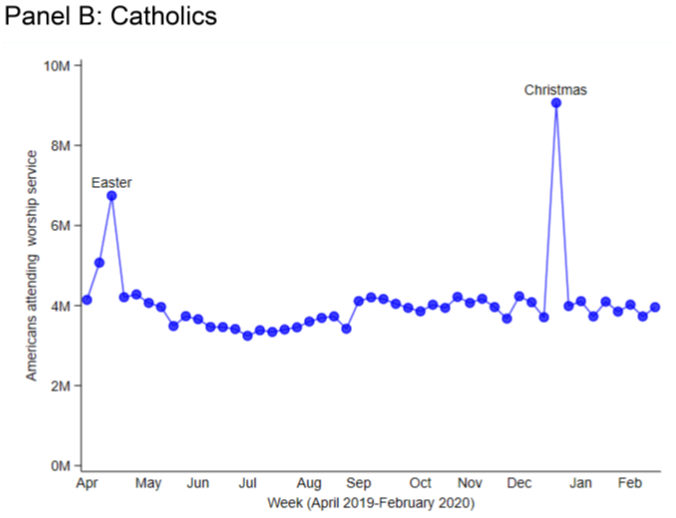
Catholics: ~4M in attendance each week. SUPER large Easter and Christmas spikes.
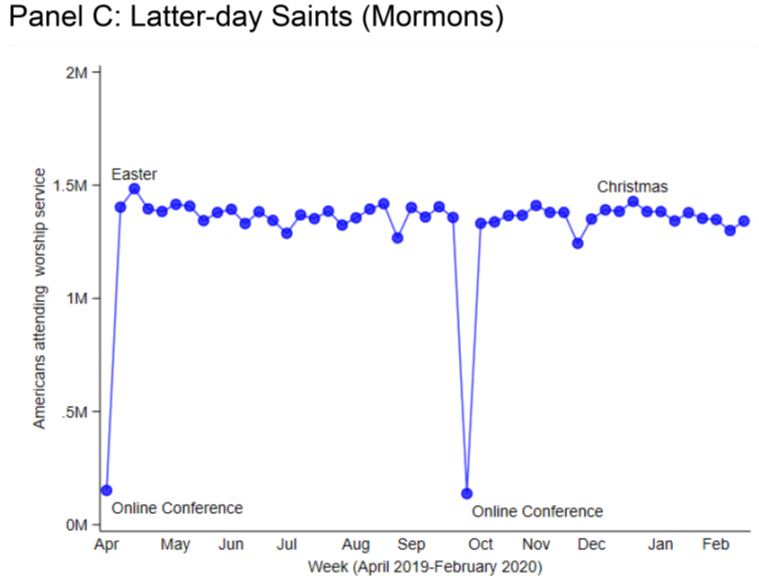
Latter-day Saints (Mormons): ~1.4M in attendance each week. 2 large drops for online conferences. No spikes in attendance for Easter or Christmas.
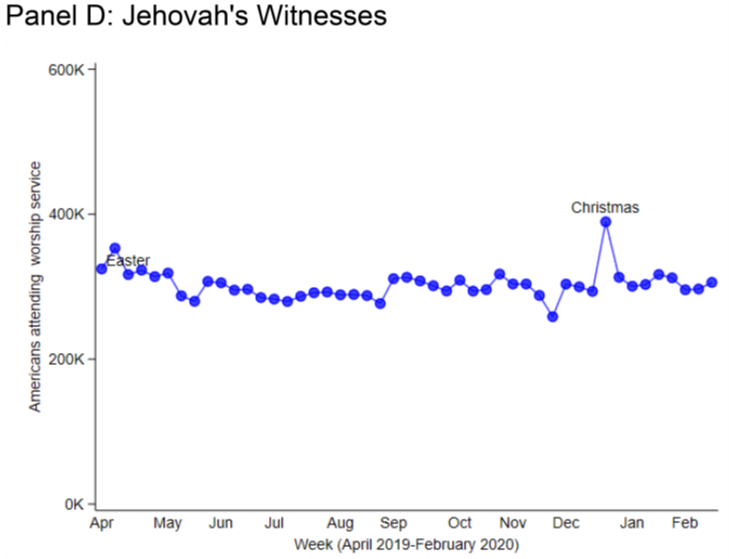
Jehovah’s Witnesses: ~300k in attendance each week. Small Christmas spike.
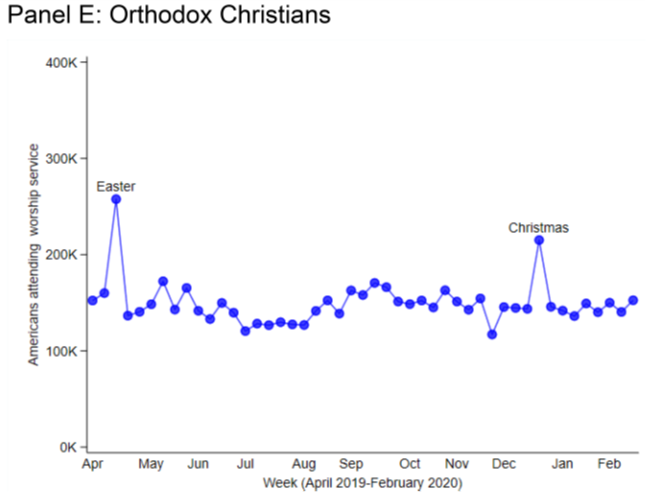
Orthodox Christians: ~160k in attendance each week. Large Easter and Christmas spikes.
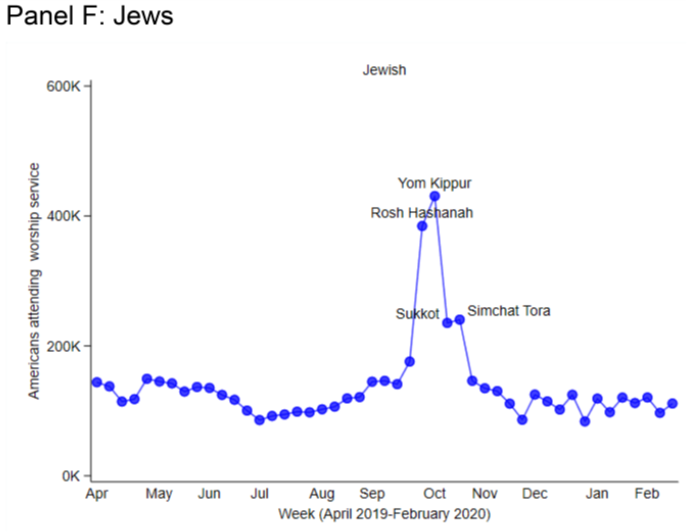
Jews: ~150k in attendance each week. Large spikes for 4 major holidays. Note: these estimates are an undercount to the extent that many Jews (e.g. Orthodox) will not have cellphones on Shabat.
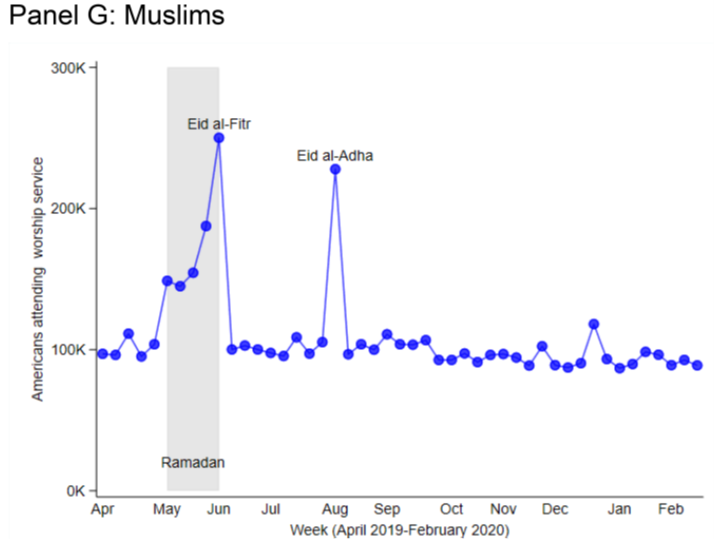
Muslims: ~100k in attendance each week. Large increase in attendance during Ramadan ending with Eid al-Fitr and also a spike for Eid al-Adha.
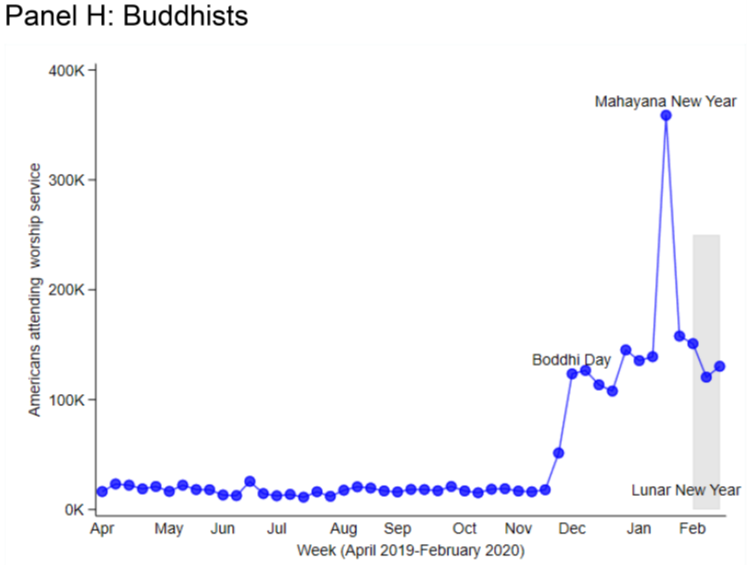
Buddhists: ~20k in attendance each week for most of year. Large increase starting with Bodhi Day and continuing through the Lunar New Year. (My Buddhist network is limited – feedback about whether this seems reasonable from those that know would be helpful!)
These figures show how cellphone data can be used to create estimates for week-to-week attendance in the US as a whole and week-to-week attendance for a particular religion, measures that are *very* hard to find through traditional data sources.
@Michael77285783 It is also possible that many super old people don’t have smartphones. This would be a bit of a bias in the opposite direction. So the kid bias vs the old people bias might cancel out a bit making our estimates about right overall.
• • •
Missing some Tweet in this thread? You can try to
force a refresh
Part 7 - Religion in America: Evidence from Cellphone Data
In this post, I present histograms for the amount of time spent at places of worship on the primary day of worship for each religion.
Part 6 - Religion in America: Evidence from Cellphone Data
In this post, I present histograms by religion for the time of day when people arrive at their place of worship on the primary day of worship.
Part 5 – Religion in America: Evidence from Cellphone Data
In this post, I show the geographic variation in religious attendance based on cellphone data. Here is a state-level graph that shades by fraction of people in each state who attend at least once:
Here is the same graph at the county level:
Getting county-level measures of religious attendance from surveys is *very* hard given sample size issues. Even in my sample of >2M, estimates can become noisy in small counties.
Part 4 – Religion in America: Evidence from Cellphone Data
In this post, I compare the frequency of religious worship attendance using my cellphone data with self-reported attendance separately by religion.
Protestants: Using cellphone data, I classify 35.9% of Americans as Protestants who attend at least once. One out of 15 Protestants attend “weekly” (at least 36 weeks during my 47-week sample).
Catholics: Using cellphone data, I classify 8.7% of Americans as Catholics who attend at least once. One out of 51 Catholics attend “weekly” (at least 36 weeks during my 47-week sample).
Part 3 – Religion in America: Evidence from Cellphone Data
I compare frequency of religious worship attendance using my cellphone data with self-reported attendance data. Here are the main results:
According to self-reported data, 66% of Americans affiliate with a religion and 46% claim to attend worship services at least once a year. This matches up nicely with my cellphone data that finds that 48% of people attend at least one service each year.
30% claim to go at least once a month, but I find that only 13% attend at least 11 weeks during the 47 weeks of my data sample.
Part 1 – Religion in America: Evidence from Cellphone Data
Sorry, but this first post has to be boring. I need to tell you about the 2.1M cellphones that make up my main sample.
The cellphone data were purchased from a company called @veraset that aggregates de-identified, geospatial data points for US smartphones. It’s a bit of a blackbox, but if you allow apps like the weather app to track your location, you could be in their dataset.
The most detailed data contain “pings” (lat-longs) for the location of each phone. A regularly pinging phone will produce a ping every 5 minutes or more frequently. Using polygon shape files (geofences) of buildings, you can tell when a phone enters a Walmart, Subway, or church.