Professor of behavioral science and economics at the University of Chicago's Booth School of Business
Jul 20, 2023 • 9 tweets • 2 min read
Part 7 - Religion in America: Evidence from Cellphone Data
In this post, I present histograms for the amount of time spent at places of worship on the primary day of worship for each religion.
Protestants: Median worship time: 89 min.
Jul 18, 2023 • 9 tweets • 2 min read
Part 6 - Religion in America: Evidence from Cellphone Data
In this post, I present histograms by religion for the time of day when people arrive at their place of worship on the primary day of worship.
Protestants (primary day of worship Sunday):
Jul 17, 2023 • 4 tweets • 2 min read
Part 5 – Religion in America: Evidence from Cellphone Data
In this post, I show the geographic variation in religious attendance based on cellphone data. Here is a state-level graph that shades by fraction of people in each state who attend at least once:
Here is the same graph at the county level:
Jul 15, 2023 • 13 tweets • 4 min read
Part 4 – Religion in America: Evidence from Cellphone Data
In this post, I compare the frequency of religious worship attendance using my cellphone data with self-reported attendance separately by religion.
Protestants: Using cellphone data, I classify 35.9% of Americans as Protestants who attend at least once. One out of 15 Protestants attend “weekly” (at least 36 weeks during my 47-week sample).
Jul 14, 2023 • 5 tweets • 1 min read
Part 3 – Religion in America: Evidence from Cellphone Data
I compare frequency of religious worship attendance using my cellphone data with self-reported attendance data. Here are the main results:
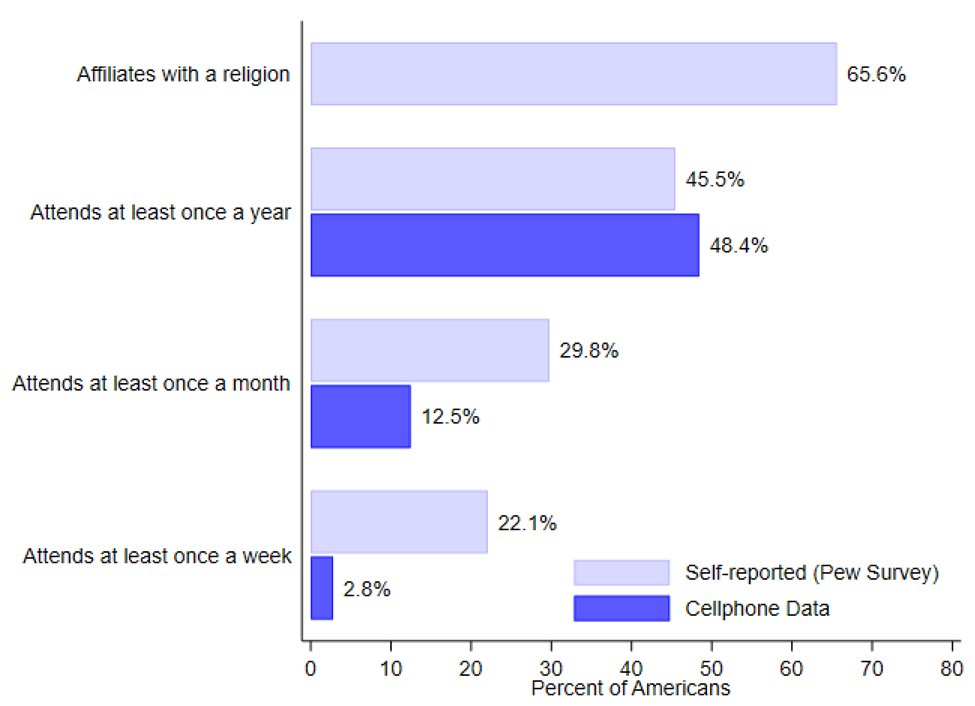
According to self-reported data, 66% of Americans affiliate with a religion and 46% claim to attend worship services at least once a year. This matches up nicely with my cellphone data that finds that 48% of people attend at least one service each year.
Jul 13, 2023 • 12 tweets • 4 min read
Part 2 – Religion in America: Evidence from Cellphone Data
Based on the 2.1M cellphones in my main sample that I discussed in “Part 1”, here is the estimated number of worshippers in the US each week from April 2019 to Feb 2020:
~30 million Americans attend a worship service each week. Attendance increases by ~50% for Easter and Christmas. There are dips in attendance on holiday weekends.
In the next 8 figures, I show attendance separately for the 8 largest religions (using Pew's classification).
Jul 12, 2023 • 17 tweets • 4 min read
Part 1 – Religion in America: Evidence from Cellphone Data
Sorry, but this first post has to be boring. I need to tell you about the 2.1M cellphones that make up my main sample.
The cellphone data were purchased from a company called @veraset that aggregates de-identified, geospatial data points for US smartphones. It’s a bit of a blackbox, but if you allow apps like the weather app to track your location, you could be in their dataset.
Dec 16, 2022 • 8 tweets • 2 min read
I just did a deep dive into the literature on the impact of having kids on the happiness/satisfaction of parents. For many reasons, this is a hard question to answer and there are a lot of really bad papers out there. In the end, here is my takeaway from this literature:
There are 2 primary methods to study this question. Method #1 involves comparing happiness levels of people with kids at home to similarly-aged people wtihout kids at home. I think the best paper using this method is Deaton & Stone 2014 in PNAS: pnas.org/doi/epdf/10.10…
May 7, 2020 • 4 tweets • 1 min read
I just learned something kind of cool about the NY Times. For many of their articles, they produce multiple headlines. They A/B test the headlines in the morning and then run with the winner for the rest of the day.
For our oped yesterday, headlines included: 1. Which businesses should reopen first? 2. Your favorite restaurant might be a super spreader 3. Is it safer to visit a coffee shop or the gym?