
#Darvas Box is used by 99.99% of stock traders in the world.
It is the simplest strategy of buy and hold.
But most people still don't know how to use it.
Here are 10 basics everyone should know:
It is the simplest strategy of buy and hold.
But most people still don't know how to use it.
Here are 10 basics everyone should know:
Darvas Box is named after Nicolas Darvas, a dancer, and self-taught investor.
He discovered "Box Theory" after gaining experience from the market and he believed that the shares which move up and down the chart move in a specific box pattern.
He discovered "Box Theory" after gaining experience from the market and he believed that the shares which move up and down the chart move in a specific box pattern.
There are some conditions of using Darvas Box and we will discuss only the buy strategy:
⚡️ Stock should be trading near all-time high levels
⚡️ Fundamentals of the company should be good
⚡️ Volumes play a crucial role
Prefer to use it daily time frame and above.
⚡️ Stock should be trading near all-time high levels
⚡️ Fundamentals of the company should be good
⚡️ Volumes play a crucial role
Prefer to use it daily time frame and above.
When the price is near all time high levels, if the price consolidates then there is a range or box formed having an upside ceiling and downside floor. Price consolidates in this range before the breakout. 
Let's see some examples now.
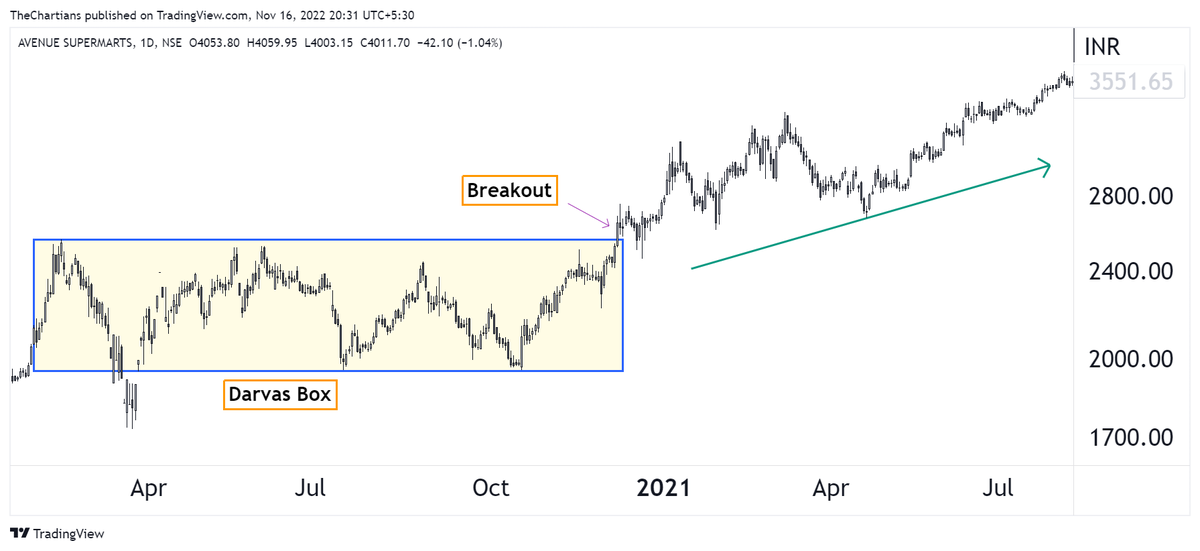
Dmart was trading in a range of 1955-2438 for six months.
After breaking this range upside, DMart price rallied from 2500 to 3200+ (Rally of 28% in 3 months).
Dmart was trading in a range of 1955-2438 for six months.
After breaking this range upside, DMart price rallied from 2500 to 3200+ (Rally of 28% in 3 months).
Another example:
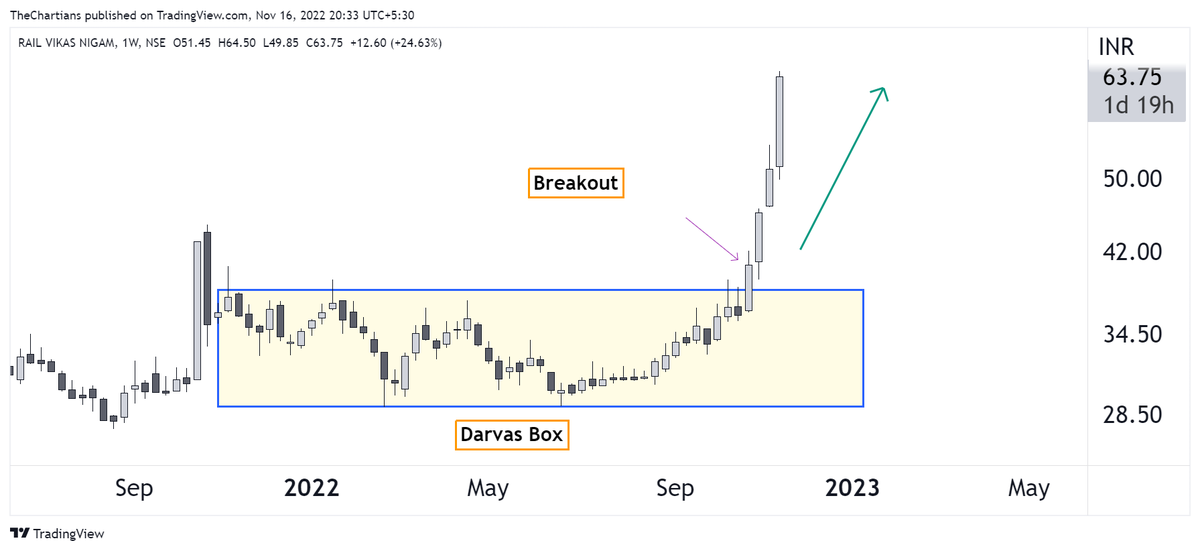
RVNL [Weekly Chart]
Price was trading in a box (range 29-39) for one year. After the breakout, RVNL rallied from 39 to 64 in one month. Returns of 64%.
Darvas Box can be used for investment and the time frame should be weekly/monthly.
RVNL [Weekly Chart]
Price was trading in a box (range 29-39) for one year. After the breakout, RVNL rallied from 39 to 64 in one month. Returns of 64%.
Darvas Box can be used for investment and the time frame should be weekly/monthly.
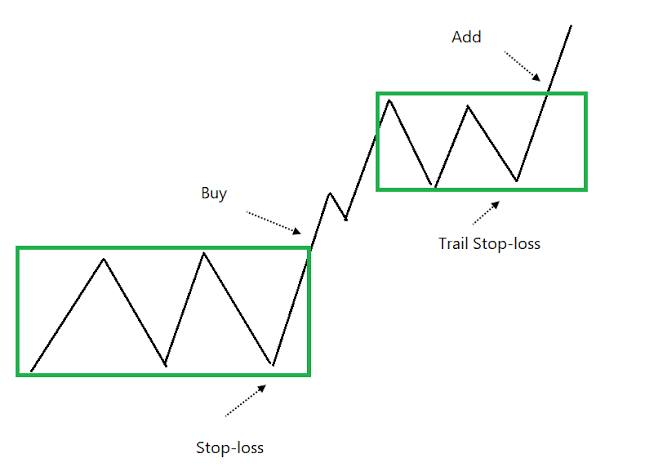
What would be the exit strategy?
Once the stock breaks the resistance or ceiling of the box then keep stoploss at the floor of the box and once the price moves up then it will form higher lows. So trail your stoploss to precedent higher lows or else one can use the ATR method.
Once the stock breaks the resistance or ceiling of the box then keep stoploss at the floor of the box and once the price moves up then it will form higher lows. So trail your stoploss to precedent higher lows or else one can use the ATR method.
Why are we focusing on buying side?
When the price breaks the ceiling of the box then there upside is unlimited and one should trail the stop losses if one wants to ride a big trend in a stock.
Second reason is buying doesn't require margin or leverage.
When the price breaks the ceiling of the box then there upside is unlimited and one should trail the stop losses if one wants to ride a big trend in a stock.
Second reason is buying doesn't require margin or leverage.
One can use closing basis entry and exit criteria to avoid noise in the candle.
This is not a holy grail strategy and even stoploss would get hit.
Important point is to exit in the wrong trade and ride the winners by trailing stoploss to get good returns.
This is not a holy grail strategy and even stoploss would get hit.
Important point is to exit in the wrong trade and ride the winners by trailing stoploss to get good returns.
These are not universal rules one must follow. One can create their rule or follow someone else rules.
One can use indicators or can keep it simple by trading based on lines.
Only important thing is one must follow a fixed rule instead of tweaking the setup frequently.
One can use indicators or can keep it simple by trading based on lines.
Only important thing is one must follow a fixed rule instead of tweaking the setup frequently.
That's all about simple Darvas Box chart patterns.
If you found this useful, please RT the first tweet.
For live stocks and options trade updates, you can join our Telegram Channel ⤵️
telegram.me/chartians
If you found this useful, please RT the first tweet.
For live stocks and options trade updates, you can join our Telegram Channel ⤵️
telegram.me/chartians
• • •
Missing some Tweet in this thread? You can try to
force a refresh


