SPSS is one of the best tool out there when it comes to STATISTICAL ANALYSIS for research and project.

It can also be used for DATA ANALYSIS too
So I’m putting up these thread of steps on how to download for free and install it😊

Retweet cos, it’s a THREAD 🧵 Image
First I need y’all to know that I can perform statistical and data analysis for your projects, research and academics with SPSS, mini tab, stata and excel.
My dm is opened for business 😊
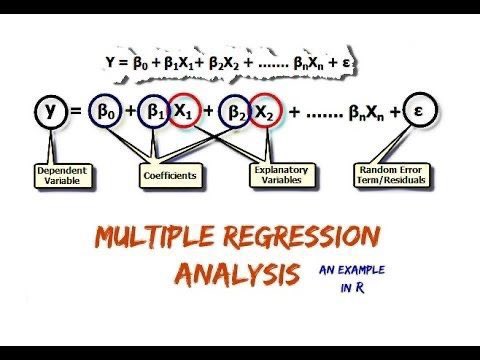
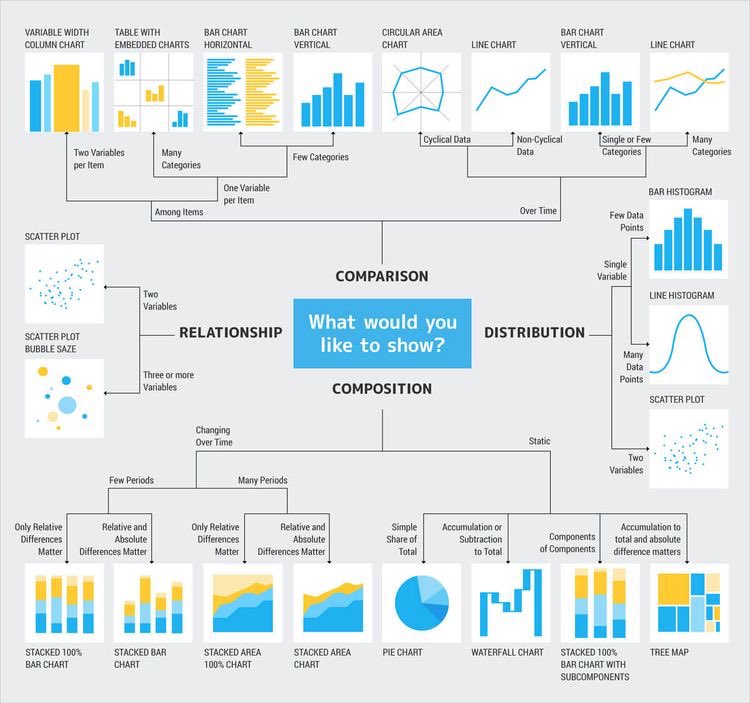
And if you are willing to start DATA ANALYSIS or DATA SCIENCE… I have a YouTube channel where I teach the needed statistics from the basics.
Check my pinned tweet for the syllabus and link below to my statistics playlist ⬇️

youtube.com/playlist?list=…
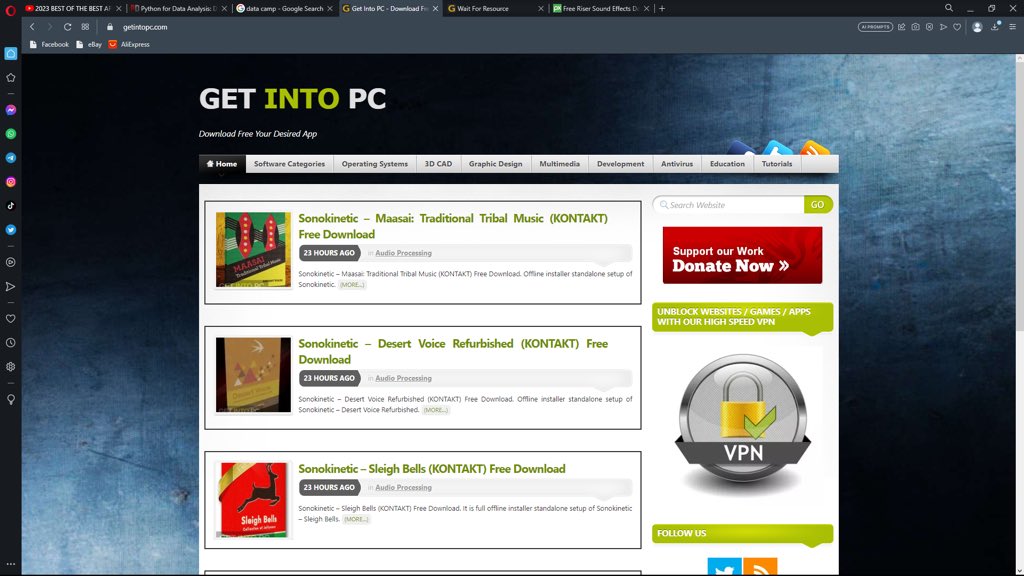
Step 1 : google search “get into pc” and click on their link (I could not post the link here)

You will be approached by interface…. For a weird reason I could not download with chrome… so I advice you use opera or any other browser
Image
Image
Step 2: click on the “search” button and search for “IBM SPSS” Image
Step 3: you would be faced with couple of choices, but I chose the latest upload- the first one “IBM SPSS 2022” Image
Step 4: you will be met with this page then click on “download full setup”
Image
Image
Step 5: your download is gonna be a zip file.
Which you will be using preferably “Winrar” to extract Image
Step 6: this is the downloaded zip file in it directory(downloads in this case) and when you click on it, it will ask for a password which is “123”
Image
Image
Step 6: after putting in the password, you will be met with this screen ⬇️.
Click on “extract to” Image
Step 7: extract the file to where ever you want to.
I chose “download” you can choose anywhere you want. Image
Step 8: after extracting, it would create a folder for you.
Click on that folder created until you will see the application itself, “crack” and “if206”.
PS : don’t install the app yet
Image
Image
Step 9: click on the “crack” and copy the “iservrc” file. Image
Step 10: after copying the “iservrc”, you will now go and paste it to the folder created for SPSS in the program files.

Go to your file manager, locate “program files”, locate “IBM”, locate “spss”, locate “statistics” and locate “27” then paste the “isercvc” there.


Image
Image
Image
Image
Step 11: you will go back to the file that was created by the zip file and copy “JRE” - this time you would be clicking on “IF026 update” and copy “JRE” then copy this also into the SPSS in program files just like you did for the “iservc”

Image
Image
Image
Step 12: now you can now install the app by clicking on “spss_statistics_client_27.0”

Follow the instructions to install and viola…. You now have SPSS 27 😊 Image
I hope I have been able to help you get SPSS 27.
Please don’t forget to retweet, like and also follow me for more.
I drop useful threads about and relevant resources😁.

Thanks for making to the end and we see in the next one… bye 🙏🏻

• • •

Missing some Tweet in this thread? You can try to force a refresh
 

Keep Current with Abefe - the statistics guy✍️📚😎🇳🇬

Abefe - the statistics guy✍️📚😎🇳🇬 Profile picture

Stay in touch and get notified when new unrolls are available from this author!

Read all threads

This Thread may be Removed Anytime!

PDF

Twitter may remove this content at anytime! Save it as PDF for later use!

Try unrolling a thread yourself!

how to unroll video
  1. Follow @ThreadReaderApp to mention us!

  2. From a Twitter thread mention us with a keyword "unroll"
@threadreaderapp unroll

Practice here first or read more on our help page!

More from @starboy_abefe

Oct 5, 2023
During the analysis of the SUPERSTORE DATASET, I realized that the profit from CALIFORNIA is slightly greater than that of NEW YORK.

From the surface… I should conclude California is a better state than New York…. But I did not 😏

Why 🧐…. STATISTICAL SIGNIFICANCE

Let me explain STATISTICAL SIGNIFICANCE to you like a 5 year old.

Retweet because….. IT’S A THREAD 🧵
Image
You see, the whole of INFERENTIAL STATISTICS is all about decision making.
You extract a sample or couple samples from a population or populations and you compare and contrast to see if there is a difference or relationship between them and make a final conclusion in the long run.
The conclusion you will be making will be referenced to two sentences - NULL and ALTERNATIVE HYPOTHESIS.

Let me start with 2 samples and in this case I will be using the profit from the state of California and New York regarding the superstore dataset.

Link to analysis of dataset below ⬇️
Read 16 tweets
Sep 26, 2023
This is my PHASE 2 of the superstore dataset analysis.

In this thread, I will be talking about the categories and sub categories of goods and how they relate with PROFIT, SALES, and DISCOUNT all based on REGION 🗺️

Kindly retweet like and follow for more.
It’s a THREAD 🧵 Image
In the PHASE 1 of the analysis of the superstore dataset, I talked about profit, discount and sales regarding the states.

The conclusion was that NEW YORK is the most profitable state to pay attention to 🤗

Below is the link to that thread… you might want to read that before getting to this ⬇️
I will also be linking the dataset right here…. This way anyone can use their approach to draw insights from this dataset.
Please do tag me when you make a thread 🙏🏻


So let’s begin analysis 🧐drive.google.com/file/d/1-6vFsv…
Read 19 tweets
Sep 6, 2023
STATISTICAL ANALYSIS is the usage of statistical concepts and techniques to summarize and draw out conclusions from data set.

STATISTICAL ANALYSIS can be used by DATA ANALYST for exploring and uncovering patterns while DATA SCIENTIST use it to build models

We have 7 types of STATISTICAL ANALYSIS… this is a THREAD about them.

Kindly retweet, like and follow for more 🙏🏻
Image
DESCRIPTIVE ANALYSIS
This is the combination of GRAPHS and NUMBERS to summarize the data…… emphasis on the word “summarize”.

The usage of GRAPHS is known as “DATA VISUALIZATION” and the usage of numbers can either be the measure of tendency which consist of mean, median and mode, or the measure of dispersion which consist of mean absolute deviation (MAD), variance, range etc

Image
Image
INFERENTIAL ANALYSIS
If descriptive analysis helps us to summarize the data set, inferential analysis helps us to make conclusion from the data as a whole using these summaries 💯

This type of analysis make conclusion on a POPULATION by making inference on the SAMPLE

Inferential statistics includes the likes of
-Hypothesis test (Z test, T test, ANOVA, etc)
-Confidence interval
-Sampling and sampling distributions
Image
Read 10 tweets
Aug 18, 2023
MULTIPLE LINEAR REGRESSION is one powerful concept in statistics.

It is the basis of SUPERVISED LEARNING.
But some conditions must be satisfied before we can use this technique

This is a thread of the assumptions for MULTIPLE LINEAR REGRESSION

Retweet cos…. It’s a THREAD 🧵 Image
Before we start, just want to let you know that I have a YOUTUBE CHANNEL where I teach the needed statistics for DATA ANALYSIS AND DATA SCIENCE… you can check it out below ⬇️

youtube.com/playlist?list=…
1) LINEARITY
The dependent variable (y) must have a linear relationship with each the independent variables (x1, x2, x3….. xn).
The linear relationship can either be positive (both changing in the same direction) or negative (both changing in opposite direction) Image
Read 11 tweets
Aug 16, 2023
CORRELATION
COVARIANCE
REGRESSION.

What are they??
And is their any form of relationship between these 3?

Well let’s find out in 3 minutes ☺️
Retweet …… cos it’s a THREAD 🧵

Image
Image
Image
CORRELATION
Correlation is used to test for the strength and direction of association between 2 variables
If the association causes the variables to change in the SAME direction, we have a POSITIVE CORRELATION.

If the change is in OPPOSITE direction, we have NEGATIVE correlation
If we can’t see any form of change between the two variables… then we have a ZERO or NO CORRELATION.

A scatter plot is a graph that we can use to visualize correlation.

A correlation coefficient is a number (between -1 and +1) to quantify correlation Image
Read 10 tweets
Jul 30, 2023
Do you want to describe a single variable ?- use a BAR CHART

Do you want to visualize the distribution of a variable? - use a HISTOGRAM

Do you want to compare the strength of association between 2 variables ? - use SCATTER PLOT

Thread of data visualization.. RETWEET 🙏🏻 Image
I have a YouTube playlist where I talked about some very popular data visualization tools we see everyday.
You can check it out below ⬇️


Let’s go 😎youtube.com/playlist?list=…
SINGLE BAR CHART
This is basically used to visualize a single categorical variable (univariate analysis)
On the horizontal axis, we have the variable… on the vertical axis, we have the frequency. Image
Read 17 tweets

Did Thread Reader help you today?

Support us! We are indie developers!


This site is made by just two indie developers on a laptop doing marketing, support and development! Read more about the story.

Become a Premium Member ($3/month or $30/year) and get exclusive features!

Become Premium

Don't want to be a Premium member but still want to support us?

Make a small donation by buying us coffee ($5) or help with server cost ($10)

Donate via Paypal

Or Donate anonymously using crypto!

Ethereum

0xfe58350B80634f60Fa6Dc149a72b4DFbc17D341E copy

Bitcoin

3ATGMxNzCUFzxpMCHL5sWSt4DVtS8UqXpi copy

Thank you for your support!

Follow Us!

:(