Bsc in Applied physics📚| content creator 🎥 |Tutor |Alumnus UNILAG🎓|| Chelsea💙|Muslim 🕌|omo kwara |SPSS |excel| statistical analyst |R|📊| DM me for biz
Oct 5, 2023 • 16 tweets • 5 min read
During the analysis of the SUPERSTORE DATASET, I realized that the profit from CALIFORNIA is slightly greater than that of NEW YORK.
From the surface… I should conclude California is a better state than New York…. But I did not 😏
Why 🧐…. STATISTICAL SIGNIFICANCE
Let me explain STATISTICAL SIGNIFICANCE to you like a 5 year old.
Retweet because….. IT’S A THREAD 🧵
You see, the whole of INFERENTIAL STATISTICS is all about decision making.
You extract a sample or couple samples from a population or populations and you compare and contrast to see if there is a difference or relationship between them and make a final conclusion in the long run.
Sep 26, 2023 • 19 tweets • 9 min read
This is my PHASE 2 of the superstore dataset analysis.
In this thread, I will be talking about the categories and sub categories of goods and how they relate with PROFIT, SALES, and DISCOUNT all based on REGION 🗺️
Kindly retweet like and follow for more.
It’s a THREAD 🧵
In the PHASE 1 of the analysis of the superstore dataset, I talked about profit, discount and sales regarding the states.
The conclusion was that NEW YORK is the most profitable state to pay attention to 🤗
Below is the link to that thread… you might want to read that before getting to this ⬇️
STATISTICAL ANALYSIS is the usage of statistical concepts and techniques to summarize and draw out conclusions from data set.
STATISTICAL ANALYSIS can be used by DATA ANALYST for exploring and uncovering patterns while DATA SCIENTIST use it to build models
We have 7 types of STATISTICAL ANALYSIS… this is a THREAD about them.
Kindly retweet, like and follow for more 🙏🏻
DESCRIPTIVE ANALYSIS
This is the combination of GRAPHS and NUMBERS to summarize the data…… emphasis on the word “summarize”.
The usage of GRAPHS is known as “DATA VISUALIZATION” and the usage of numbers can either be the measure of tendency which consist of mean, median and mode, or the measure of dispersion which consist of mean absolute deviation (MAD), variance, range etc
Aug 18, 2023 • 11 tweets • 4 min read
MULTIPLE LINEAR REGRESSION is one powerful concept in statistics.
It is the basis of SUPERVISED LEARNING.
But some conditions must be satisfied before we can use this technique
This is a thread of the assumptions for MULTIPLE LINEAR REGRESSION
Retweet cos…. It’s a THREAD 🧵
Before we start, just want to let you know that I have a YOUTUBE CHANNEL where I teach the needed statistics for DATA ANALYSIS AND DATA SCIENCE… you can check it out below ⬇️
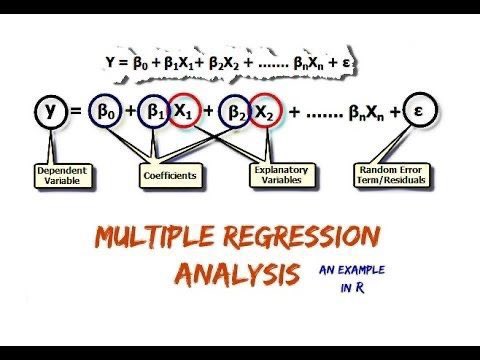
What are they??
And is their any form of relationship between these 3?
Well let’s find out in 3 minutes ☺️
Retweet …… cos it’s a THREAD 🧵
CORRELATION
Correlation is used to test for the strength and direction of association between 2 variables
If the association causes the variables to change in the SAME direction, we have a POSITIVE CORRELATION.
If the change is in OPPOSITE direction, we have NEGATIVE correlation
Jul 30, 2023 • 17 tweets • 5 min read
Do you want to describe a single variable ?- use a BAR CHART
Do you want to visualize the distribution of a variable? - use a HISTOGRAM
Do you want to compare the strength of association between 2 variables ? - use SCATTER PLOT
Thread of data visualization.. RETWEET 🙏🏻
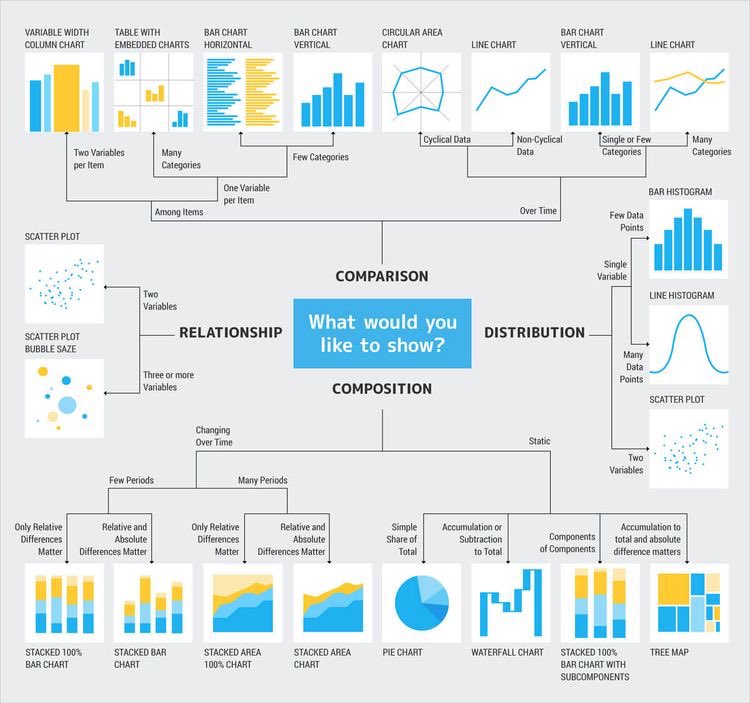
I have a YouTube playlist where I talked about some very popular data visualization tools we see everyday.
You can check it out below ⬇️
SPSS is one of the best tool out there when it comes to STATISTICAL ANALYSIS for research and project.
It can also be used for DATA ANALYSIS too
So I’m putting up these thread of steps on how to download for free and install it😊
Retweet cos, it’s a THREAD 🧵
First I need y’all to know that I can perform statistical and data analysis for your projects, research and academics with SPSS, mini tab, stata and excel.
My dm is opened for business 😊
One way ANOVA ➡️
Two way ANOVA ↔️
ANCOVA, MANOVA…. Etc
What are they and what are they used for?
This thread will define each of these and their applications to DATA ANALYSIS and DATA SCIENCE.
Retweet because , it’s a THREAD 🧵
Let’s go 💨
Let’s start with definitions.
Analysis of variance - ANOVA for short is a statistical analysis that we use to check if there is a difference in the mean of at least 2 groups by the use of their variance.
In simple words, ANOVA defines DIFFERENT from VARIABILITY 😇
Jul 7, 2023 • 4 tweets • 2 min read
We can’t overstate how important DATA VISUALIZATION and STORYTELLING is to data analysis and business intelligence 😊.
So here are the best 8 pdfs on DATA VIZ. n STORYTELLING.
Kindly retweet and follow me for more.
Check ⬇️for extra 😉 https://t.co/Qu5Yoxsagidrive.google.com/drive/folders/…
If you wish to learn statistics for DATA SCIENCE and DATA ANALYSIS…. I have the perfect playlist to get you started.
Your job as a data analyst is to solve problems with your data set, and statistically any decision you make can never be 100% correct, that is there is a form of error in your conclusion or a chance your result is by luck.. this is STATISTICAL SIGNIFICANCE
It’s a thread🧵🪡🤗
Let’s start with a simple logic.
If I am 95% sure of the result of my conclusion, it means I’m 5% not sure 🤔.
If I’m 90% sure, I’m 10% not sure…. As we will see in later these are the loose definition for confidence interval and level of significance.