Part 4 – Religion in America: Evidence from Cellphone Data
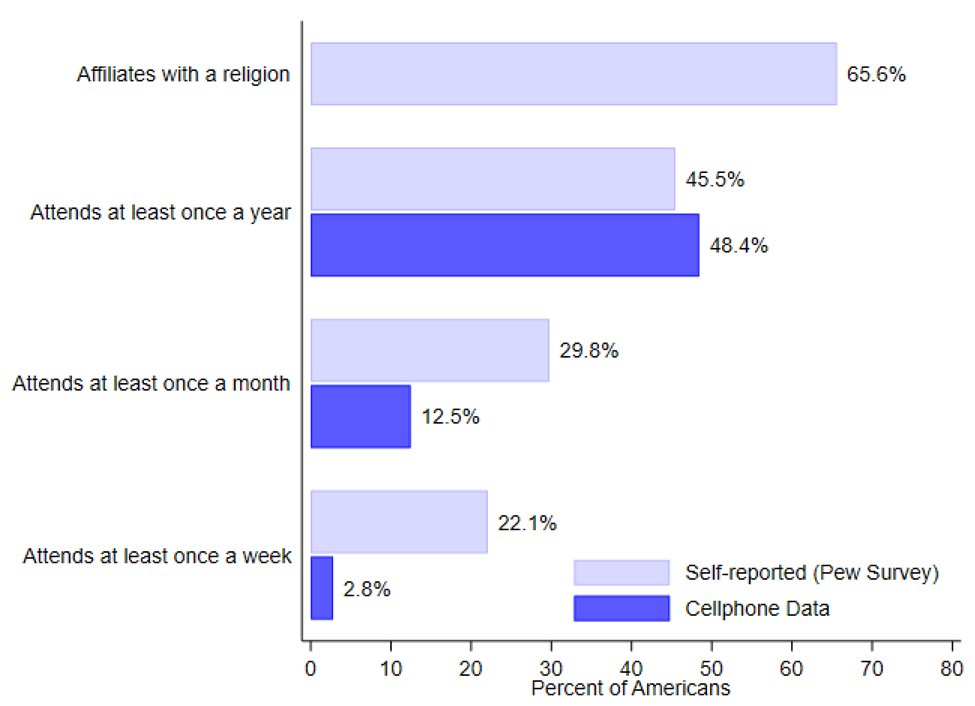
In this post, I compare the frequency of religious worship attendance using my cellphone data with self-reported attendance separately by religion.
In this post, I compare the frequency of religious worship attendance using my cellphone data with self-reported attendance separately by religion.
Protestants: Using cellphone data, I classify 35.9% of Americans as Protestants who attend at least once. One out of 15 Protestants attend “weekly” (at least 36 weeks during my 47-week sample). 

Catholics: Using cellphone data, I classify 8.7% of Americans as Catholics who attend at least once. One out of 51 Catholics attend “weekly” (at least 36 weeks during my 47-week sample).

Latter-day Saints (Mormons): Using cellphone data, I classify 1.4% of Americans as Latter-day Saints who attend at least once. One out of 7 Latter-day Saints attend “weekly” (at least 36 weeks during my 47-week sample).

Jehovah’s Witnesses: Using cellphone data, I classify 0.44% of Americans as Jehovah’s Witnesses who attend at least once. One out of 15 Jehovah’s Witnesses attend “weekly” (at least 36 weeks during my 47-week sample).

Orthodox Christians: Using cellphone data, I classify 0.41% of Americans as Orthodox Christian who attend at least once. One out of 46 Orthodox Christians attend “weekly” (at least 36 weeks during my 47-week sample).

Jews: Using cellphone data, I classify 0.74% of Americans as Jews who attend at least once. One out of 247 Jews attend “weekly” (at least 36 weeks during my 47-week sample). [CAREFUL: Many observant Jews may not have cellphones during service]

Muslims: Using cellphone data, I classify 0.29% of Americans as Muslims who attend at least once. One out of 58 Muslims attend “weekly” (at least 36 weeks during my 47-week sample).

Buddhists: Using cellphone data, I classify 0.31% of Americans as Buddhist who attend at least once. One out of 775 Buddhists attend “weekly” (at least 36 weeks during my 47-week sample).

Some overall takeaways:
1. I find evidence in all religions that people over report the frequency of religious worship.
2. The number of “weekly” attenders in all religions is small compared to the number of people who attend less regularly.
1. I find evidence in all religions that people over report the frequency of religious worship.
2. The number of “weekly” attenders in all religions is small compared to the number of people who attend less regularly.
3. There are differences in the fraction of “weekly” attenders by religion. For example, 14x more Americans identify as Catholics than Latter-day Saints (Mormons), but slightly more weekly-attending Latter-day Saints than Catholics (.20% of Americans compared to 0.17%).
3 cont. But because there are so many Catholics compared to Latter-day Saints who attend once a month or a few times a year, there are far more Catholics in church on any given Sunday (~4M compared to ~1.4M).
4. The vast majority of “weekly” attenders in the US are Protestants (85%).
• • •
Missing some Tweet in this thread? You can try to
force a refresh