Did you know Your Financial Statements Talk to Each Other?
Here’s How to Connect them:
Here’s How to Connect them:
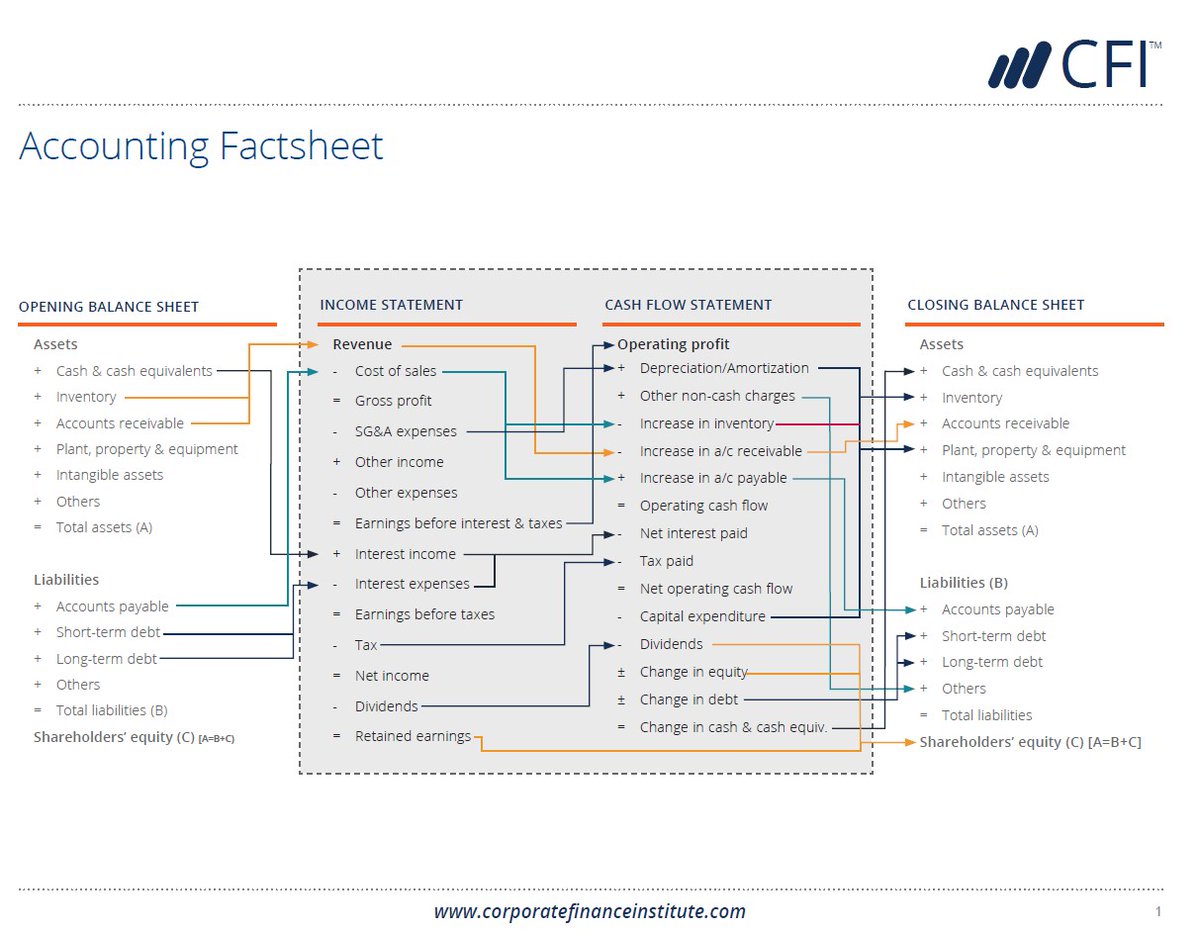
➡️The Balance Sheet uses information from the Income Statement for its reporting.
and
➡️The Income Statement uses the assets, liabilities, and equity from the Balance Sheet in its activity.
and
and
➡️The Income Statement uses the assets, liabilities, and equity from the Balance Sheet in its activity.
and
➡️ The Cash Flow Statement acts as a bridge between the Income Statement and Balance Sheet by showing the amount of cash that was generated in, and used by, the business.
🎯 Here’s how to integrate them in a dynamic model.
🎯 Here’s how to integrate them in a dynamic model.
1️⃣ Net Income flows from the Income Statement to the Balance Sheet (through Retained Earnings) and to the Cash Flow Statement (through Operating Cash Flow).
2️⃣ Changes in Current Assets and Liabilities from the Balance Sheet are aggregated to calculate Changes in operating Assets and Liabilities in the Cash Flow Statement (Operating Cash Flow).
3️⃣ Depreciation Expense is added back into the Operating Cash Flow section of the Cash Flow Statement.
In the Investing Cash Flow section, the Depreciation Expense is then deducted from the opening Fixed Assets balance and any changes in Fixed Assets are accounted for to calculate the net Investing Cash Flow.
4️⃣ The opening balance of Long Term Debt is deducted from the ending balance to calculate Financing Cash Flows.
5️⃣ The prior period’s closing cash balance plus the current period’s sum of cash flows from operations, investing, and financing becomes the closing cash balance for the period on the Balance Sheet.
🎯 Remember:
🎯 Remember:
☑️ To put together a Cash Flow Statement you only need 2 balance sheets and the income statement covering the period of time between the two balance sheets.
☑️ Use it to understand how cash moved in and out of the business during the period and draw critical insights on the business, its health and its risk profile
☑️ Positive cash flows aren’t always a positive indicators and negative cash flows aren’t always negative indicators.
☑️ Positive cash flows aren’t always a positive indicators and negative cash flows aren’t always negative indicators.
What do you think?
If you enjoyed this thread:
1. Follow me @IAmOanaLabes for more of these
2. Sign up for my free newsletter. and join 30,000 subscribers:
3. RT the tweet below to share the knowledge: https://t.co/IT72ZJKaalthe-finance-gem.beehiiv.com/subscribe
If you enjoyed this thread:
1. Follow me @IAmOanaLabes for more of these
2. Sign up for my free newsletter. and join 30,000 subscribers:
3. RT the tweet below to share the knowledge: https://t.co/IT72ZJKaalthe-finance-gem.beehiiv.com/subscribe
https://twitter.com/1612701806697627650/status/1682056643750645762
• • •
Missing some Tweet in this thread? You can try to
force a refresh