
Strategic Finance Coaching, Financial Planning & Business Intelligence | Join 400,000+ reading on socials and newsletter | MBA | CPA | Entrepreneur
 Where capital is sourced and deployed.
 Because CEOs focus on earnings instead of cash flow strategy.
 2. Investing Cash Flow (ICF)
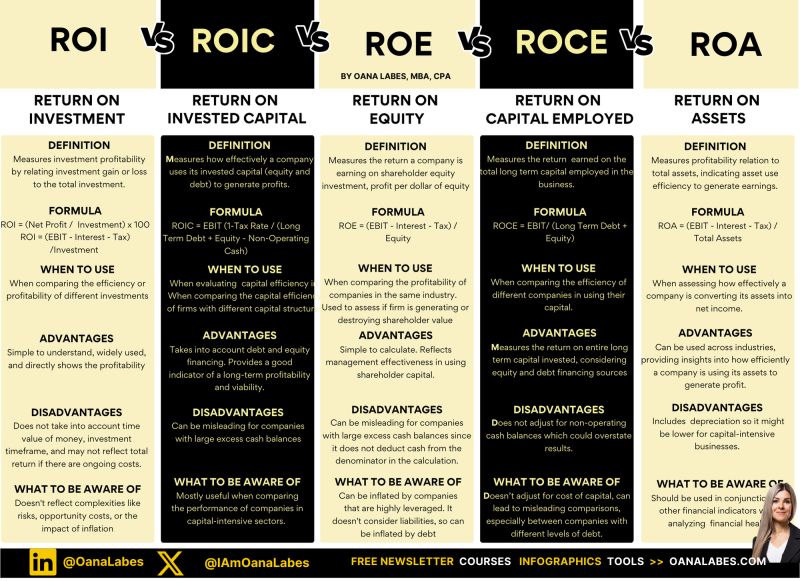 Formula: ROI = (Net Profit / Cost of Investment) * 100%
 Let's break it down.
 But complexity isn't strategy.
 2. Investing Cash Flow (ICF)
 Most leaders glance at the P&L and move on.
 Here's how I'd fix that in 7 days:
 Capital spending drains liquidity
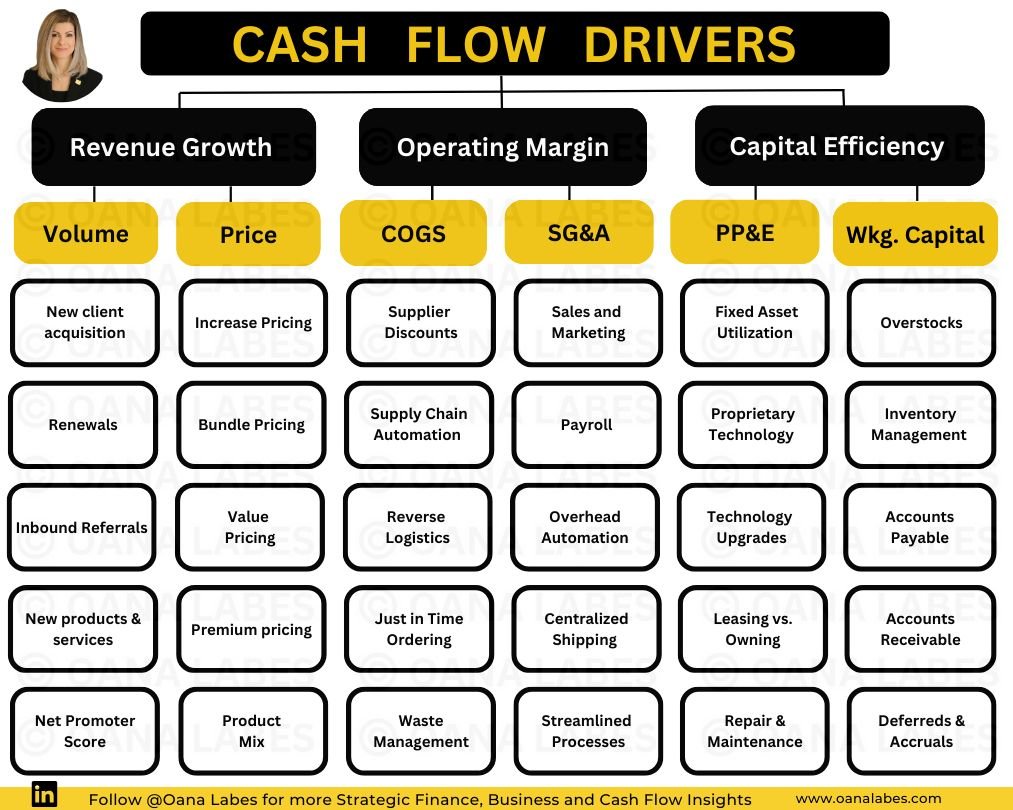 Operating Cash flows into your company from 3 main sources:
 1️⃣ Capital Sourcing:
 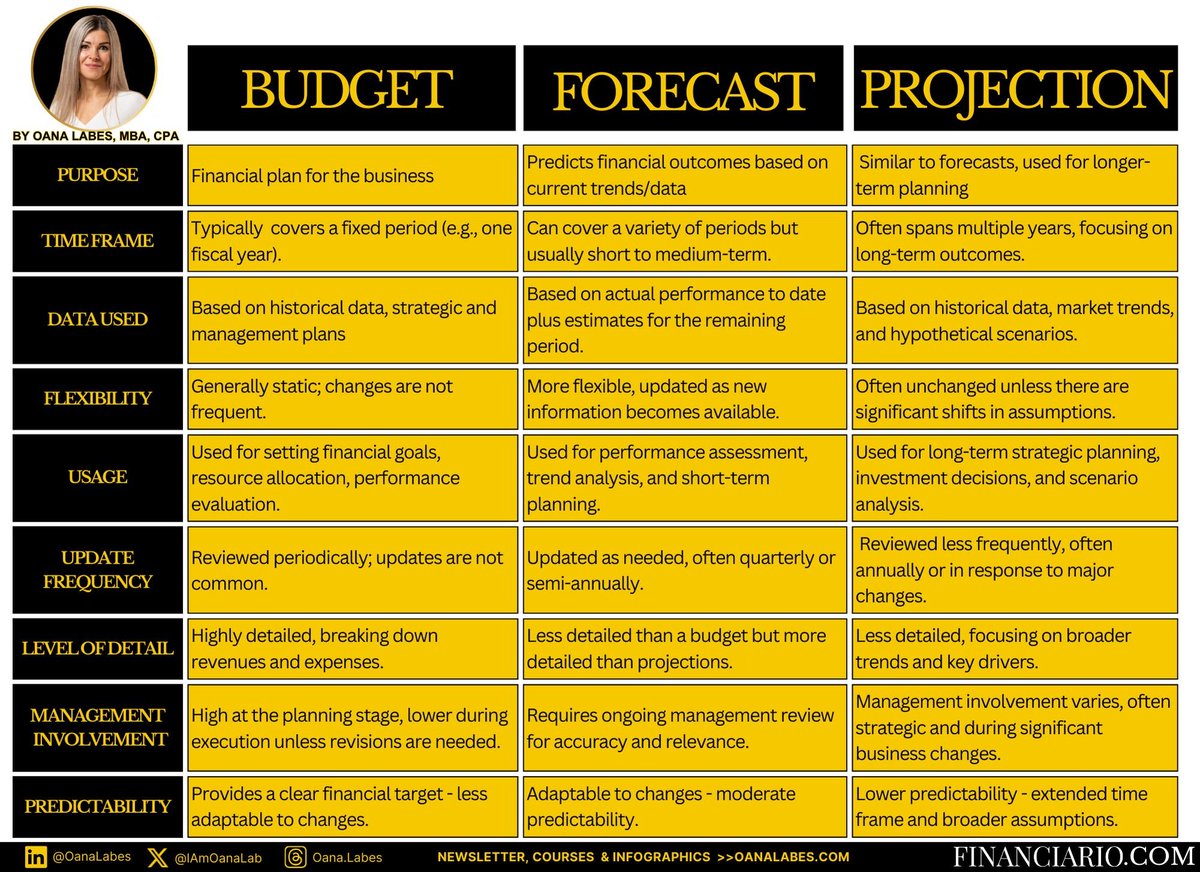 🎯 Budgets:
  1️⃣ EBITDA is not a standardized GAAP metric, allowing for manipulation.
 ➡️ Start with PESTEL Analysis
 EBITDA is also widely used in Valuations, Performance Management, Comparative Analysis and Commercial Financing.
 I spent thousands of hours in Excel and built lots of complex models.
  >> There are 3 types of business activities and each of them can absorb or release cash into a business.
 🎯NOPAT and EBIT are frequently used to evaluate a company's profitability.
  Most business problems fall into one of 3 main areas:
 Accounting and Finance are not the same.