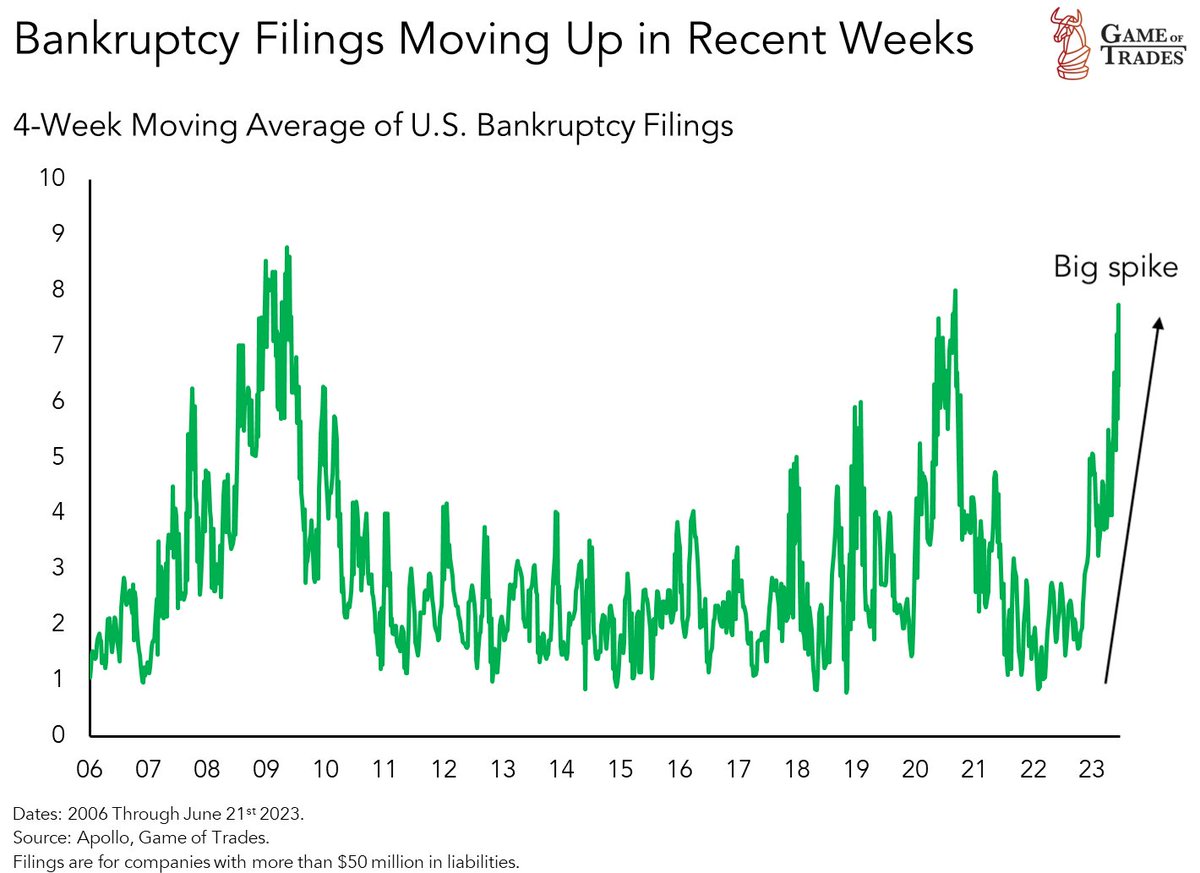
Corporate bankruptcies have been spiking in recent weeks
Let's take a look at why and the market implications
An important thread 🧵
Let's take a look at why and the market implications
An important thread 🧵
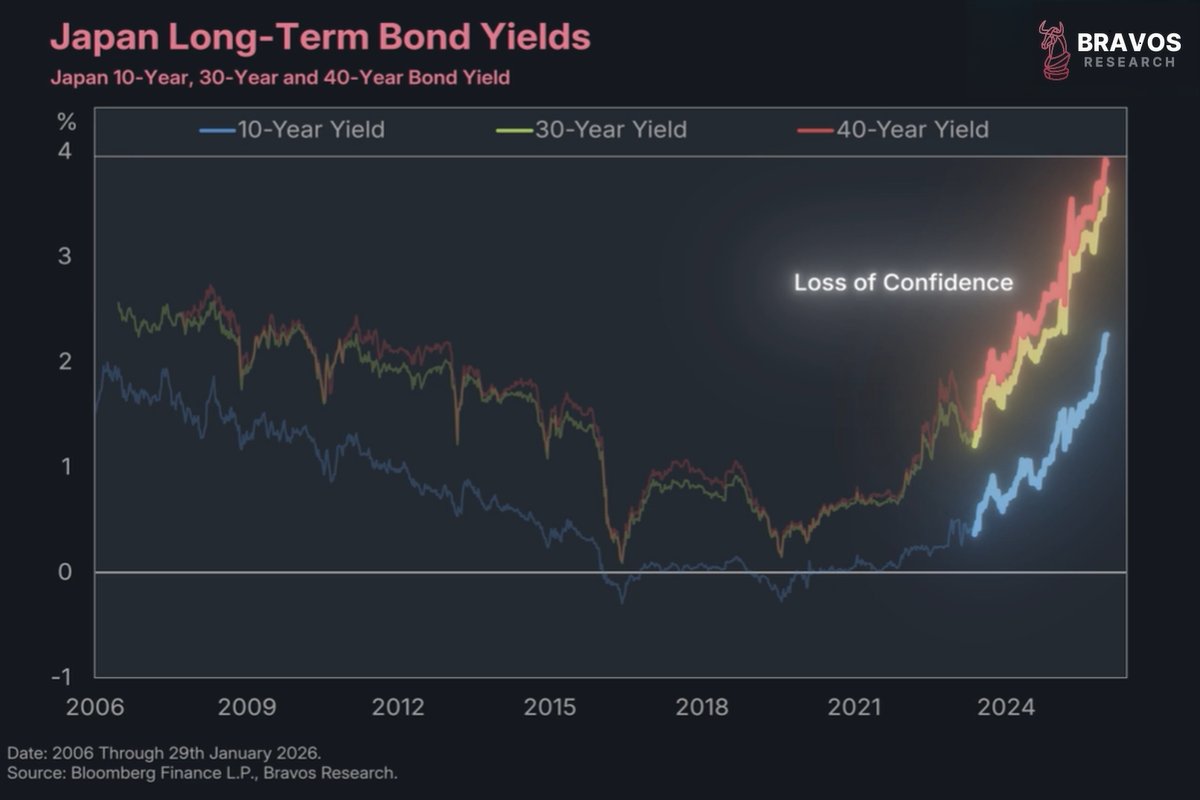
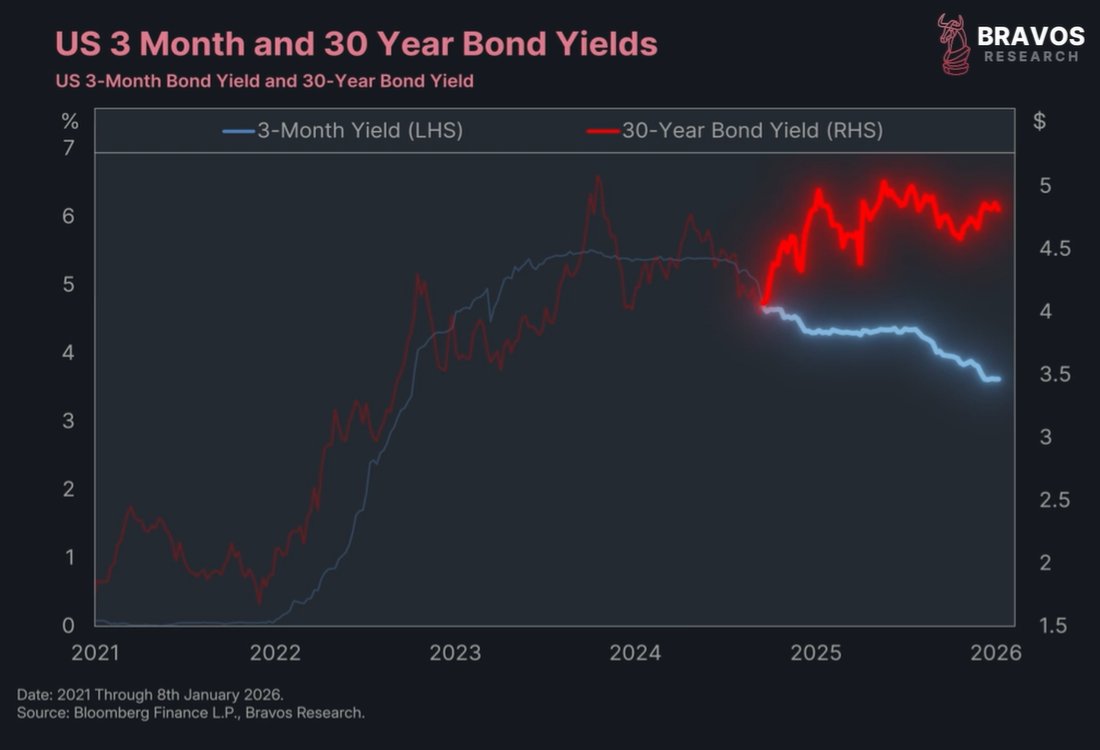
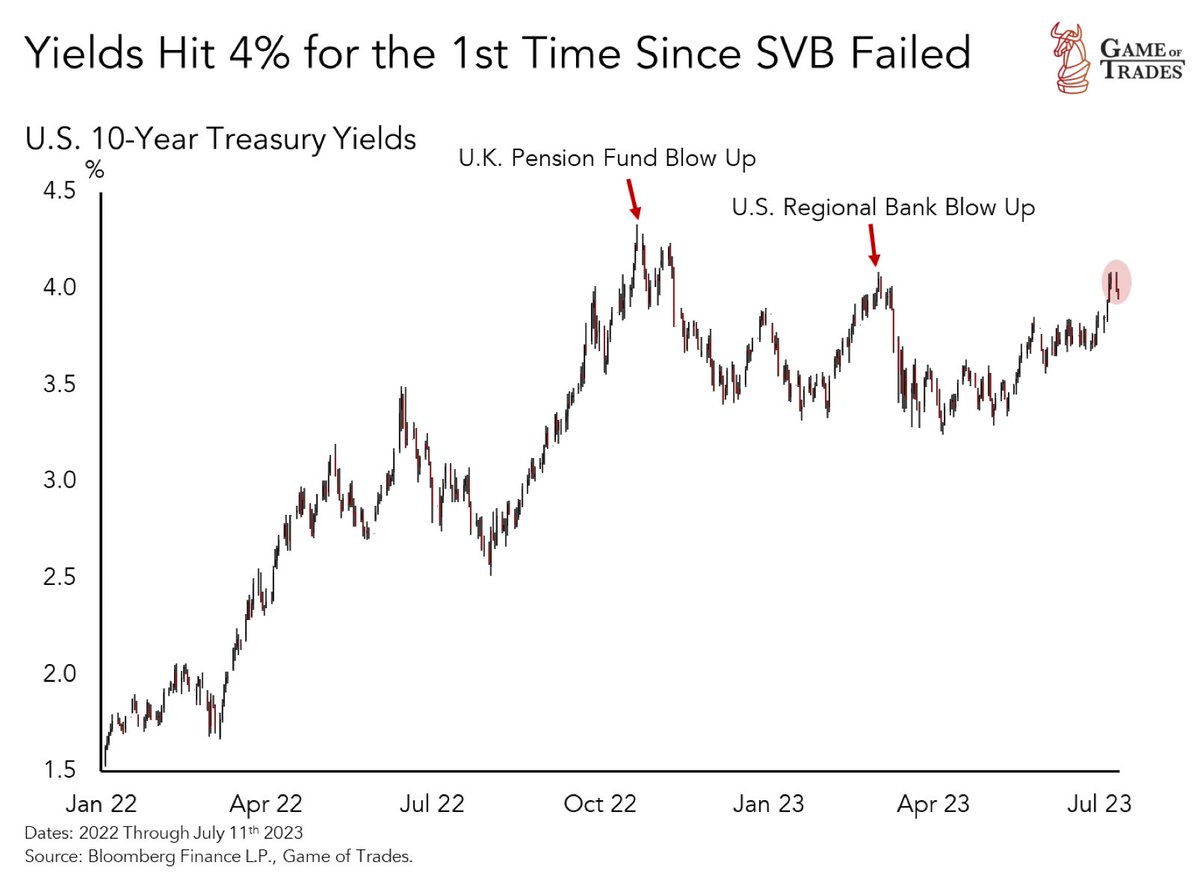
2/ Rising bankruptcies coincides with bond yields hitting 4%, a level previously associated with the Silicon Valley Bank collapse and UK pension fund crisis
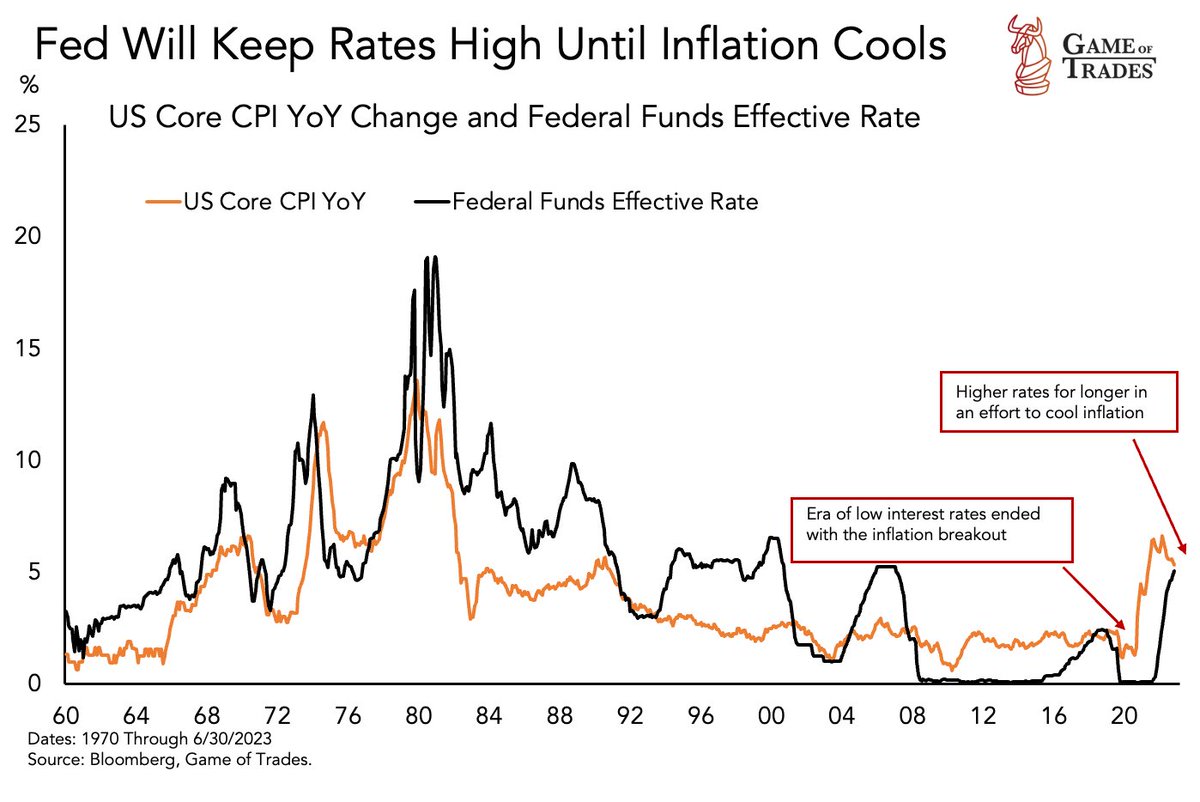
3/ Despite escalating financial stress, the Fed maintains a 'higher for longer' stance to curb inflation
This is amidst a U.S core CPI inflation rate persistently above 5% and the Fed funds rate
This is amidst a U.S core CPI inflation rate persistently above 5% and the Fed funds rate
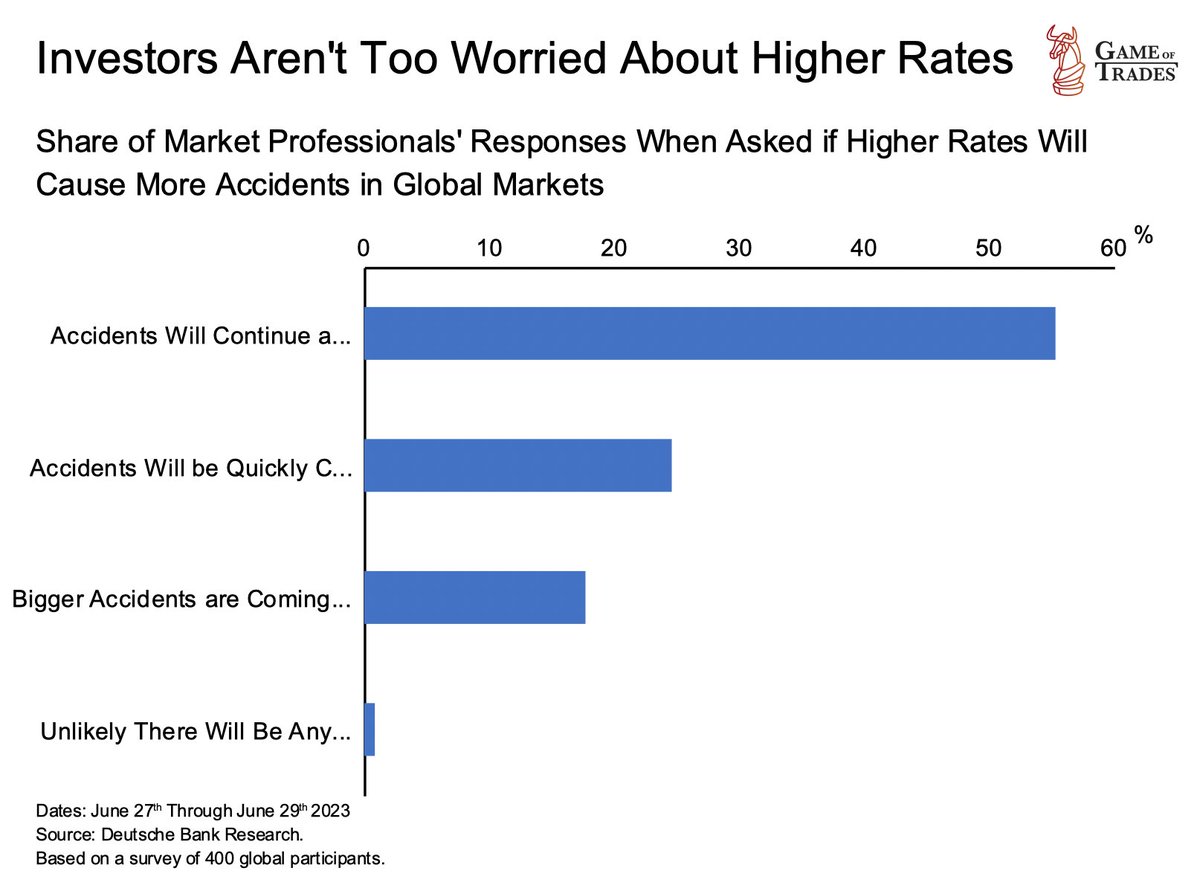
4/ A Deutsche Bank survey indicates that over half of market professionals anticipate market stress due to higher rates
While 20% foresee minimal impact, and approximately 17% warn of potential severe financial stress
While 20% foresee minimal impact, and approximately 17% warn of potential severe financial stress
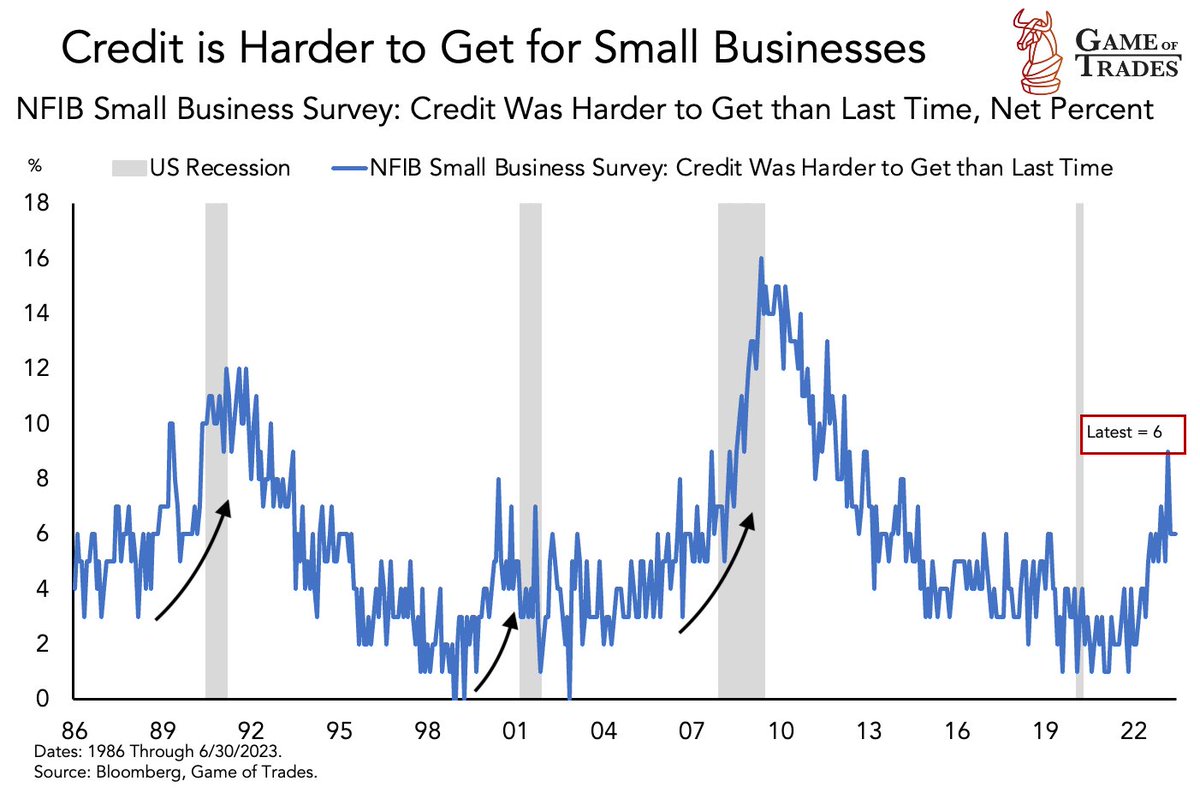
5/ Businesses are finding it increasingly challenging to secure loans due to stricter credit standards, a consequence of higher rates
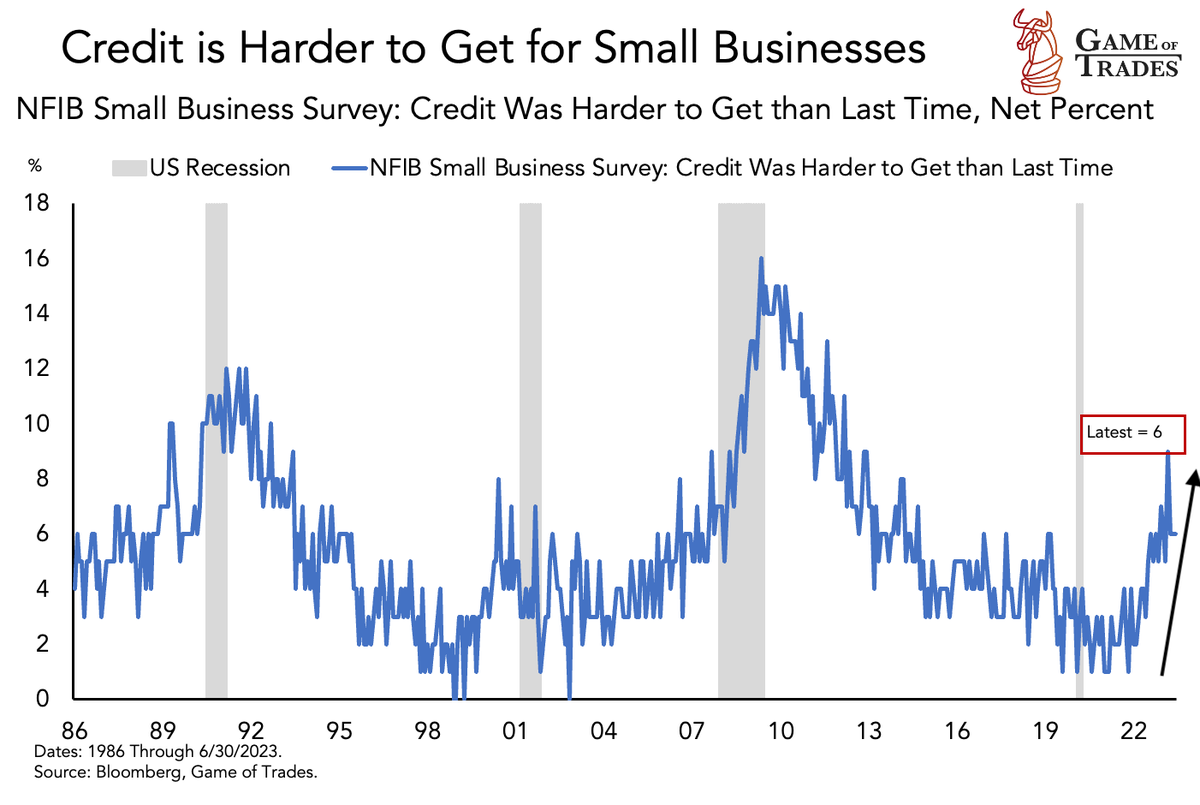
6/ Historically, tighter lending standards precede recessions, as evidenced in:
- 1989
- 1999
- 2007
In each case, the Fed was in a tightening cycle
- 1989
- 1999
- 2007
In each case, the Fed was in a tightening cycle
7/ The stricter credit standards aligns with the rise in bankruptcy filings, as per Apollo research
It’s important to note that the bankruptcy filings are from companies with liabilities exceeding $50 million, a specific sample
It’s important to note that the bankruptcy filings are from companies with liabilities exceeding $50 million, a specific sample
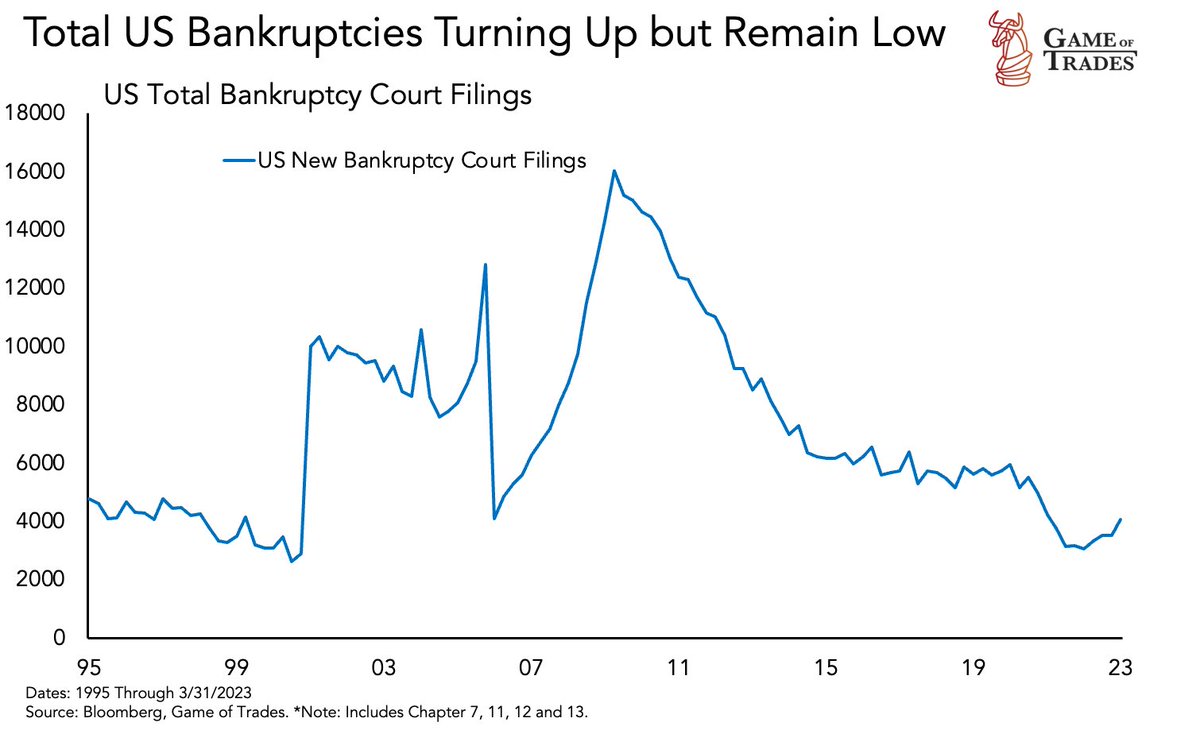
8/ A broader view of total U.S. bankruptcy court filings from a different dataset presents a different narrative
Bankruptcy filings remain low on a relative basis, but have been trending higher
Bankruptcy filings remain low on a relative basis, but have been trending higher
9/ The current default rate is merely the beginning
As the Fed sustains high rates, bankruptcy figures are set to worsen
While 2023 sees limited debt maturing, refinancing concerns escalate from 2024 onwards
As the Fed sustains high rates, bankruptcy figures are set to worsen
While 2023 sees limited debt maturing, refinancing concerns escalate from 2024 onwards
10/ The chart below illustrates annual debt maturity and the breakdown of speculative vs investment-grade debt maturing
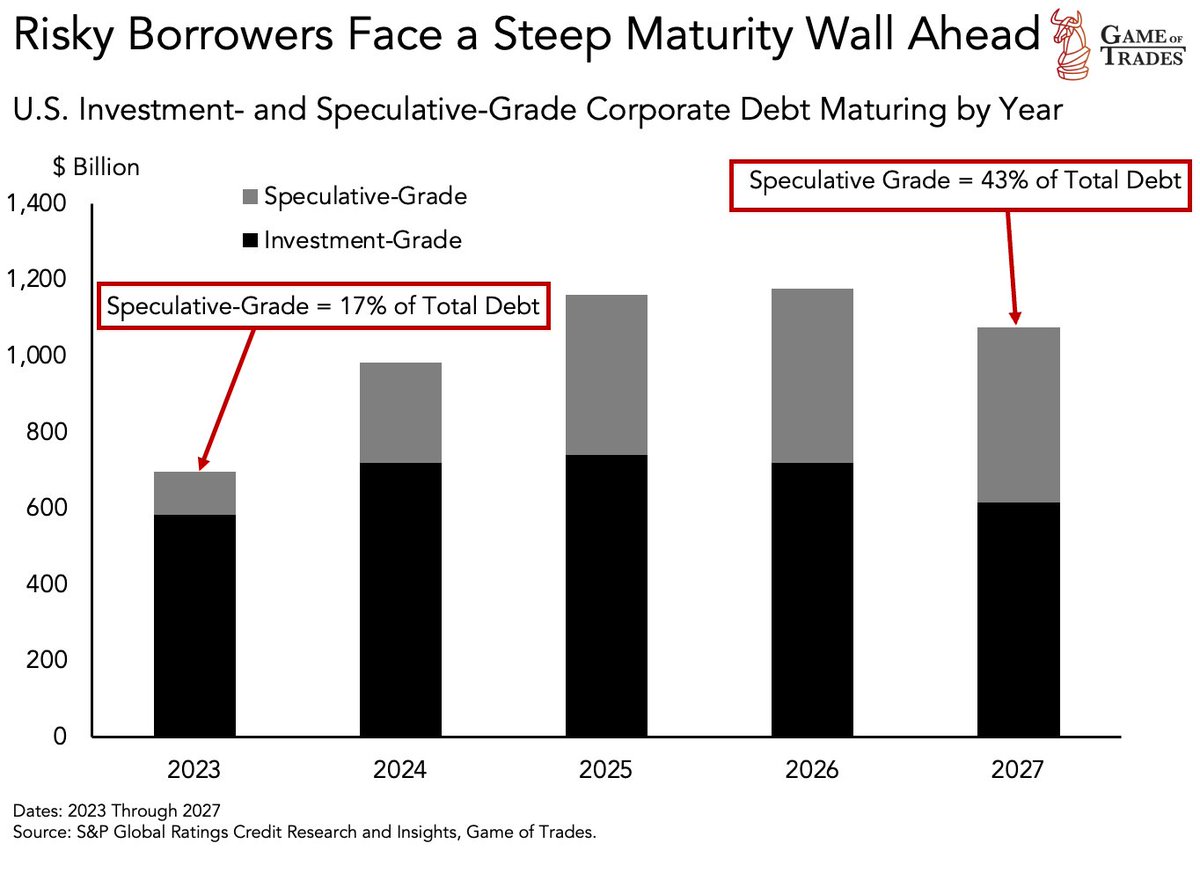
11/ In 2023, approximately $700 billion of debt matures, sparing businesses that refinanced at low rates in 2020/21 from higher rate environments
However, in 2024, debt maturity is expected to surge to $1 trillion, and in 2025, it is expected to reach $1.2 trillion
However, in 2024, debt maturity is expected to surge to $1 trillion, and in 2025, it is expected to reach $1.2 trillion
12/ The market's current lack of concern stems from the economy's delayed response to interest rate hikes since 2022
Which also explains the persistently low credit spreads
Which also explains the persistently low credit spreads
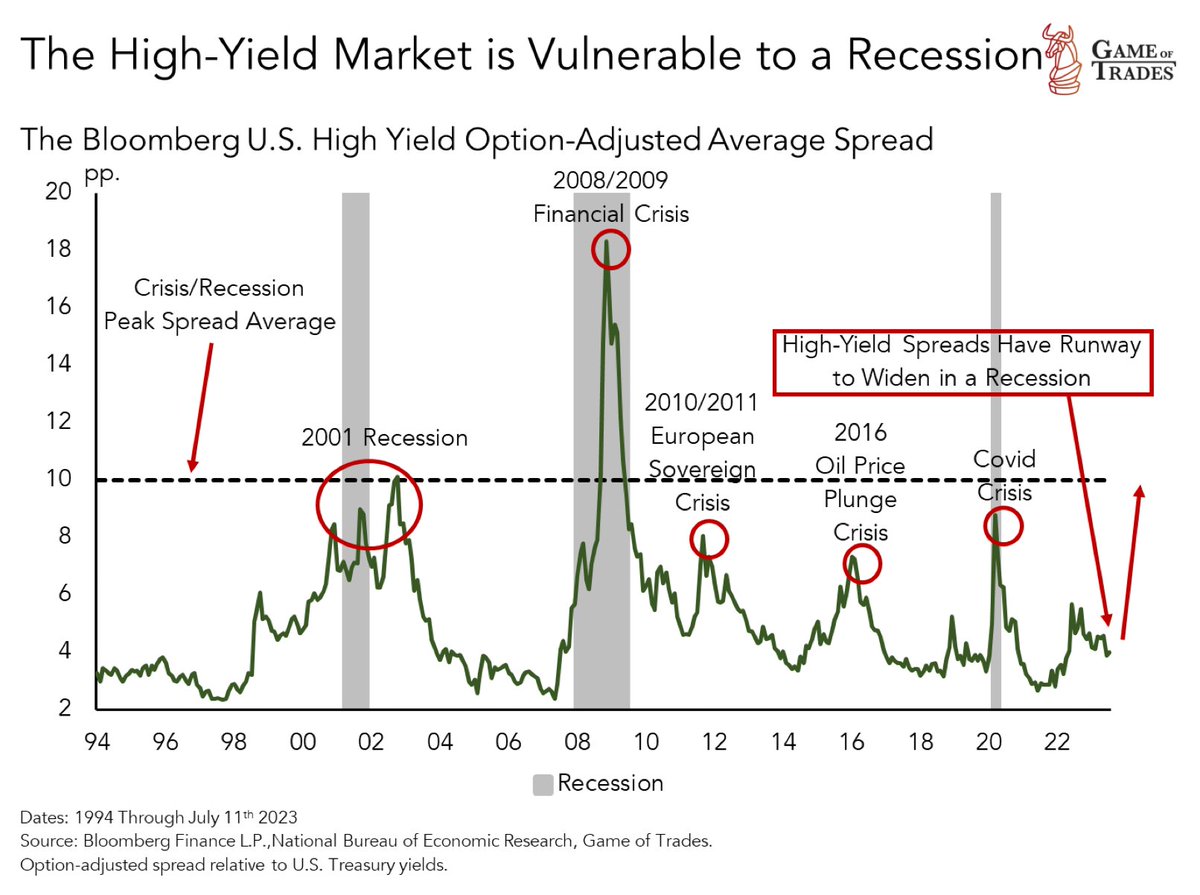
13/ Credit spreads, indicative of credit risk pricing in financial markets, typically rise ahead of recessions, as seen in 2001, 2008 and 2020
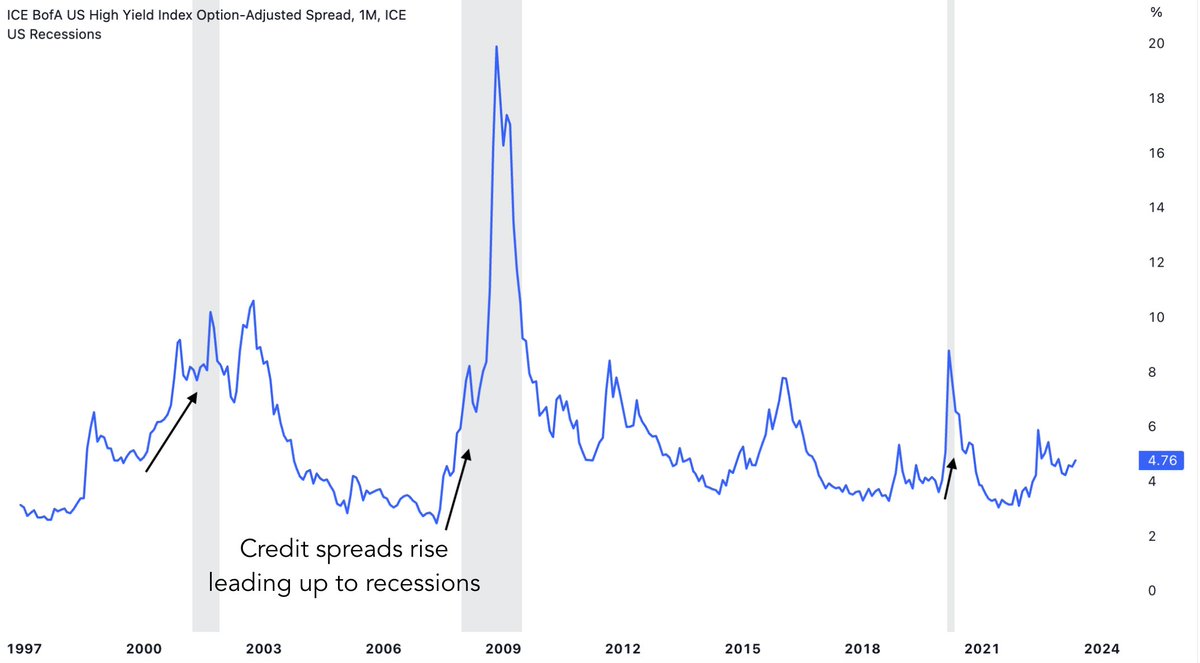
14/ Despite recent bankruptcies, credit spreads remain stable due to 2 factors:
1. Most companies have yet to refinance their debt
2. The economy has not yet entered a recession
1. Most companies have yet to refinance their debt
2. The economy has not yet entered a recession
15/ As the Fed persists with restrictive rates, the market is likely to price in more risk as bankruptcies increase
This could lead to wider credit spreads and lower stock prices, with the peak panic occurring during the recession
This could lead to wider credit spreads and lower stock prices, with the peak panic occurring during the recession
16/ Our goal at is to help you navigate uncertain markets through evidence based insights
We're committed to the thoroughness of our research, striving to comprehend underlying dynamics and fundamental reasons behind behaviors
Get your FREE 7-day trialgameoftrades.net
We're committed to the thoroughness of our research, striving to comprehend underlying dynamics and fundamental reasons behind behaviors
Get your FREE 7-day trialgameoftrades.net
• • •
Missing some Tweet in this thread? You can try to
force a refresh