As one can see, the US has indeed returned to baseline in terms of All Cause Mortality, as proclaimed widely in the MSM.
But that is NOT the story, and unwise are they who wallow in its red herring sauce.
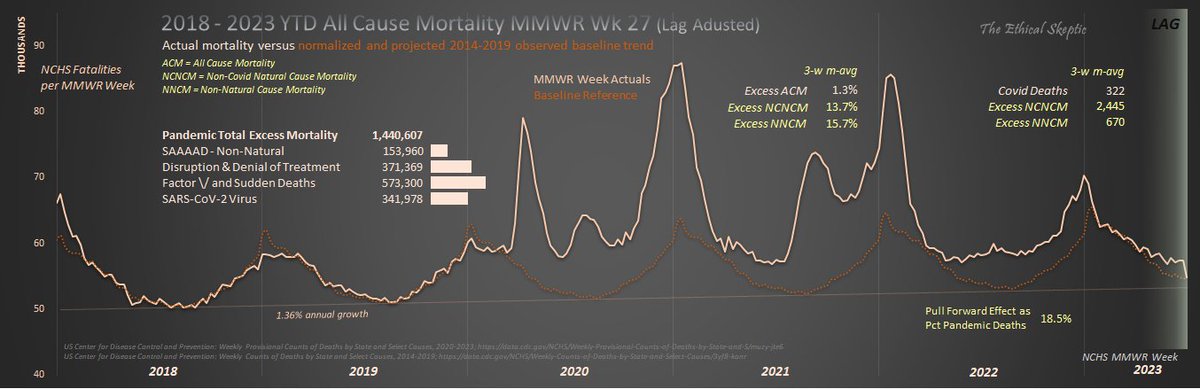
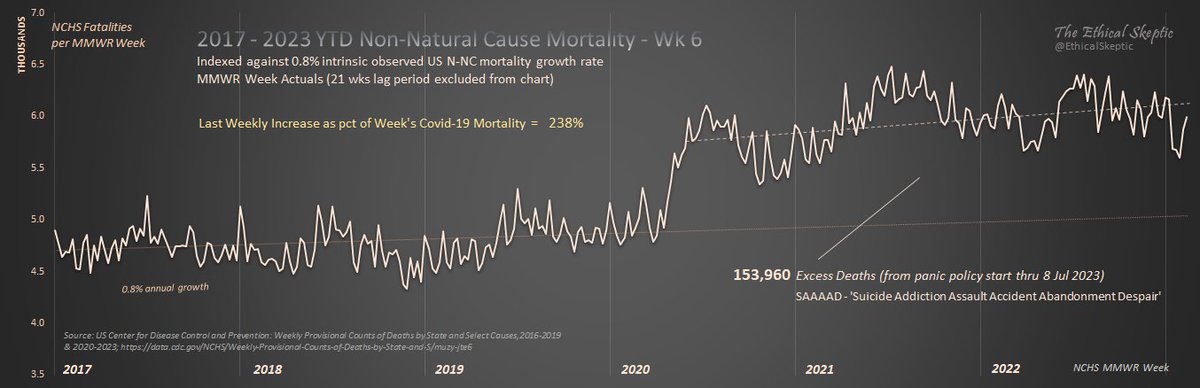
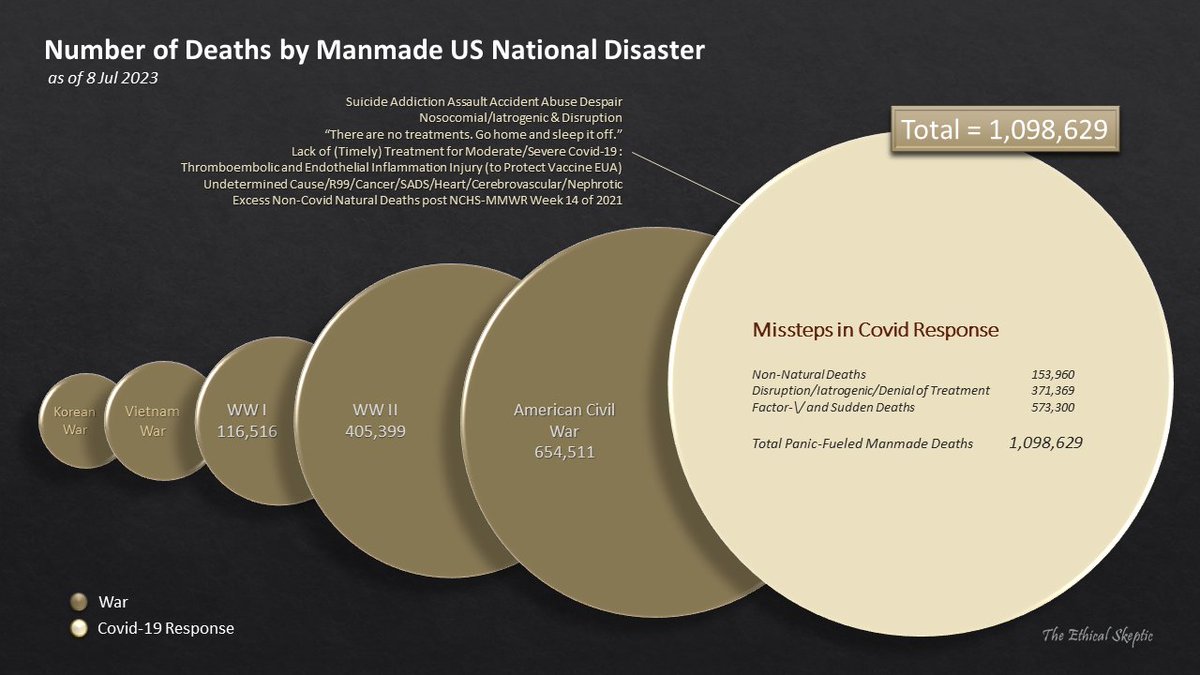
In terms of Excess Non-Natural Cause Mortality, we still reside at 15.7%.
The fact that this mortality now features a natural seasonality implies that natural deaths are concealed in this death category.
They've ceded the lockdown argument in an effort to protect the vaccine.
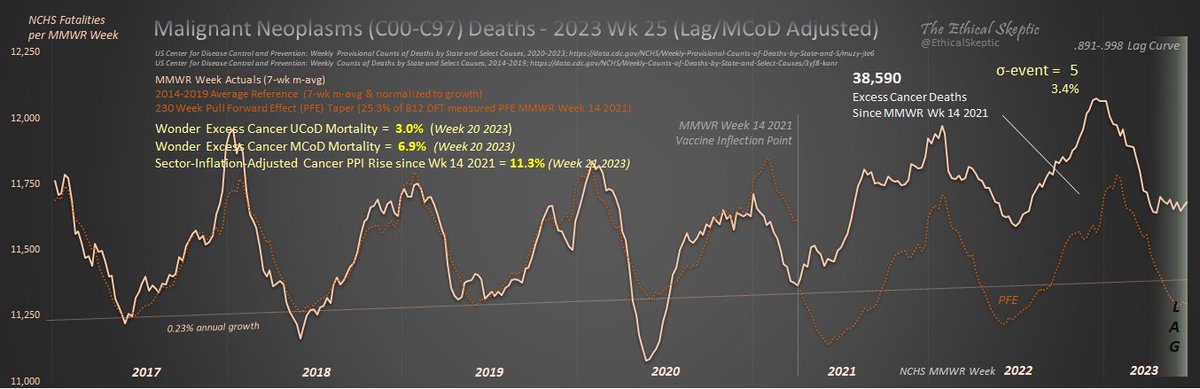
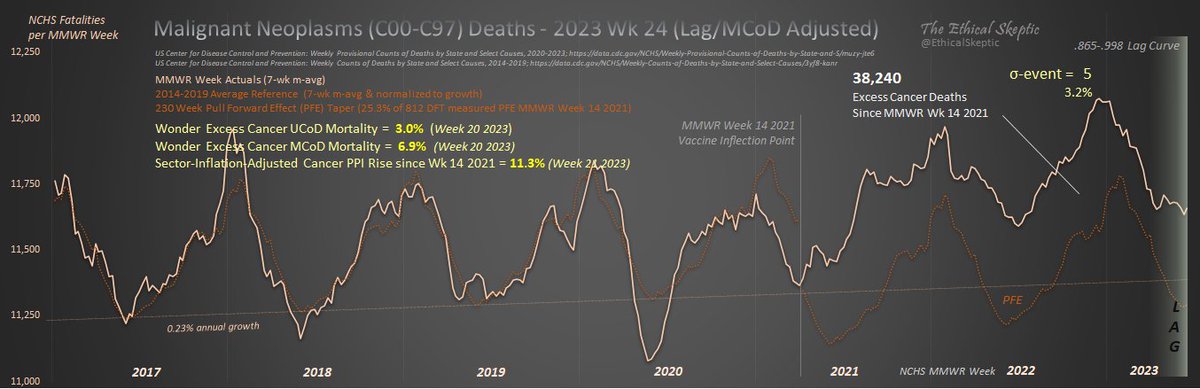
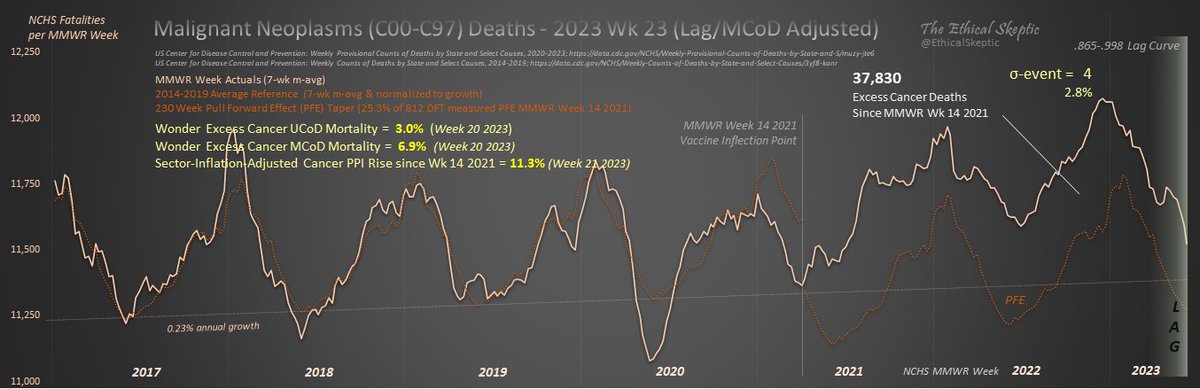
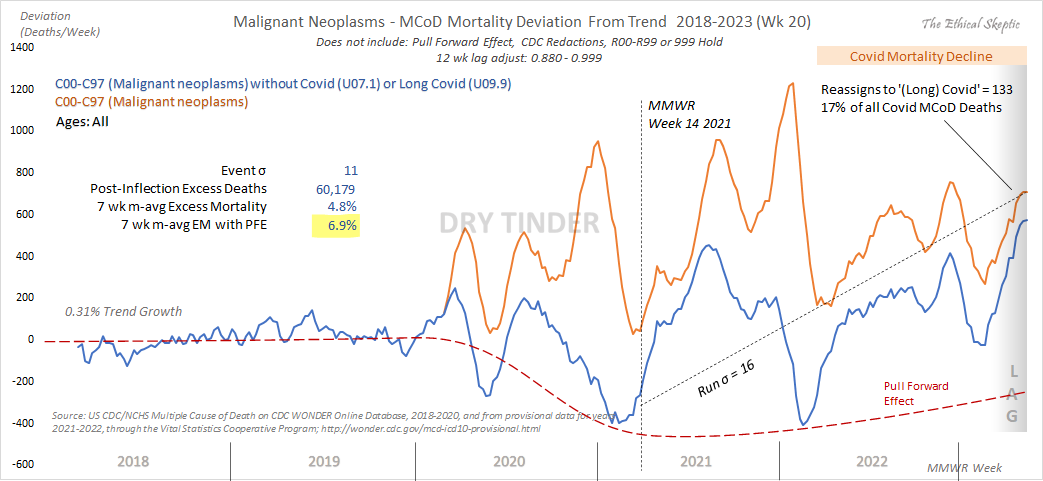
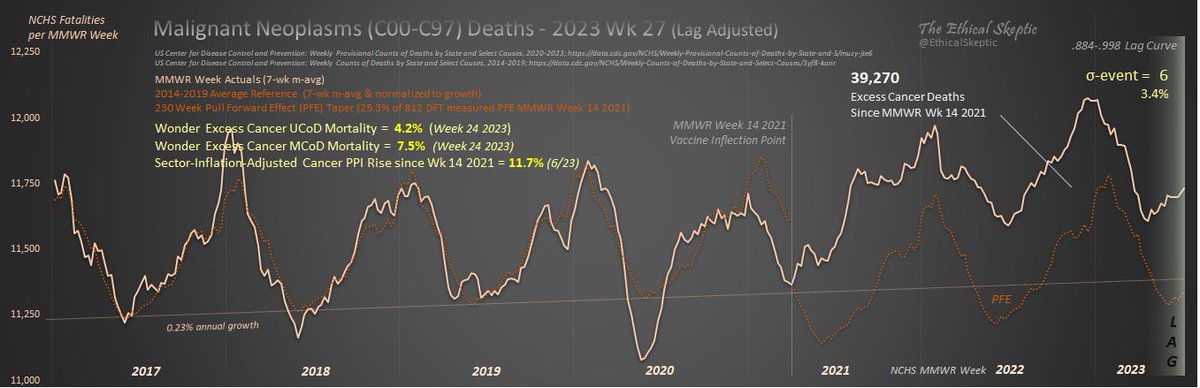
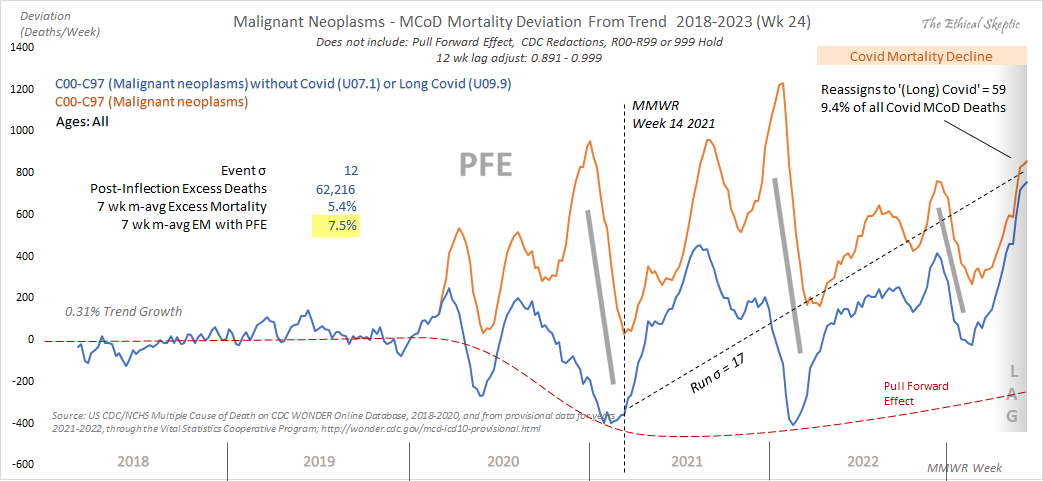
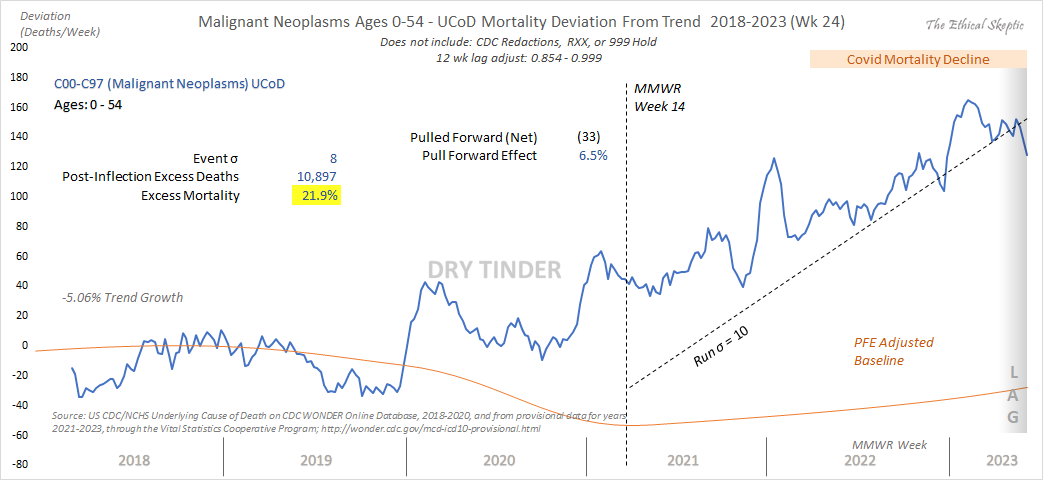
Meanwhile Cancer continues it unabated march of excess.
Underlying Cause = 3.4 - 4.2% (6-sigma)
Multiple Cause = 7.5%
Ages 0-54 = 22%
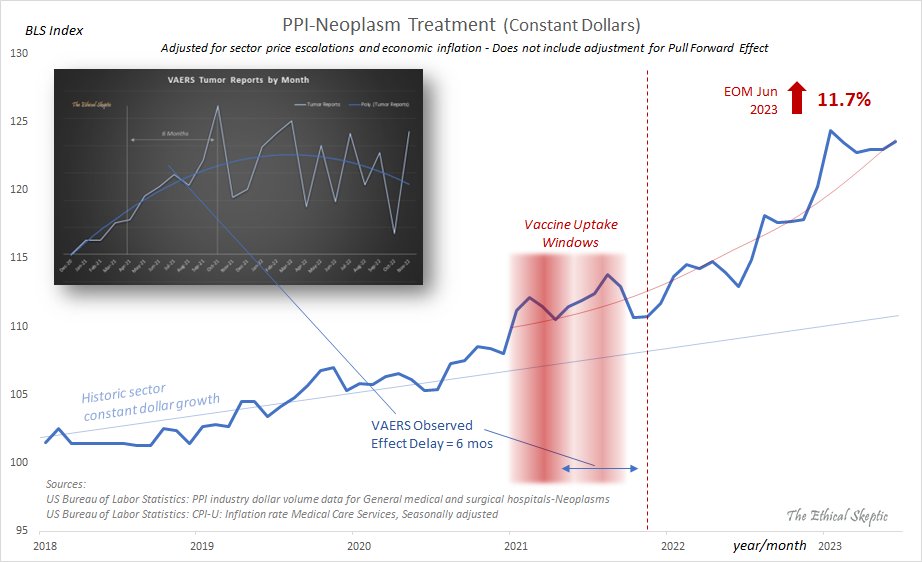
Treatment Expenditures = 11.7% (rising during 'spring lull')
"Iceberg right ahead..."
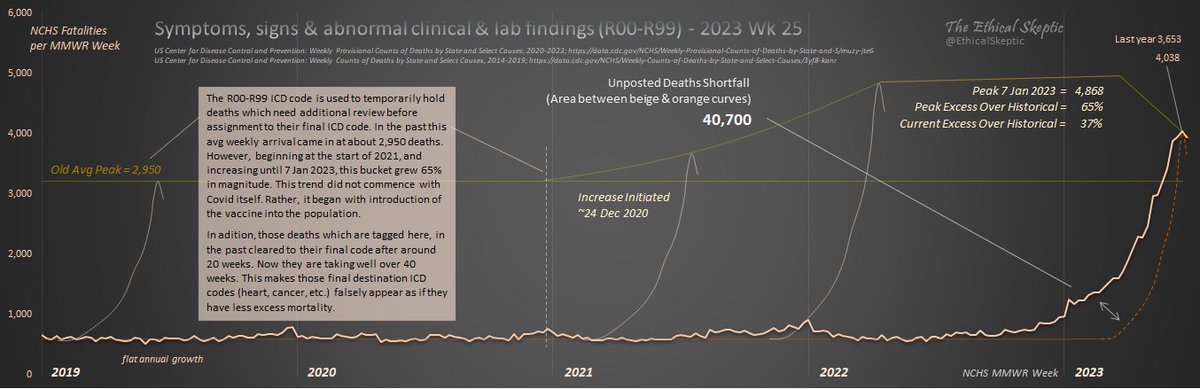
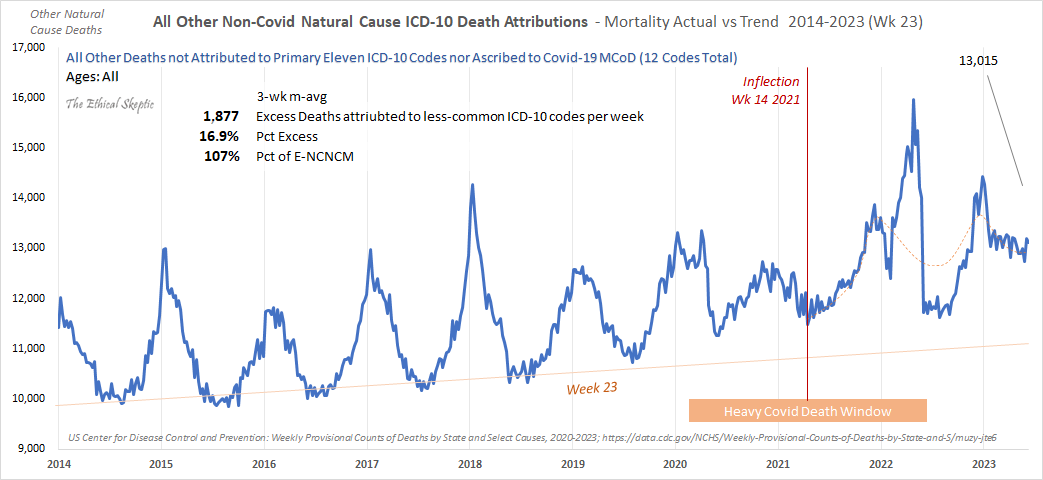
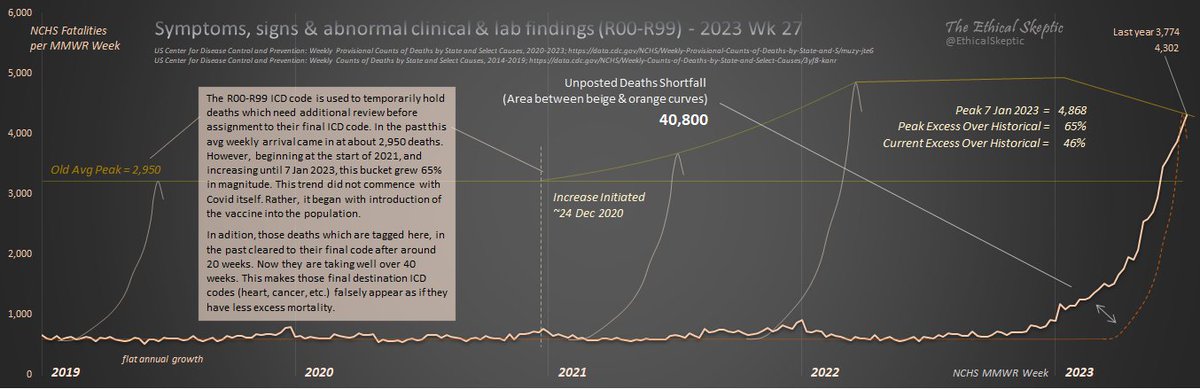
Abnormal Clinical & Lab Findings Mortality is 15% higher than it was during last year's spring lull.
CDC is barely keeping pace with reconciling this flood of deaths. Hovering at around 41 K deaths which have still not been included in cancer/heart etc. mortality yet.
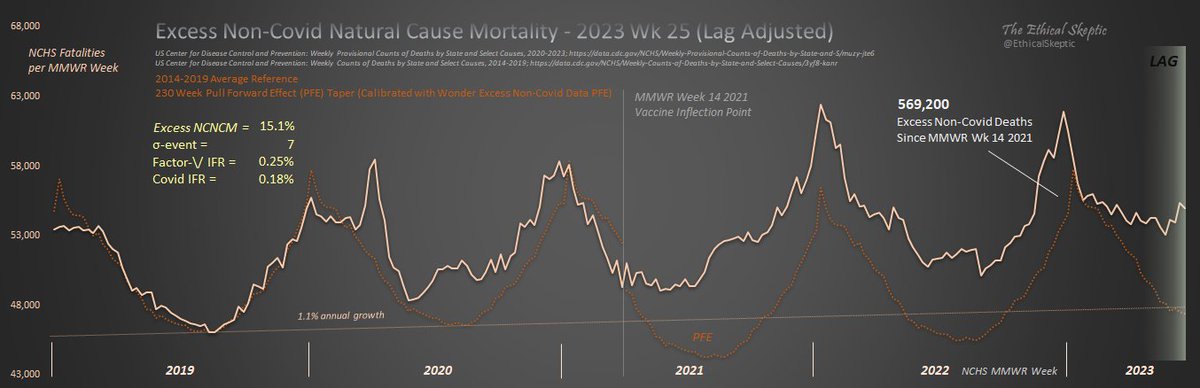
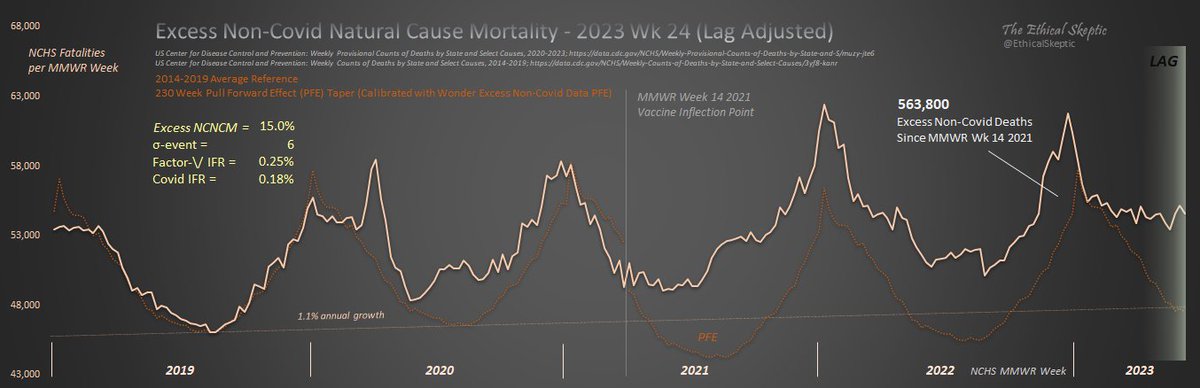
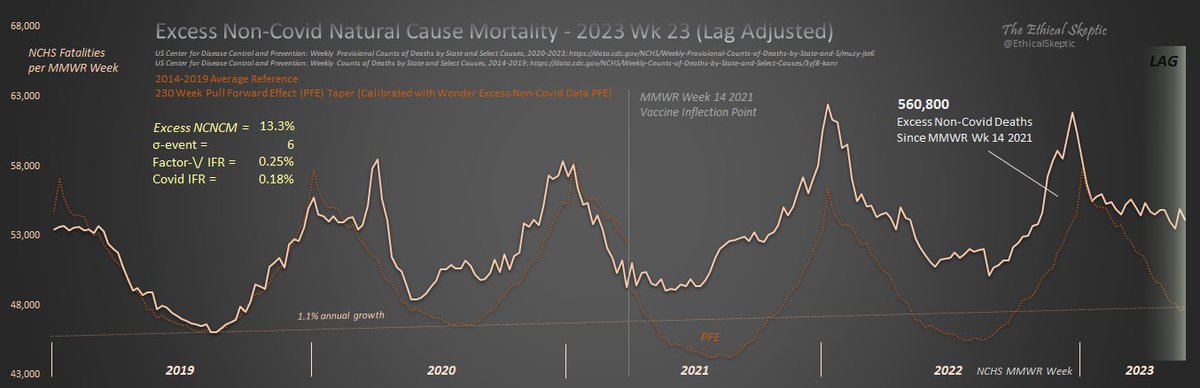
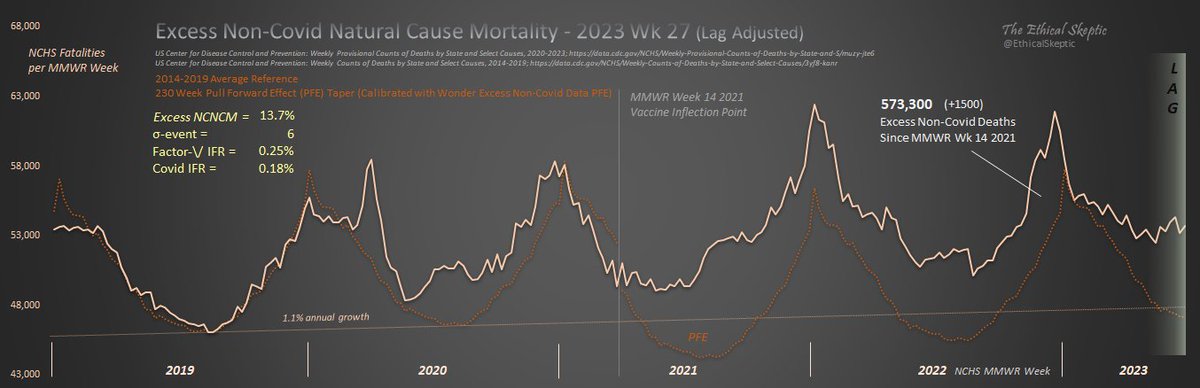
In terms of Excess Non-Covid Natural Cause Mortality we are at 13.7% :
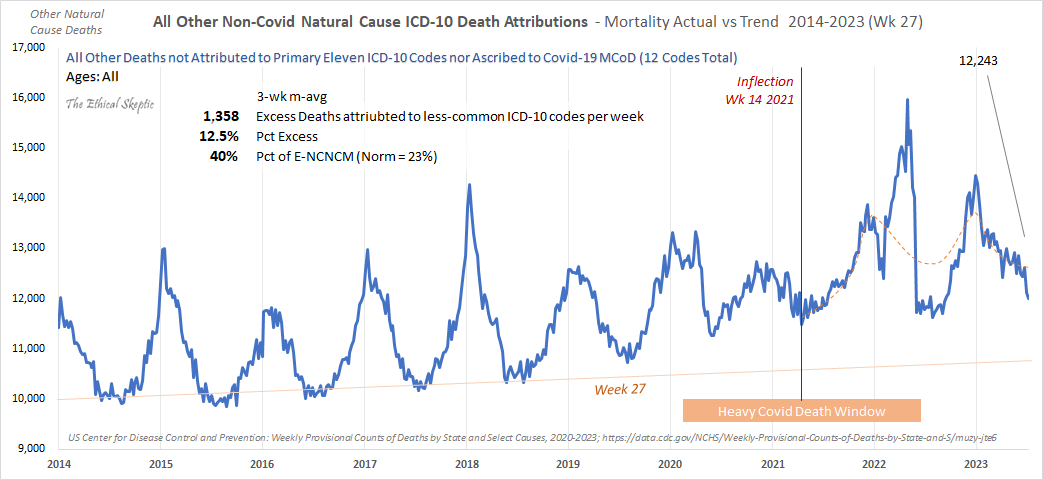
1. erodes by 2 K deaths wks 12 - 26, as they are ascribed to non-natural-cause/Covid, ...after the fact
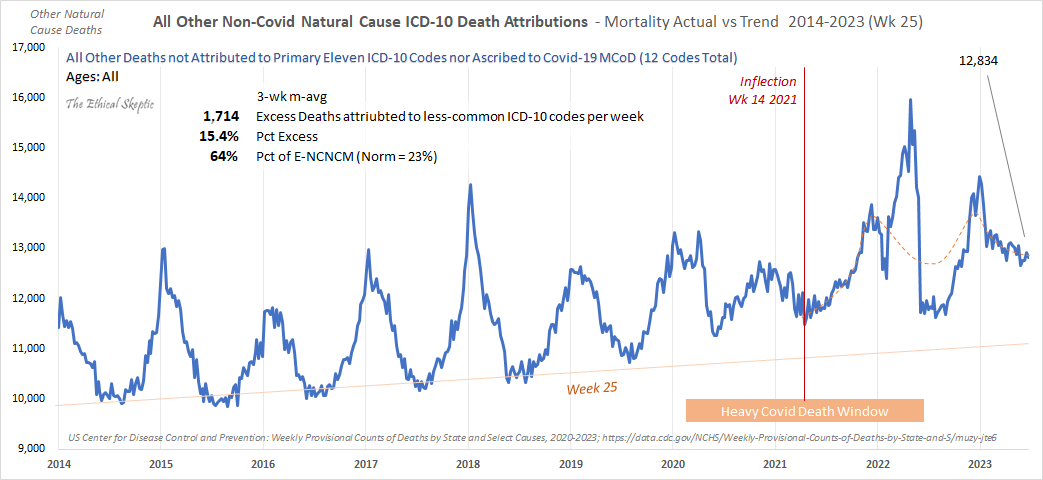
2. now hidden/entropy inside less common ICD codes (right chart)
Rest assured that we will keep tracking this Party disaster as it continues into the foreseeable future.
These people must be held to account for the 1.1 M deaths (thru 8 Jul 2023) and destruction they
▫️ Genetically Created
▫️ Released upon the Innocent
▫️ Wrought in Panic
• • •
Missing some Tweet in this thread? You can try to
force a refresh
One must understand, that a real life operating model is nothing like an academic study:
1. Source Assumptions 2. Calculate Answer and Confidence Interval
Such analytic is fantasy. One study and done - move on to the next.
Little in the real world operates in this manner.
Operating models require daily intervention = testing, babysitting, and challenging of model norms and constraints. Neither are they static. A model is a living breathing thing, which changes over time as it is challenged every single day.
It is not the same thing as a one-and-done study submitted for peer review.
Such academic pretense substitutes false precision and heuristic in lieu of presence, dynamic stressing, persistence, and observational longevity.
People are so acclimated to being cajoled through simple huckster-speak on the part of those who claim authority, that they want to hear me express my points and evidence in that language as well. I don't speak in huckster.
"All the great philosophers and groundbreaking innovators, started out by 'explaining it to 5-year olds...'"
Even a 5 year old knows this is BS, so don't expect me to buy such wisdom, nor undertake such a mission.
It is the huckster who develops the ELI5 version, which is most often also wrong.
Under such tradecraft, once 'simplified', we can never dispel the notion, because everyone regurgitates its simple form over and over, yet no one actually comprehends it.
The bad news: This is the spring lull. These deaths are still 10.5% higher than last year's spring lull - and for no objective reason other than a continuation of the factor-\/, which began Dec 24, 2020.
Accordingly, Excess Non-Covid Natural Cause Mortality jumped to 569,200 deaths as of wk 25 2023. A 15.1% excess.
64% of these excess deaths were in minor ICD codes, when normally this should be around 23% - indicating entropy, as well as a younger age of death in this group.
Cancer meanwhile continues to signal that it has exited the spring lull early. Rising from a belly of 2.8% to 3.4% excess as of wk 25. We compress the lag curve more each week in order to keep the shaded lag area conservative.
We begin with Excess Cancer Mortality, which jumped to 3.2% over the last few weeks. This might be the seasonal saddle-inflection - too soon to tell. Will need to confirm with Wonder MCoD data in early July.
Excess Non-Covid Natural Cause Mortality rose to 15% excess. Too early for its seasonal saddle-inflection. We'll keep watch.
81% of these deaths are in ICD codes other than the top 12 (normally ~25%)... so some odd etiology or CDC work is at play. We shall see.
Abnormal Clinical & Lab Findings Mortality appears to have hit a floor at ~40% excess. Not good news. Whatever is causing the Excess Non-Covid Natural Cause Mortality is lower, but is not going away.
This effect non-linearly regresses to the last week of Dec 2020 - pretty stark
When each daily update entails significant change, decadal and generational influences are falsified as their genesis.
Don't get upset at me. Get upset at whoever obviated our comprehension as to how this system works.
If this were 'container ship sulfur emission reductions' then the largest ocean warming would have occurred when the sun's geographic position was directly over the MOST ocean surface (Dec 2022).
Instead, the opposite is happening.
And if this were 'current shifts' as many have explained, given that this is global in its scope, do you understand just how much kinetic energy is required to shift all the Earth's ocean currents inside 3 weeks?
One has jumped from the proverbial frying pan and into the fire.
Encouraging news with cancer, as its mortality parallels the baseline for the 15th week in a row. However, it is still elevated to the excess by 2.8%.
While below last year's absolute mortality for wk 23, we must bear in mind that this is lag period, and the MCoD for cancer mortality is 6.9% to the excess
...indicating that cancer deaths are simply being ascribed to other underlying causes right now, versus past practice.
In similar fashion, Excess Non-Covid Natural Cause Mortality is still running high, however this is concentrated outside the Big 12 ICD death causes (???).
As well, many of these deaths are reassigned heavily by the CDC to Non-Natural Cause Deaths during weeks 13 - 26.