The constant chatter from some about incoming Omicron Like Events every time infections rise is silly.
For some people, when they lack understanding, it's hard for them to comprehend that anyone does.
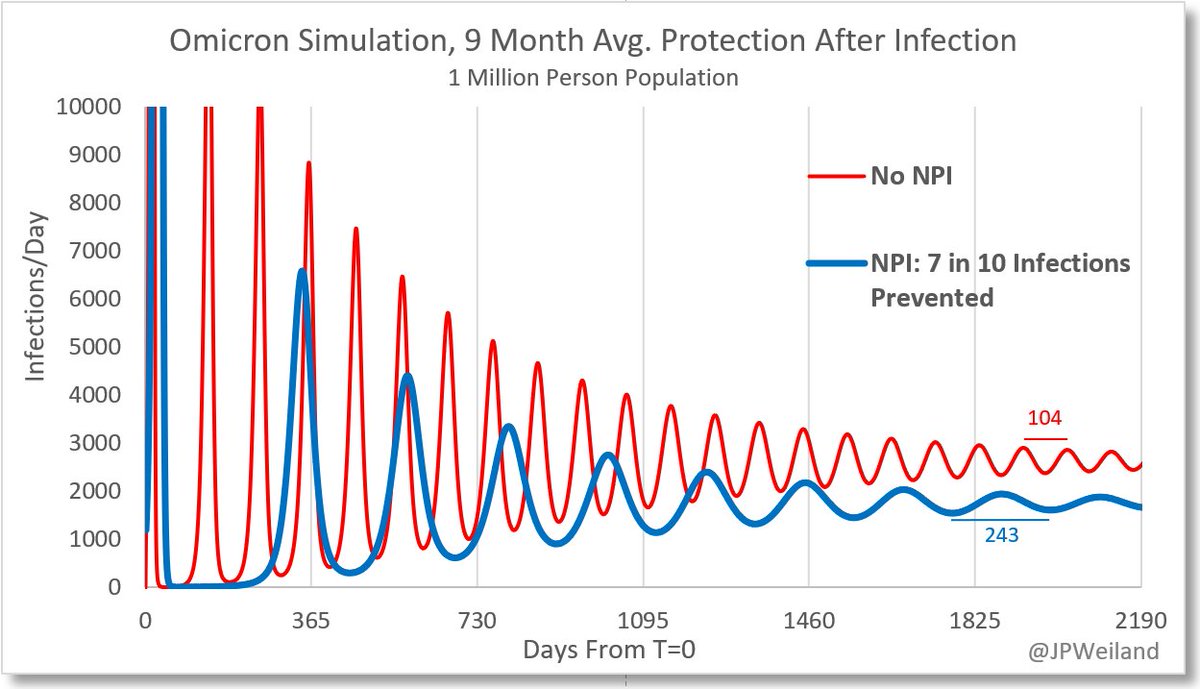
In fact, when Omicron did first show up, within a couple days I was sounding the alarm *loudly*, and within a week I was posting models of a million+/day infection spike. A completely unprecedented situation was about to happen.
✅️HUGE number of new mutations
✅️HUGE speed of takeover in genetic sequencing
✅️HUGE infection spike in first country
✅️HUGE drop in AB effectiveness compared to peers
None of those are true for the current new variants
• • •
Missing some Tweet in this thread? You can try to
force a refresh
Anticipating increases into August, driven by EG.5.1, FL.1.5, and XBB.1.16.6.
Each of these have advantage over XBB.1.16, XBB.2.3 etc.
The lack of cases for the last 4 months is expected to have increased the number of people susceptable to infection.
It also makes sense that the Northeast is seeing the biggest uptick on wastewater, considering their levels of the faster variants are higher than the rest of the US.
21 day seq data from @RajlabN dashboard
The common driver between these variants seems to be the F456L mutation on the spike. They also have various other escape mutations.
I made a simple Omicron simulation with the following assumptions: R0=8 and avg. protection after infection is 9 months. No seasonal effect etc.
Then I applied NPI that cut the chance of infection per interaction by 7 in 10.
Found the results really interesting! 1/
🔹️3 to 4 waves are expected per year with 0 NPI, even though about 1 infection/yr/capita
🔹️70% effective NPI reduces frequency of waves just less than 2 per year
🔹️But total infections over time were only reduced ~30%
🔹️All the waves started to dampen to flat over time 2/
I didn't anticipate the difference in wave frequencies, but I did expect that the total reduction would be much less than 70%. The pool of susceptibles grows high enough to still create sizable waves.suppressed.
3/
This data is preliminary (so a lot of uncertainty still), and there isn't a ton of sequencing data, but:
There appears to be a new variant related to XBB.1.9 called FL.1.5.1 that appears to be growing rather quickly in the Dominican Republic.
I haven't been interested in any new variant in a good while, but this one might stand out. It appears to have gone from first sequenced case to dominant in less than a month.
I'll be keeping an eye on it and update as needed. More sequencing could show this is just a blip
The reason I'm posting about it is the apparent rapid rise in proportion coincides with a sudden increase in cases in the DR, even with presumibly less testing. This is additional indication that this variant could be important.
It was obvious with Japan's waves last year that the variants spreading were not a threat to other nations.
It was also obvious in South Africa that the new variant there (Omicron) was a cause for global concern.
Listen, we might be out of the woods in terms of a Delta like severity strain reappearing. But we might not be. Early warning systems help hospitals prepare if we ever ran into that situation again
Sequencing is a huge tool for that, and those efforts are slowly evaporating
The rise of the XBB.1.16* along with XBB.1.9* and XBB.2.3* should halt the decline of caseloads start to creep them back up.
XBB.1.16* with a 31% weekly advantage over background
This is what we've seen play out with XBB.1.16*. From the same starting point, India was far, far more affected by this variant.
The US has seen a 17% weekly rise of XBB.1.16 vs ~100% weekly rise in India. And that compounds.
The cause for the dramatic differences lie in recent experience with similar variants. The US has seen enough waves of similar variants in the past to retard the growth.
This is precisely what I've been predicting since April. Now we have data that proves it.
I looked to verify the claims that NYC is having high community spread and found that it's an accidental misinterpretation of the WW data. The data comes from ONE WW service, who recently significantly increased sensitivity to their methodology.
ALL other data available shows relatively very low spread. Here are WW from NWSS (who kept consistent methodology), as well as hospitalizations in NYC specifically. All are still very low.
Has there been an uptick from a very low baseline? Maybe? Sort of hard to tell either way with any confidence. Another week or so of data will help deterimne if it's starting to increase again. Even if numbers have returned to April levels, April was still very low in NYC