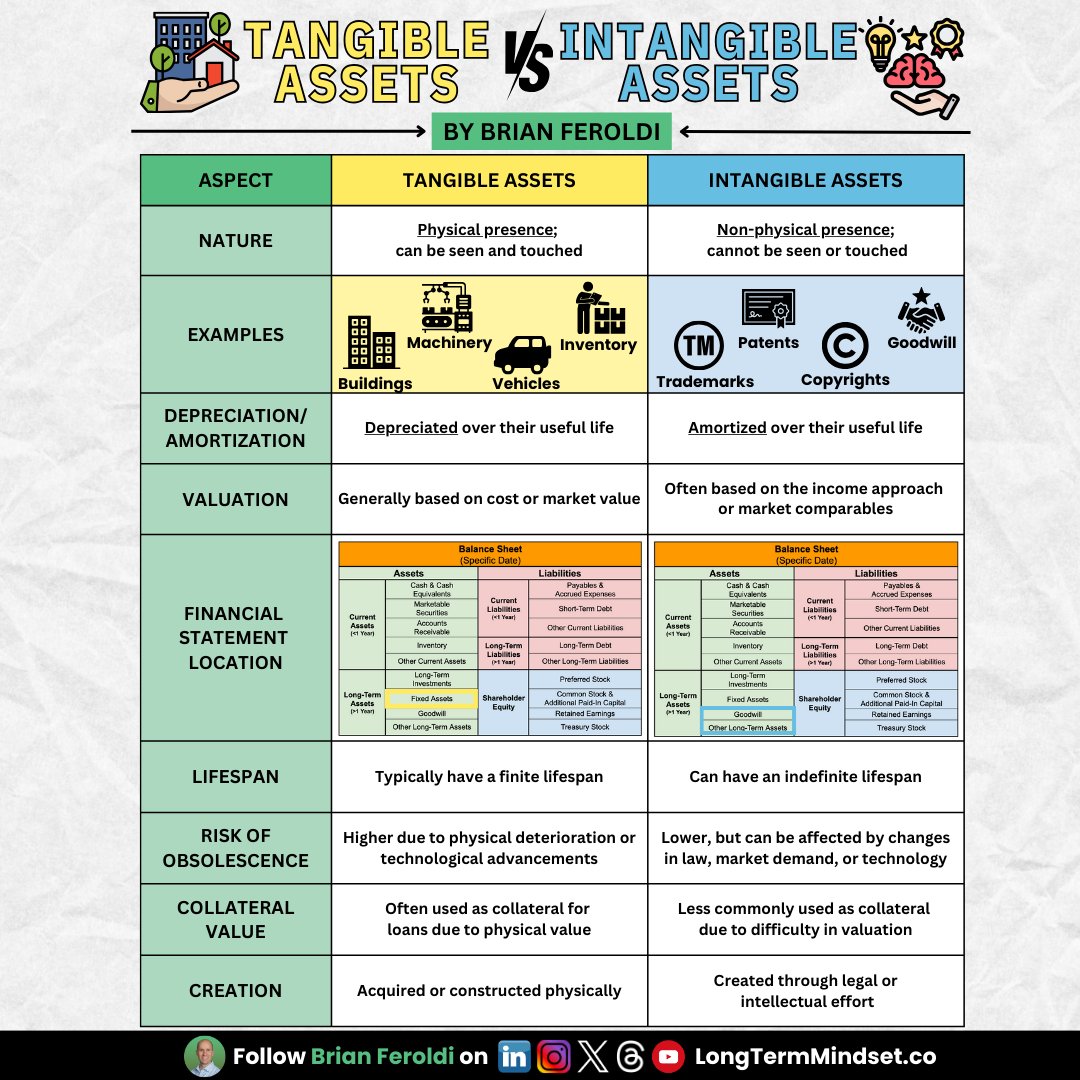
Peter Lynch LOVED the PEG ratio.
He popularized it in "One Up On Wall Street."
However, the PEG ratio actually SUCKS.
Here’s why:
He popularized it in "One Up On Wall Street."
However, the PEG ratio actually SUCKS.
Here’s why:

Assume you’re considering investing in one of three companies.
Which is the better buy?
Which is the better buy?

This is where the PEG ratio is useful.
PEG stands for “Price-to-Earnings-to-Growth”.
Divide the trailing P/E ratio by the estimated 5-year earnings growth rate.
The lower the number, the better.
The PEG makes it clear that Company ZYX is the best choice.
PEG stands for “Price-to-Earnings-to-Growth”.
Divide the trailing P/E ratio by the estimated 5-year earnings growth rate.
The lower the number, the better.
The PEG makes it clear that Company ZYX is the best choice.

Peter Lynch used the following guidelines for judging the PEG ratio.
~0.5 = Undervalued ✅
~1.0 = Fairly Valued 🟡
~2.0 = Overvalued ❌
~0.5 = Undervalued ✅
~1.0 = Fairly Valued 🟡
~2.0 = Overvalued ❌

Sounds great, right?
The PEG ratio certainly has some pros.
However, it also has a slew of cons:
The PEG ratio certainly has some pros.
However, it also has a slew of cons:

Consider the "E" - Earnings
Here are 8 reasons why reported earnings might be misleading:
1: Accrual accounting
2: Equity investments
3: Windfalls
4: Unsustainable trend
5: Disruption
6: Cyclical demand
7: Industry Dynamics
8: Business growth cycle
Here are 8 reasons why reported earnings might be misleading:
1: Accrual accounting
2: Equity investments
3: Windfalls
4: Unsustainable trend
5: Disruption
6: Cyclical demand
7: Industry Dynamics
8: Business growth cycle

Look at the PEG ratios for $AAPL, $MSFT, $GOOG, and $XOM from March 2023.
The PEG ratio made it seem like $XOM was a screaming buy:
The PEG ratio made it seem like $XOM was a screaming buy:
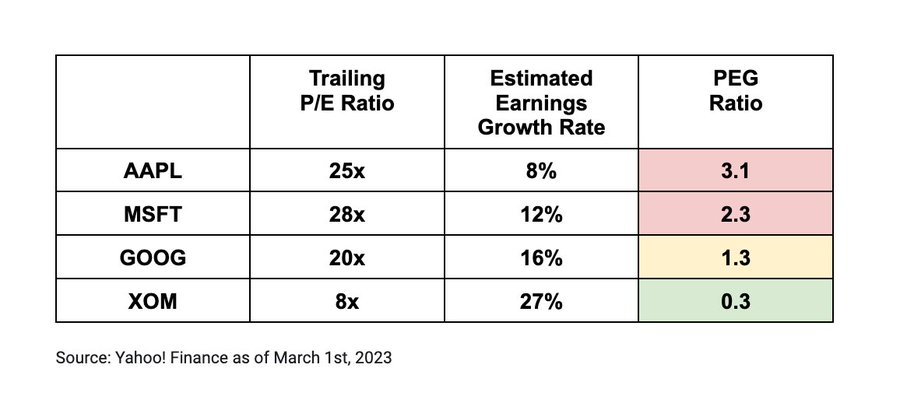
But, the PEG ratio ignores that $XOM’s earnings are HIGHLY cyclical.
When energy prices are high, profits soar.
When they fall, profits tank.
That makes its “Earnings” - and hence its PEG ratio - unreliable.
When energy prices are high, profits soar.
When they fall, profits tank.
That makes its “Earnings” - and hence its PEG ratio - unreliable.

The PEG ratio only works when a company is:
1) Growing
2) Optimized for normalized earnings
That’s a sweet spot that only exists between phases 4 & 5 of the business growth cycle.
That makes the PEG ratio useless when a business is in phases 1, 2, 3, or 6
1) Growing
2) Optimized for normalized earnings
That’s a sweet spot that only exists between phases 4 & 5 of the business growth cycle.
That makes the PEG ratio useless when a business is in phases 1, 2, 3, or 6

The growth rate is also troublesome.
What if the estimated 5-year growth rate is wrong? The PEG ratio will mislead you.
Analyst estimates tend to be overly optimistic (and are later revised downward)
What if the estimated 5-year growth rate is wrong? The PEG ratio will mislead you.
Analyst estimates tend to be overly optimistic (and are later revised downward)

To fix these issues, some investors use variations on the PEG ratio.
Here are some standard adjustments:
Here are some standard adjustments:

All valuation metrics have flaws.
What should investors do?
Learn to use a variety of valuation metrics and know when they are USEFUL and when they are USELESS.
Use this chart as a guide:
What should investors do?
Learn to use a variety of valuation metrics and know when they are USEFUL and when they are USELESS.
Use this chart as a guide:

If you invest, you MUST understand valuation.
Want help?
Join me in August for my cohort-based course - Valuation Explained Simply
Interested? DM me for a coupon code.
https://t.co/1Qte591VZBmaven.com/brian-feroldi/…
Want help?
Join me in August for my cohort-based course - Valuation Explained Simply
Interested? DM me for a coupon code.
https://t.co/1Qte591VZBmaven.com/brian-feroldi/…

If you enjoyed this thread, follow me @BrianFeroldi.
I demystify the stock market.
The biggest compliment I can get is to share this thread with your followers.
To do so, ♻️ retweet the first tweet below:
I demystify the stock market.
The biggest compliment I can get is to share this thread with your followers.
To do so, ♻️ retweet the first tweet below:
https://twitter.com/61558281/status/1683445065123807233
Want to keep learning?
Read this other thread I wrote next:
Read this other thread I wrote next:
https://twitter.com/BrianFeroldi/status/1675474398206205953?s=20
• • •
Missing some Tweet in this thread? You can try to
force a refresh