Ryan Maue Profile picture
Jul 25 4 tweets 2 min read Twitter logo Read on Twitter
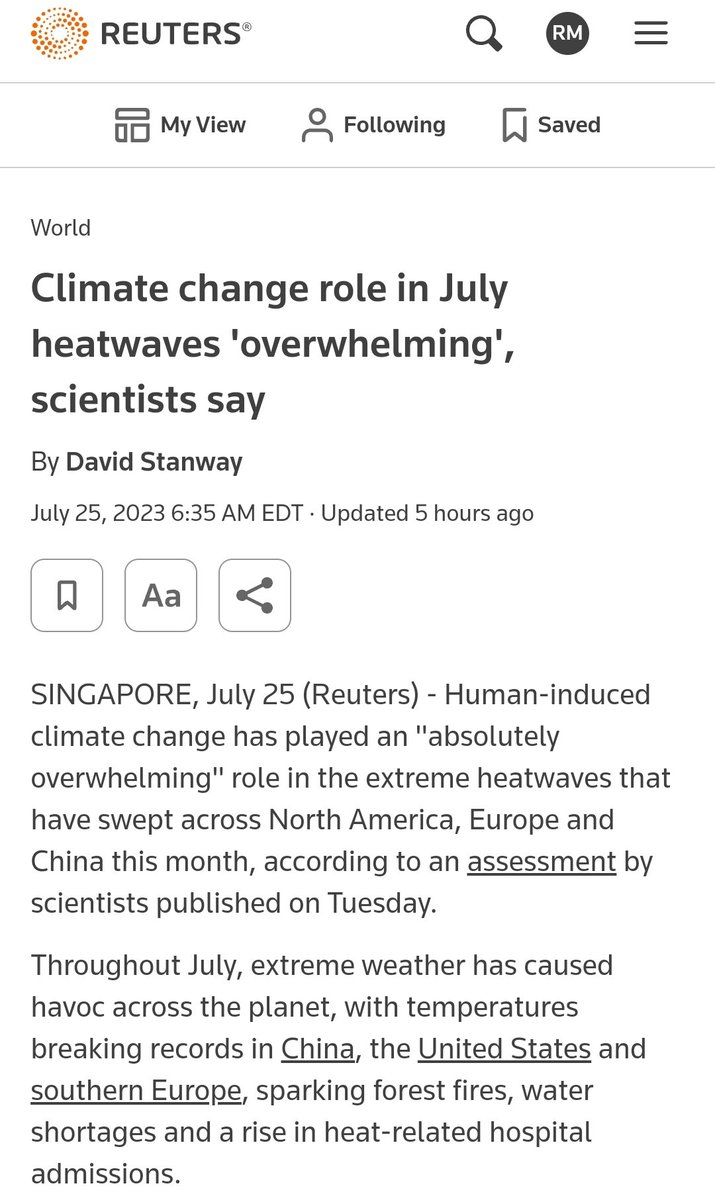
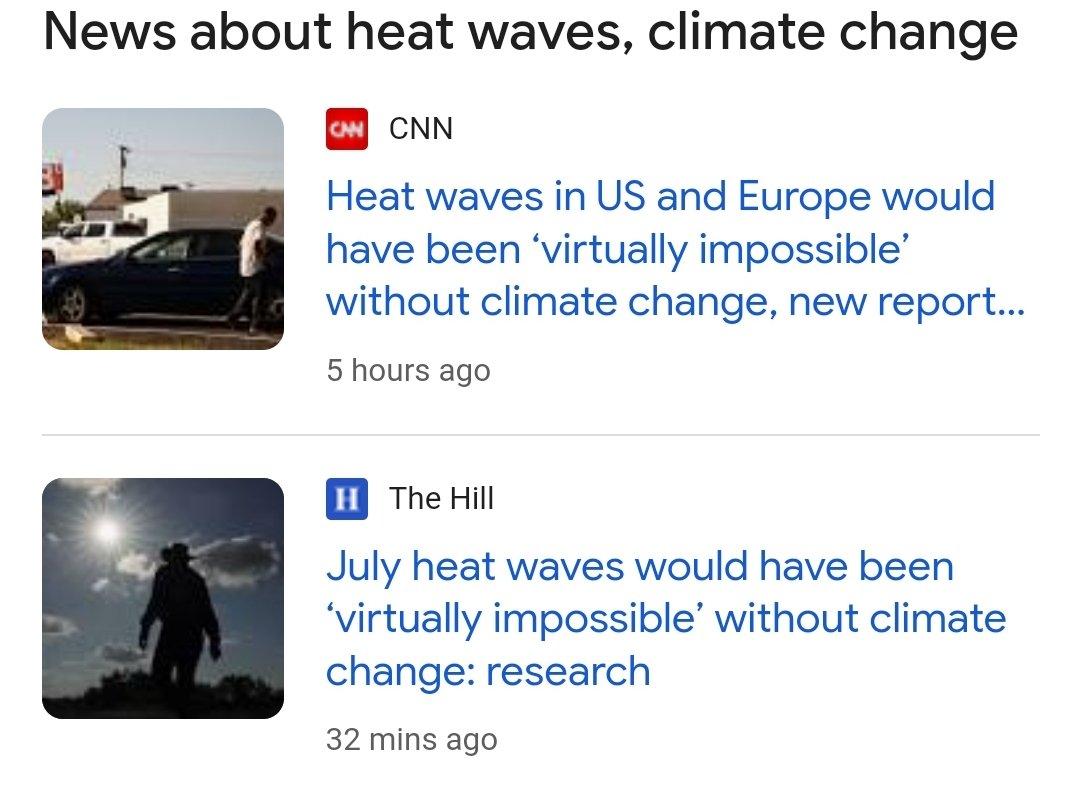
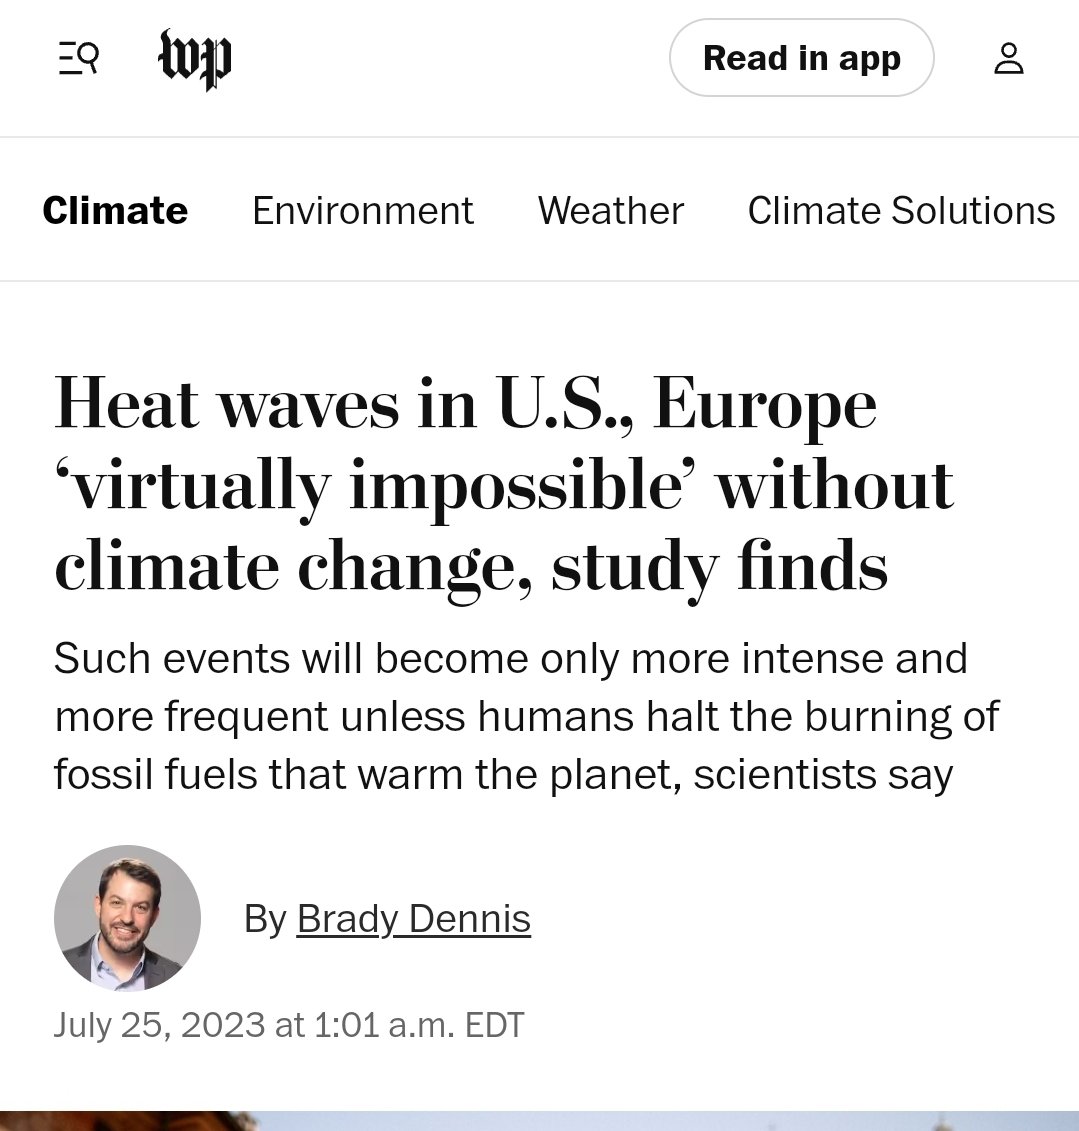
Without climate change, July's summer heat in the U.S. Southwest would have been "virtually impossible."

I guess that's true if you memory hole 1925, 1930s, 1950s, 1980, 1985, 1990, 1995, 2012, 2020, etc. and the rest of the almanac.

https://t.co/pWMfpw4gf0washingtonpost.com/climate-enviro…
Image
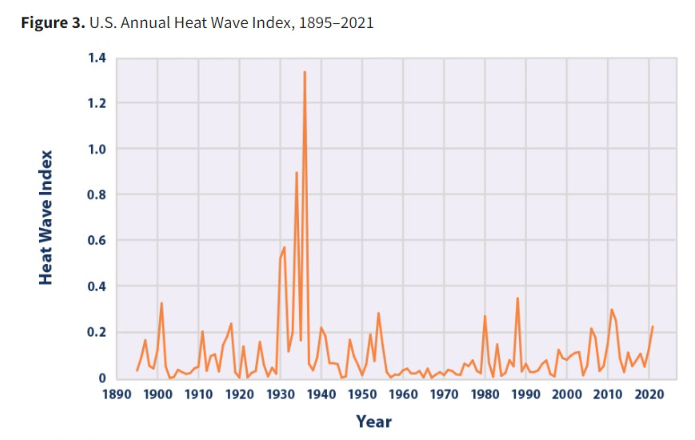
The Dust Bowl of the 1930s and 1980 stand out as so exceptionally hot, many decades ago, that no one would say without laughing that the recent July in Texas was unprecedented.

I guess politicizing the weather means we have to suspend disbelief and erase the past.

"The past… twitter.com/i/web/status/1…
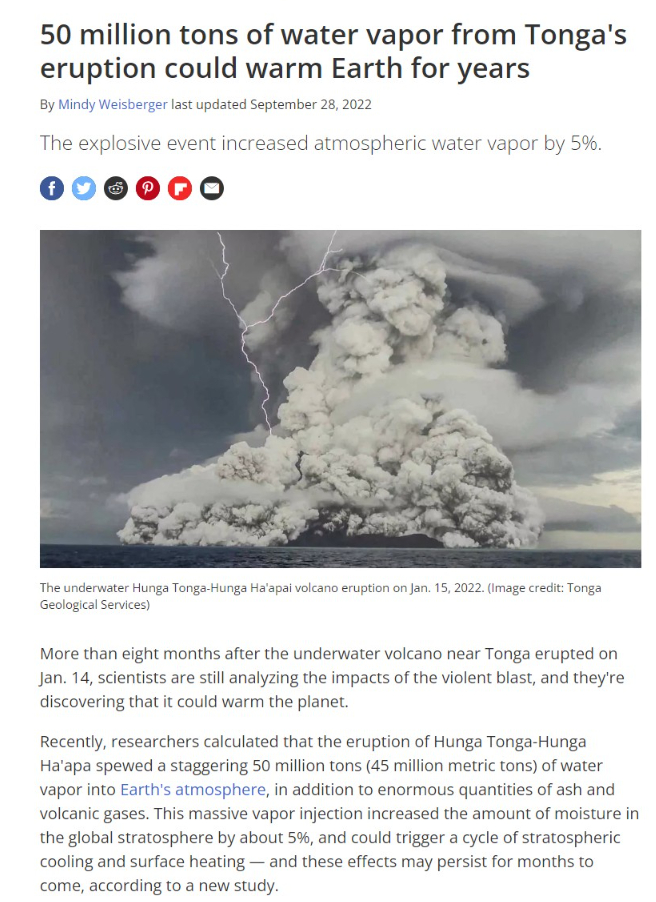
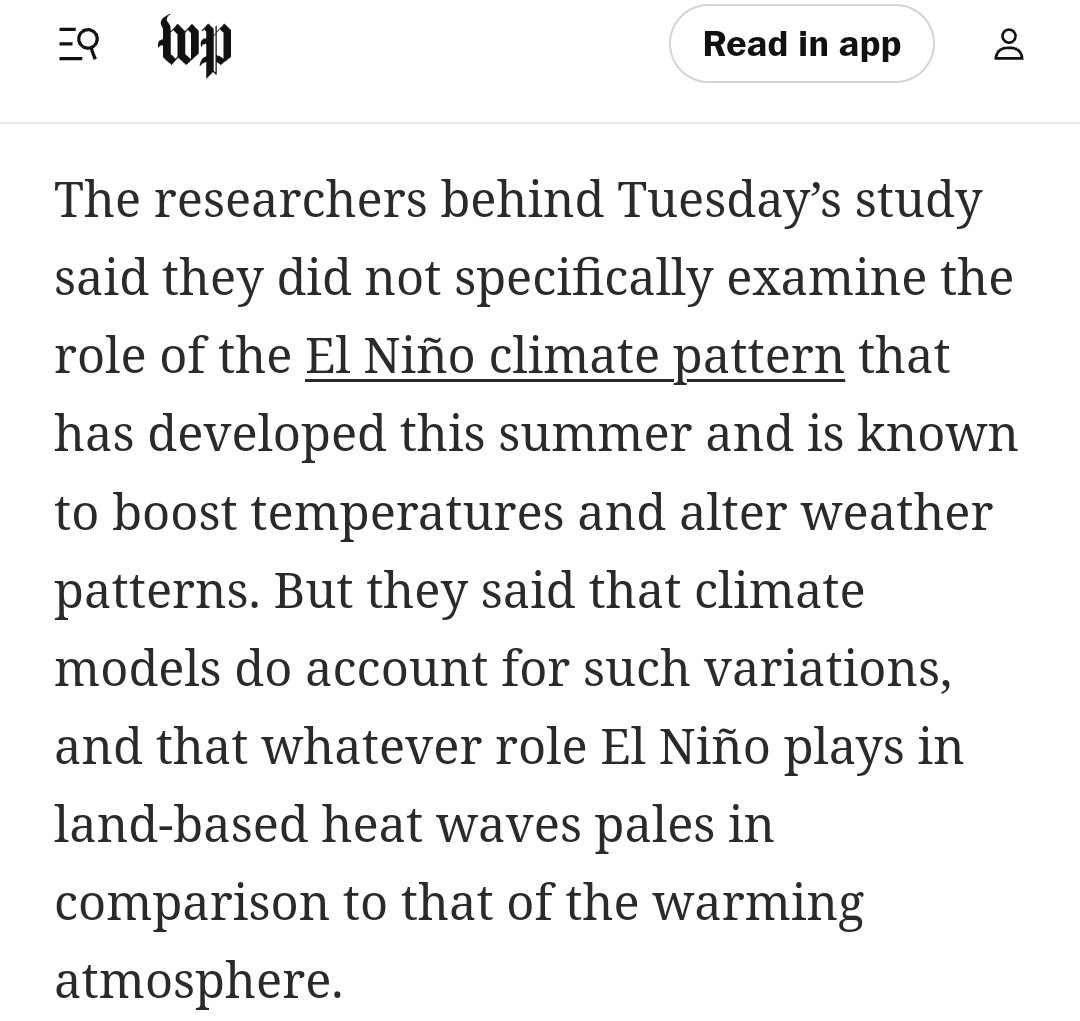
The climate researchers did not examine the effects of El Niño but they are sure it doesn't matter.

Also, the research was not peer reviewed because it needed to be publicized so quickly. Image
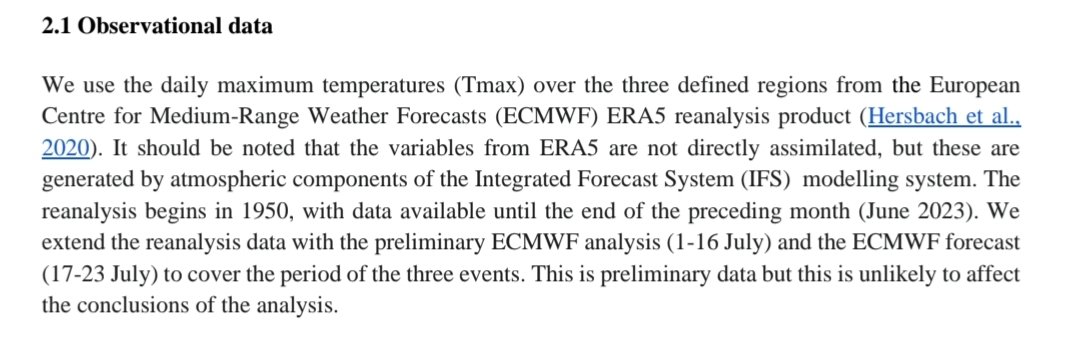
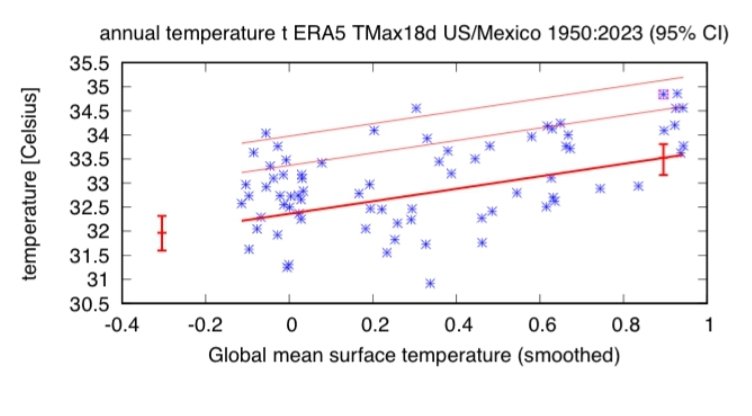
Oh, the climate scientists performed their analysis with data starting in 1950. 👀

The first half of the 20th century was not considered, so 1930s Dust Bowl was not included. 📈🌡

No mega El Niño of 1877-78.

Do you think this affects the "virtually impossible" conclusion?
Image
Image

• • •

Missing some Tweet in this thread? You can try to force a refresh
 

Keep Current with Ryan Maue

Ryan Maue Profile picture

Stay in touch and get notified when new unrolls are available from this author!

Read all threads

This Thread may be Removed Anytime!

PDF

Twitter may remove this content at anytime! Save it as PDF for later use!

Try unrolling a thread yourself!

how to unroll video
  1. Follow @ThreadReaderApp to mention us!

  2. From a Twitter thread mention us with a keyword "unroll"
@threadreaderapp unroll

Practice here first or read more on our help page!

More from @RyanMaue

Jul 25
Climate change caused the heat waves in the U.S. and Europe.

"Virtually impossible"

Are you buying this? How do you know this research isn't "specifically tailored" to achieve a predetermined conclusion?

Is the uncritical media coverage gaslighting?


Image
Image
Image
Image
Don't expect any capable scientists to bother reviewing this "super-rapid" climate attribution research article.

You're not allowed to critique the arbitrary methods, conclusions, or financial and political motivations of the authors.

So, best to treat this like 'Proximal… twitter.com/i/web/status/1…
A critical reviewer would look at the definition of the "event" and wonder what's going on.

Event: Annual maxima of average of string of days

3 distinct definitions "specifically tailored" to respective regions

USA/Mexico: 18 days
Southern Europe: 7 days
China: 14 days… https://t.co/Kjajt0vex5twitter.com/i/web/status/1…
Image
Read 4 tweets
Jul 22
Volcanic estimate 🌋📈

Initial scientific estimates were 50-million metric tons of water injected into the stratosphere by Hunga Tonga-Hunga Ha'apai submarine volcano.

Likely off by a factor of 3.

New research suggests 150-million metric tons or almost 40 Trillion gallons of… https://t.co/BEnfFL2bErtwitter.com/i/web/status/1…


Image
Image
Image
The 40 Trillion gallons of water vapor in the stratosphere represents an unprecedented amount injected in the stratosphere.

Volcanic eruptions like Pinatubo blast SO2 into the stratosphere creating a cooling climate shroud for 1-2 years.

But, Hunga Tonga had only 2% of the… https://t.co/UWx5CPIBVetwitter.com/i/web/status/1…
Global warming caused by Hunga-Tonga is significant.

The eruption of Hunga-Tonga increased the water vapor mass in the stratosphere by 13%, and it will remain there for many years to come.

"The unique nature and magnitude of the global stratospheric perturbation by the Hunga… https://t.co/dxRr2ybSU3twitter.com/i/web/status/1…

Image
Image
Read 4 tweets
Jul 18
Guardian recently wrote an "analysis" piece about "turbo-charged" heat waves in the United States based upon these EPA climate indicators charts.

Good example of "malinformation" or cherry-picking helpful data, here in the U.S. stopped at 1960, and then ignoring the final key… https://t.co/HIeUk6vNEntwitter.com/i/web/status/1…


Image
Image
Image
Note, there is every indication that longer, more frequent, and intense heat waves may be occurring and are expected to occur in the future.

However, when using past data to buttress your argument, it's best to use appropriate data sources, and have a more detailed knowledge… twitter.com/i/web/status/1…
EPA does not provide the underlying data for the calculation of the Heat Wave Indicators, instead it comes from NOAA and an individual scientist. It should be reverse engineered, and updated in real-time.

NYC, Washington D.C. and Houston aren't included b/c they don't meet the… https://t.co/tID5DZHJkEtwitter.com/i/web/status/1…
Image
Read 4 tweets
Jul 16
The weather station in China reporting 52.2°C is relatively new, last few years (?)

Same with all-time cold record in January for the country.

While the observations may be certified accurate, they have no historical lineage, the period of record isn't back to 1951, or… twitter.com/i/web/status/1…
⚠️Should you wonder why the national cold and hot records are set within 7 months of each other in China?

Yes, that's what happens with short period weather station records sited in notoriously hot or cold places that previously had no direct records. 🌡
The analogy is that a weather station pops up in Death Valley for the first time in 2015 and sets the national heat record by 5°F.

You'd clearly notice that we were not previously measuring the hottest place in the U.S.
Read 4 tweets
Jun 28
This complete nonsense:

‘Never occurred before’: How the Arctic is sizzling Texas

The Arctic is not responsible for the "heat dome" over Mexico and Texas. This whole article is another lame attempt at propping up one climate scientist's backwards theory that the Arctic… https://t.co/wZveL2sTsitwitter.com/i/web/status/1…
No evidence provided that Arctic is forcing the tropics -- just believe me. Seriously.

“The exact connections between rapid Arctic warming and the jet stream are still incompletely understood, but I think it’s safe to say that no one believes the Arctic can warm four times… twitter.com/i/web/status/1…
10-years ago, the theory was "debunked" but it returns like a zombie. The so-called evidence or signal even changed signs in the past 10-years!

Francis begins by questioning the motivation of Elizabeth Barnes, the author of the study which claims the link between Arctic… twitter.com/i/web/status/1…
Read 7 tweets
Jun 12
Comparison in North Atlantic ocean surface temperatures between 2022 and 2023 for June 10th. The differences might be a little hard to see at first, but the tropical latitudes are significantly warmer (more red), and the NE Atlantic off UK is more blue than purple. ImageImage
The charts being shared by the millions are "anomaly" or deviations from previous 30-years, and very scary looking w/o context.

However, the North Atlantic seasonal cycle from Spring --> Summer means ocean temperatures will generally warm every day until late-August.

We are… twitter.com/i/web/status/1… Image
The proximate cause of the abnormal month-ahead warming is the weather patterns above the ocean, including wind forcing, cloud cover and radiation budget, as well as dust and precipitation.

The Eastern Atlantic is particularly warm due to persistent and strong series of troughs… twitter.com/i/web/status/1… ImageImage
Read 5 tweets

Did Thread Reader help you today?

Support us! We are indie developers!


This site is made by just two indie developers on a laptop doing marketing, support and development! Read more about the story.

Become a Premium Member ($3/month or $30/year) and get exclusive features!

Become Premium

Don't want to be a Premium member but still want to support us?

Make a small donation by buying us coffee ($5) or help with server cost ($10)

Donate via Paypal

Or Donate anonymously using crypto!

Ethereum

0xfe58350B80634f60Fa6Dc149a72b4DFbc17D341E copy

Bitcoin

3ATGMxNzCUFzxpMCHL5sWSt4DVtS8UqXpi copy

Thank you for your support!

Follow Us on Twitter!

:(