Market makers can't see your stop loss orders, but they and everyone else can see your resting limit orders.
Traders use a depth graph to visualize this data, with different colors representing various order sizes.
In this thread, I'll show you how to set one up.🧵👇
Traders use a depth graph to visualize this data, with different colors representing various order sizes.
In this thread, I'll show you how to set one up.🧵👇
Before beginning, it’s key to have two things for Sierra Chart ready:
- Service package that supports this study, such as #11
- Activated depth of market data
Link:
https://t.co/1ZiSojaP8Dsierrachart.com/index.php?page…
- Service package that supports this study, such as #11
- Activated depth of market data
Link:
https://t.co/1ZiSojaP8Dsierrachart.com/index.php?page…
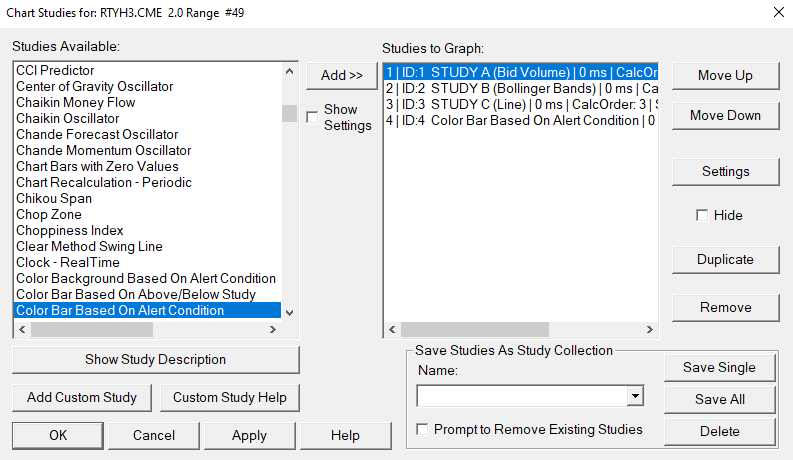
- Open a new chart in Sierra Chart
- Add the Market Depth Historical Graph study
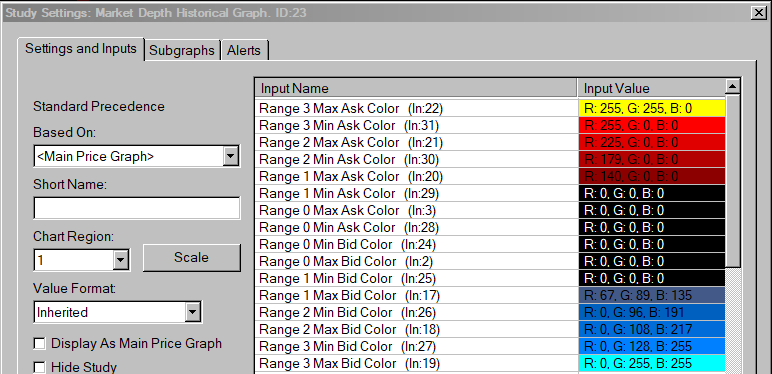
- Click to select it, then hit Settings
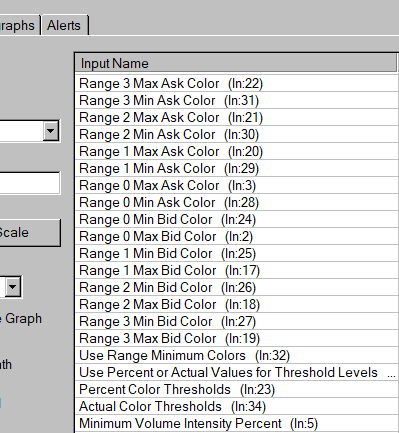
First is colors. Separately colored are Bids and Offers, then there are thresholds for that coloring. Typically, Range 0-1 = Small lots, 2 & 3 for bigger.
- Add the Market Depth Historical Graph study
- Click to select it, then hit Settings
First is colors. Separately colored are Bids and Offers, then there are thresholds for that coloring. Typically, Range 0-1 = Small lots, 2 & 3 for bigger.

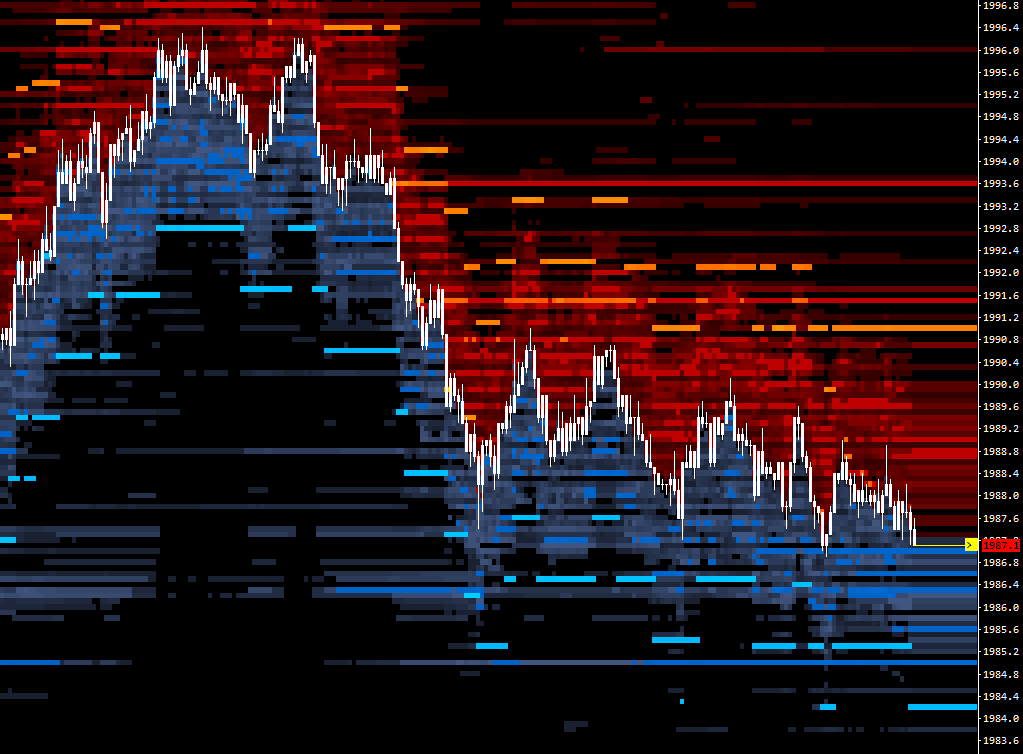
Can get creative with colors. Common themes:
- Bookmap® style: Blue, yellow, orange
- Grey vista: Grey and white
- TYP style: Blue bids, Red offers
These are on the Basic Colors pallet, nothing unique:
- Bookmap® style: Blue, yellow, orange
- Grey vista: Grey and white
- TYP style: Blue bids, Red offers
These are on the Basic Colors pallet, nothing unique:
My preferred settings:
Use Range Minimum Colors: Yes
Use Percent or Actual Values… : Actual Value
Actual Color Thresholds: Small, medium, large (ex: 90,149,300)
Extend Last Known Depth: Yes
Show Quantity Numbers: None
Max Levels to Display: 0 (or try 20)
- Then press OK
Use Range Minimum Colors: Yes
Use Percent or Actual Values… : Actual Value
Actual Color Thresholds: Small, medium, large (ex: 90,149,300)
Extend Last Known Depth: Yes
Show Quantity Numbers: None
Max Levels to Display: 0 (or try 20)
- Then press OK
Notes and Ideas:
- Try out only showing bigger lots, ignoring small lots
- Avoid too many copies of this study in an instance
- Adjust the Scale Settings as needed
- Ensure the Chart Update Interval is low
- Bid Ask lines instead of candlesticks
- Volume dots
- Try out only showing bigger lots, ignoring small lots
- Avoid too many copies of this study in an instance
- Adjust the Scale Settings as needed
- Ensure the Chart Update Interval is low
- Bid Ask lines instead of candlesticks
- Volume dots
That’s it. Super simple to set it all up.
I include a few more detailed examples including screenshots of settings and a chart for depth graphs in my Sierra Chart handbook. It contains that and many more guides for beginner to intermediate users: 👇
ziiiggy.com/sierra-chart-h…
I include a few more detailed examples including screenshots of settings and a chart for depth graphs in my Sierra Chart handbook. It contains that and many more guides for beginner to intermediate users: 👇
ziiiggy.com/sierra-chart-h…
• • •
Missing some Tweet in this thread? You can try to
force a refresh