Ziggy Profile picture
Developing Trader | Charts | Guides | Notion Templates | Created the Sierra Chart Handbook: https://t.co/Ham7ZFSKRP
Apr 14 β€’ 9 tweets β€’ 4 min read
So you have a systematic idea you want to back test or forward test using automation, but have no idea where to start.
In this thread, I'll walk through the exact steps to loosely test these ideas. 🧡 Image What's covered:
- Basic autotrader setup
- Add a signal, Long only, on bar close
- Run the test
- Review results

None of this is advice, this is purely entertainment. Written for intermediate+ users, not beginners. Past results not indicative of future results. For testing only.
Aug 13, 2024 β€’ 10 tweets β€’ 3 min read
Running a more complex trading workspace?

Even if my charting needs are demanding one way I’m ensuring ultra high performance is splitting the processing load across copies or instances of Sierra Chart.

Sharing exactly how I do it in the thread below 🧡 Image In this thread:
- The what and why behind multiple instances or copies
- Setting up multiple instances or copies

Perform backups before starting, read documentation, and know this is entertainment and educational, don’t blindly trust my posts.
Apr 23, 2024 β€’ 12 tweets β€’ 4 min read
Many traders don’t know that US Stocks can be charted and traded using Sierra Chart.

From blue chip to penny stocks, leverage a world-class platform across multiple assets.

In this thread I’ll walk through the basic steps to setup an IBKR + Sierra Chart connection. Image This thread will be covering:
- Setup IBKR settings
- Setup Sierra Chart settings
- Setup Data feed
- Create a chart and route an order
Apr 16, 2024 β€’ 14 tweets β€’ 3 min read
After watching hundreds of traders come and go from this business, there are some patterns and commonalities I noticed.

In this thread I'd like to share some of the most common things I noticed about newer traders, and their final moments before quitting the game. 🧡 Firstly, this is coming from a developing trader and not a whale, not a performance coach, and not the head of any prop firm.

Even without the professional experience, I’ve picked up quite a lot when it comes to other traders and my own behaviors.
Sep 21, 2023 β€’ 5 tweets β€’ 2 min read
Every trader who uses Sierra Chart needs know about all of these features and studies within this thread.

I'll go over some of my top findings I've encountered while on my journey, and hopefully you find them valuable as well. 🧡 Image First up is the Write Bar and Study Data to File study. This study will write data to a text file, which can easily be used by other applications such as Excel.

I create a file named EXPORT_1.txt in my Data folder, then set the output to match that name. Really useful study.
Image
Image
Jul 28, 2023 β€’ 7 tweets β€’ 3 min read
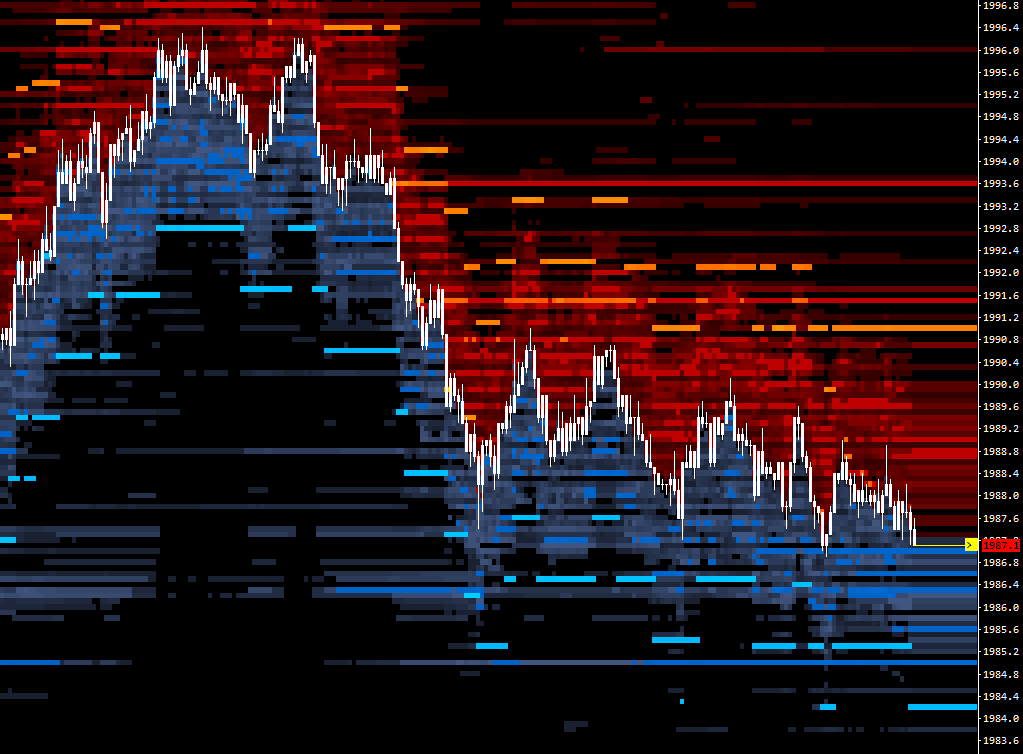
Market makers can't see your stop loss orders, but they and everyone else can see your resting limit orders.

Traders use a depth graph to visualize this data, with different colors representing various order sizes.

In this thread, I'll show you how to set one up.πŸ§΅πŸ‘‡ Image Before beginning, it’s key to have two things for Sierra Chart ready:

- Service package that supports this study, such as #11
- Activated depth of market data

Link:
https://t.co/1ZiSojaP8Dsierrachart.com/index.php?page…
May 8, 2023 β€’ 9 tweets β€’ 5 min read
Sometimes as traders we make costly technical errors because of our order configuration.

In many cases this is related to OCO orders and scaling in/out.

In this thread I will share how I setup my order entry in Sierra Chart in a way that I never make those errors anymore.πŸ§΅πŸ‘‡ Image First off, do not consider any of this advice. I don’t know anything, I’m not an expert. This is entertainment. Never rely on these changes with real capital. Always test in simulation. Trading is highly risky.
Apr 4, 2023 β€’ 9 tweets β€’ 5 min read
I asked GPT for help developing an app. After many hours of trial and error, I found a method that can handle developing a simple Python app.

I'm going to share exactly how I prompt GPT to assist in building an app that I use within my trading in the thread below πŸ§΅πŸ‘‡ This is a novice sharing a method that worked for me. I am not an expert, I am not a pro developer.
These methods are likely to be outdated soon, and may already have more effective alternatives. This is for entertainment.

I welcome suggestions and feedback.
Mar 9, 2023 β€’ 14 tweets β€’ 4 min read
Here is a master thread that includes posts and threads for Sierra Chart users.

I share mini-guides on DOM, data exports, TPO, performance, alerts, tools, visuals, and more.

Bookmark this thread! I'll keep adding to it. πŸ§΅πŸ‘‡ Image Remember, none of this is financial advice and purely entertainment and education.

For more detailed and complete guides check out the unofficial Sierra Chart handbook I created for Sierra Chart users:

ziiiggy.com/sierra-chart-h…
Jan 26, 2023 β€’ 9 tweets β€’ 3 min read
I'll bet you a pickle that at least 1 of these tips will improve your Sierra Chart experience.

Let's get Sierra Chart running faster and smoother, and get the most out of this powerful software.

Thread πŸ§΅πŸ‘‡ Image Lower days loaded for every chart. If you don't need the 30 days of data, don't load it. Go through every chart, and change the days loaded to the smallest value.

- Open a chart
- Chart > Chart Settings > Data Limiting
- Days to Load for Intraday..... : 5

/2 Image
Jan 10, 2023 β€’ 7 tweets β€’ 4 min read
We all know about simple price level alerts, but what about more of the advanced study or indicator based alerts?

For example, using IF THEN, AND, and OR statements.

In this thread I'm going over simple steps to set condition based alerts in Sierra Chart + color a bar.

πŸ§΅πŸ‘‡ Image End goal: Color bar and Alert me when study A goes above study B, and is also above study C.

Legend:

Study A: Data point (delta, volume, other)
Study B: Volatility study (BB band, STDEV, other)
Study C: Fixed value

- Open Sierra and open a brand new chart

/2
Jan 5, 2023 β€’ 13 tweets β€’ 6 min read
You might spend hours tinkering with your TPO chart to get it looking right. Instead, you could spend a few minutes following this guide.

In this thread I'm going to through each step to transform a default TPO. 🧡

Check the before and after, then scroll down for the how-to: ImageImage When I refer to the Title Bar, I'm speaking about the menu list located along the top of the Sierra Chart window. File, Edit, Chart... etc.

Ensure that Service Package 5 or higher is activated, and that Sierra Chart is open and connected to a data feed.

/2 Image
Dec 28, 2022 β€’ 9 tweets β€’ 4 min read
Easily automate bar and study data exports to Excel for statistical analysis and backtesting using Sierra Chart.

No more repetitive and mindless manual exports.

In this thread, I'll walk through each step in a way that even a beginner can set this up. πŸ§΅πŸ‘‡ In this thread:
- Setup charts for export
- Setup files for storing data
- Setup Excel for import

Required:
- Excel
- Sierra Chart
- Notepad

What's happening: Both the bar (OHLC) and study data is automatically sent to Excel from Sierra Chart charts for later use.

/2
Dec 27, 2022 β€’ 6 tweets β€’ 3 min read
The ultimate Sierra Chart handbook is LIVE. Instant lifetime web access to this comprehensive handbook filled with guides, chart templates, and tutorials.

This is everything I wish I had on day 1. This would have saved me hundreds of hours of grinding πŸ‘‡

ziiiggy.memberspace.com/member/plans/5… Some of the modules include:
- Getting started
- Studies guide
- Charting guide
- Trading & Execution
- Backtesting
- Technical & Visuals
- Performance
- More

/2
Dec 9, 2022 β€’ 11 tweets β€’ 5 min read
Here's a powerful back test tutorial. The goal is to back test trades that were actually taken live/sim and analyze what different outcomes would look like with various stop losses and targets.

I'll walk through each step. The results can be easily exported.

A thread πŸ§΅πŸ‘‡ The plan:
- Export real trades from account
- Prepare the data for backtest
- Configure and begin backtest
- Analyze and export results

Note: This method is for Sierra Chart users. Video tutorial linked further below.

/2
Nov 29, 2022 β€’ 16 tweets β€’ 7 min read
Time to analyze some historical trade data which can be used for dashboards, apps, and general analysis.

From beginning to end I'll walk through how to perform basic analysis and visualize the data in a histogram.

This will be done in Jupyter using Python.

A thread πŸ§΅πŸ‘‡ Firstly this is for educational purposes, trading is risky, I'm not an expert, and not a Python expert. I'm a student role, sharing what I know.

Thread breakdown:
- Get setup to analyze data
- Analyze and visualize data
- Ideas for results

/2
Nov 22, 2022 β€’ 9 tweets β€’ 5 min read
I've had many traders inquire about tools I'm using for the business-side of what I'm doing.

This #tooltuesday will be focused around the tools and apps I'm using behind the scenes. πŸ§΅πŸ‘‡

/1 Image If you haven't seen any of my other trading-related Tool Tuesday threads, here is the mega-thread:


Keep in mind today's thread is around the back-end business side of things and not just the trading.

/2
Nov 8, 2022 β€’ 10 tweets β€’ 4 min read
Tool Tuesday - Sierra Chart edition.

Sharing both hidden gems and in-demand studies and tools.

Short Thread πŸ§΅πŸ‘‡

Starting with anchored VWAP:

- Studies > Add custom Study > User Contr.. > ECIVwapV1.5
- Right click any chart > Anchor VWAP

/1 Auto data to file:

- Studies > Write Bar and Study Data to File
- Study Settings
- Path and File Name (anything) "EXPORT-1"
- Create a blank CSV text file in the USER/SierraChart/Data folder with the same name "EXPORT-1"

Now, data refreshes into the CSV file.

/2
Sep 20, 2022 β€’ 9 tweets β€’ 3 min read
1/ I've gathered a list of my threads containing dozens of productive and useful tools that traders use.

Data, screening, charting, journaling, and more.

This is a mega-thread containing other #ToolTuesday threads I've made, and I'll continue to add new threads here.

πŸ§΅πŸ‘‡ 2/

- Build databases
- Dashboard for data
- Custom twitter feeds

Sep 6, 2022 β€’ 10 tweets β€’ 6 min read
1) Tool Tuesday - Some tools others have built I'd like to share that are geared towards traders.

Short thread πŸ§΅πŸ‘‡

1st is @bookmap_pro. The depth charts are top tier but 1 feature I want to highlight is Multibook. Resting liquidity from multiple exchanges are shown on 1 chart Image 2) Pandas for dataframes. Most basic stats, RTD, APIs I've run on trading data has been done in Excel. While I still use it I'm finding myself use Pandas more.

This is a Jupyter notebook in VS Code. I call for FTX market data, filter what I need, use data, and it's free.

#FTX ImageImage