The huge "hedge fund short" 101
Many have published a chart that say "hedge funds have the largest speculative short futures position in history". The data is accurate. It also needs interpretation.
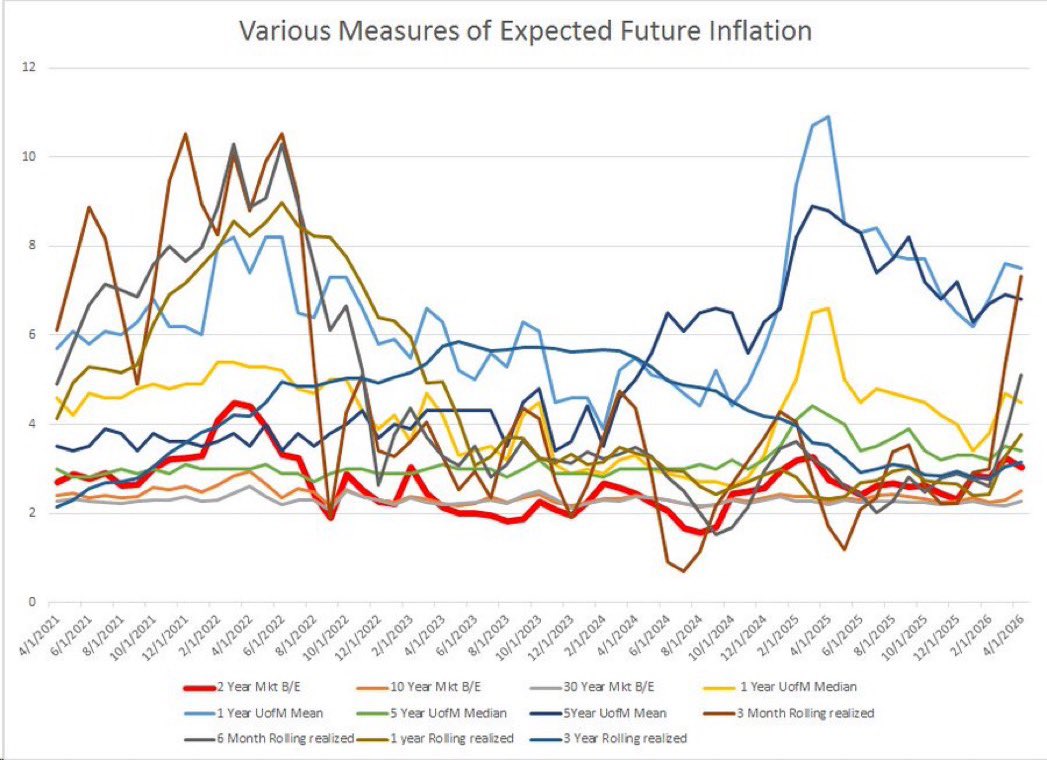
Here's my chart it's a few weeks old but illustrates my point
The hedge fund short is someone else's long. That long is institutional investors. It's very big. But that is not the important story. This unlike the ES charts which looked the same and were a choose your fighter Long Only Simps vs Hedge funds (which I got completely wrong)
Respect Long only Simps 🫡
Hedge funds short ES covered like mad. I was wrong.
But fixed income futures positions are quite different. While the long side of the positions are indeed levering up by long only asset managers the short side which is getting so much doomism is more complex
H/T @leadlagreport for this example
Why do hedge funds short bond futures
Speculation IS a real thing!
BUT also to hedge out interest rate risk on something they are long in the derivatives or cash market like:
Corporate and High Yield Bonds, Physical Treasury Bonds, Mortgage Bonds, Muni's, Converts, EM debt etc
For example let's say long only institutions bid up futures to lever up a bet. A hedge fund can buy the correspond US Treasury to that futures contract and take out a spread between the futures and cash markets. It's an arbitrage between the cost of leverage in the futures
Markets and the actual cost of leverage the hedge fund is able to achieve in their funding of the UST long position.
Now. It's possible that the hedge fund is purely speculative or it's possible that they own the bond and are using repo to finance the long and are short the
Futures. Let's go to the data. As this "historic" futures short has been built. Levered long positions have grown by half a Trillion dollars. Either that should be added to the long position of real money
Or should be subtracted from the short position of hedge funds who are doing the cash and carry arbitrage. I won't show all my data but just say that this is a complex topic and the signal in Fixed Income is pretty weak regarding TFF rates data the doomers are posting
• • •
Missing some Tweet in this thread? You can try to
force a refresh
I've been studying various versions of balance sheet expansions over my career. I'd classify them as
Japanese first failed effort
UK's version
U.S. Version 1
U.S. version 2
ECB version
Japanese all in version 2
They are all fairly different in approach. The big takeaway 🧵
The developing Fed version that most are excited about is most akin to the Japanese first failed effort.
Here's a rough summary of each
In 2001-2006 Japan the BOJ initiated QE. In their version they offered significant lending to the Japanese banking system for good collateral
The balance sheet doubled in size at a pace of 35 Tn yen per year. However of that 35tn only 5 was direct asset purchase and most of that was Japanese Tbills. This is very similar to the BTFP program from SVB time and the current SRF. It was also sorta similar to ECB LTRO
Why do repo rates change and what do they have to do with reserves. This is a super technical issue and there are better folks to follow on this topic than me but I'll give it a go.
Firstly what are the two sides of a repo transaction and why do they want to interact.
One side is a guy with a bank deposit he wants to earn interest on. The other is a guy who wants to borrow money overnight and has assets he owns that he is willing to provide as collateral to the loan. We can go down a level on each side but for now let's keep it simple.
Most repo transactions are done with UST as the collateral and most UST collatarel used is TBills but. UST's are also highly common collateral but do to the marked to market risk they offer less borrowing capacity per unit of notional (higher haircut)
Some thoughts on 10 year notes since Powell guided for a restart of the cutting cycle at Jackson Hole. Trying to answer what the bond market is saying
Nominal yields have fallen 33bp
Note yields are driven lower by
1)Falling real GDP expectations
2)Falling Inflation expectations 3) Falling "risk" of owning assets 4) Improving supply/demand balance vs expectations.
In attributing nominal yield changes to these 4 things unfortunately market prices don't
Easily demonstrate these things. For instance 3&4 are only able to be measured via a model which estimates risk premiums or the expected return over holding cash
Even Breakeven inflation and real TIPS yields have risk premium buried in there market yields. However we can try
SPX has a trailing earnings yield of 4% with expected 1 year earnings growth of 11.7%. What's the bull case? For me the bull case is a combination of simply collecting the earnings accrual
and having the multiple expand slightly. In that case a 16% return would occur which is roughly 1 std higher and happens 1 out of 6 timer.
The big driver of equity returns is the accrual of earnings. Over the last 5 years earnings accrual has dominated historic returns
As long as companies continue to grow earnings they will go up over the long term.
Multiples rise and fall and as can be seen in the chart can dominate performance of equities in the short term. Furthermore multiples are impacted by interest rates
I YR return Asset bull cases part 1a
10 Year notes
10 year notes yield 4% today. What's the bull case? Let's talk about an unusually good absolute return that would happen 1 in 6 times this year meaning 1STD or more. That would be a 6% price rise Along with a 6% price move
One would also get a 4% coupon generating a 10% return and an excess return over cash of 6.5%. That's pretty good and could be leveraged 2.5x to have the same risk as SPX and generate 16.25% return.
What would that mean mechanically?
A 6% price move would require 9 year yields which are roughly 3.95% to be 3.22
A year from now.
The bull case for bonds depends on whether the odds of 3.22% yields occuring is 1:6. If the odds are higher the bonds are a buy if lower then bonds are a sell.
By far the most important one is they become insolvent
An insolvent company has negative equity. Its assets are worth less than its debt. For a bank the largest debtor is the depositor but other debtors exist as well.
Banks risk insolvency due to higher leverage of their equity relative to any other non financial company
Bank assets are also subject to sudden repricing when the loans and securities banks own default or like in the "Banking Crisis of 2023" the assets reprice rapidly due to a change in the risk free interest rate.