CONTINUATION OF MARKET PROFILE SERIES- PART 3
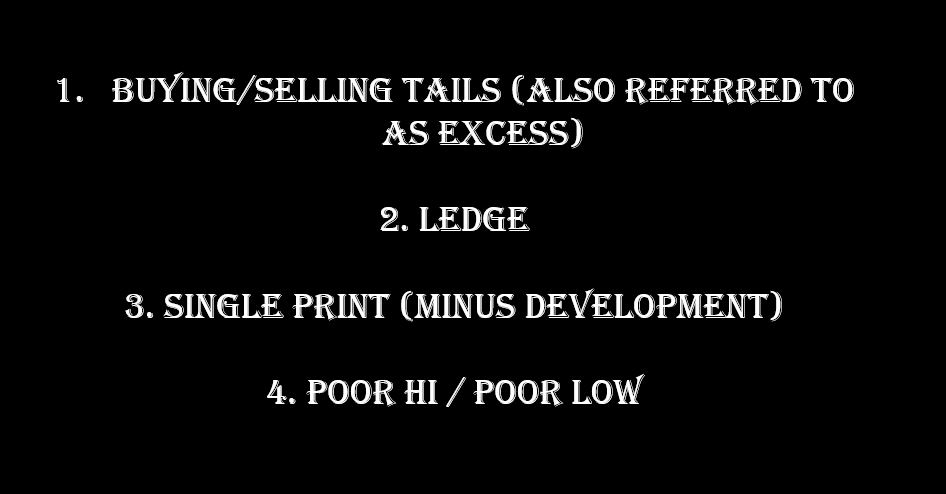
MP terminology & Anomalies covered:
Next, there is some value to understanding the DAILY OPEN TYPES and use it to leverage potential opportunities in terms of how the rest of the day might play out. https://t.co/3jCow6Qcim

MP terminology & Anomalies covered:
Next, there is some value to understanding the DAILY OPEN TYPES and use it to leverage potential opportunities in terms of how the rest of the day might play out. https://t.co/3jCow6Qcim
https://twitter.com/Stoiiic/status/1682004952217001985?s=20

DAILY OPEN TYPES:
- Open Drive
- Open Test Drive
- Open Rejection Reverse
- Open Auction
Let's dive in to the characteristics of each daily open type.
- Open Drive
- Open Test Drive
- Open Rejection Reverse
- Open Auction
Let's dive in to the characteristics of each daily open type.
OPEN DRIVE- DETAILS IN IMAGES
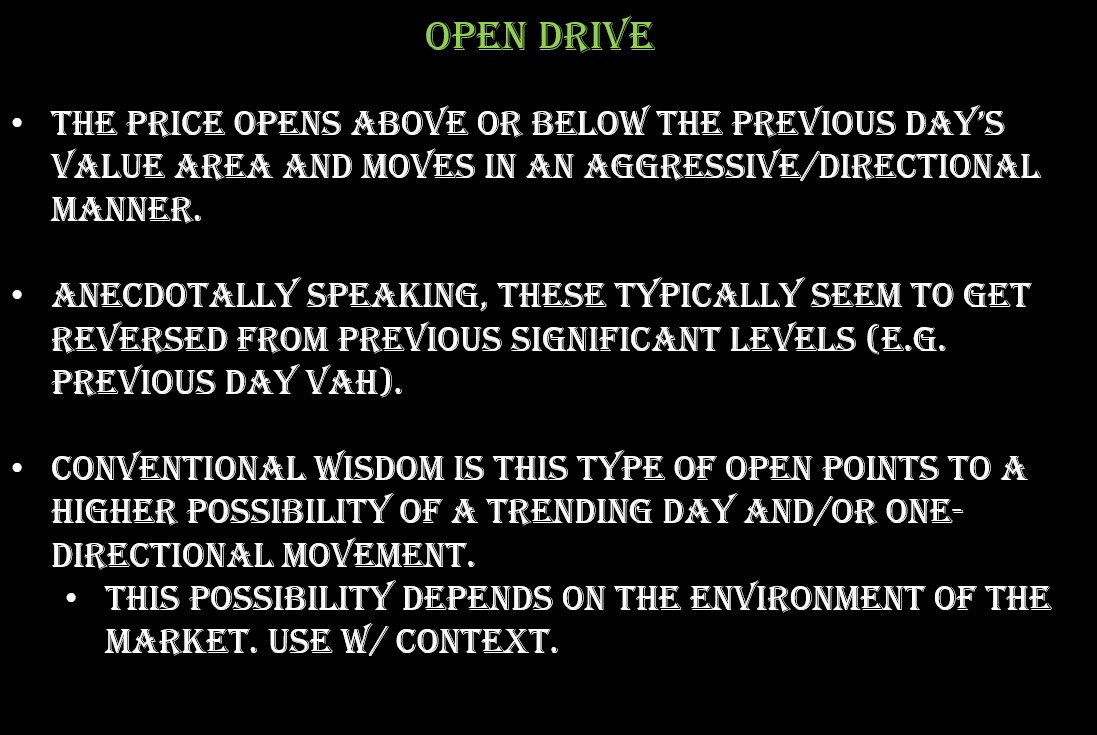
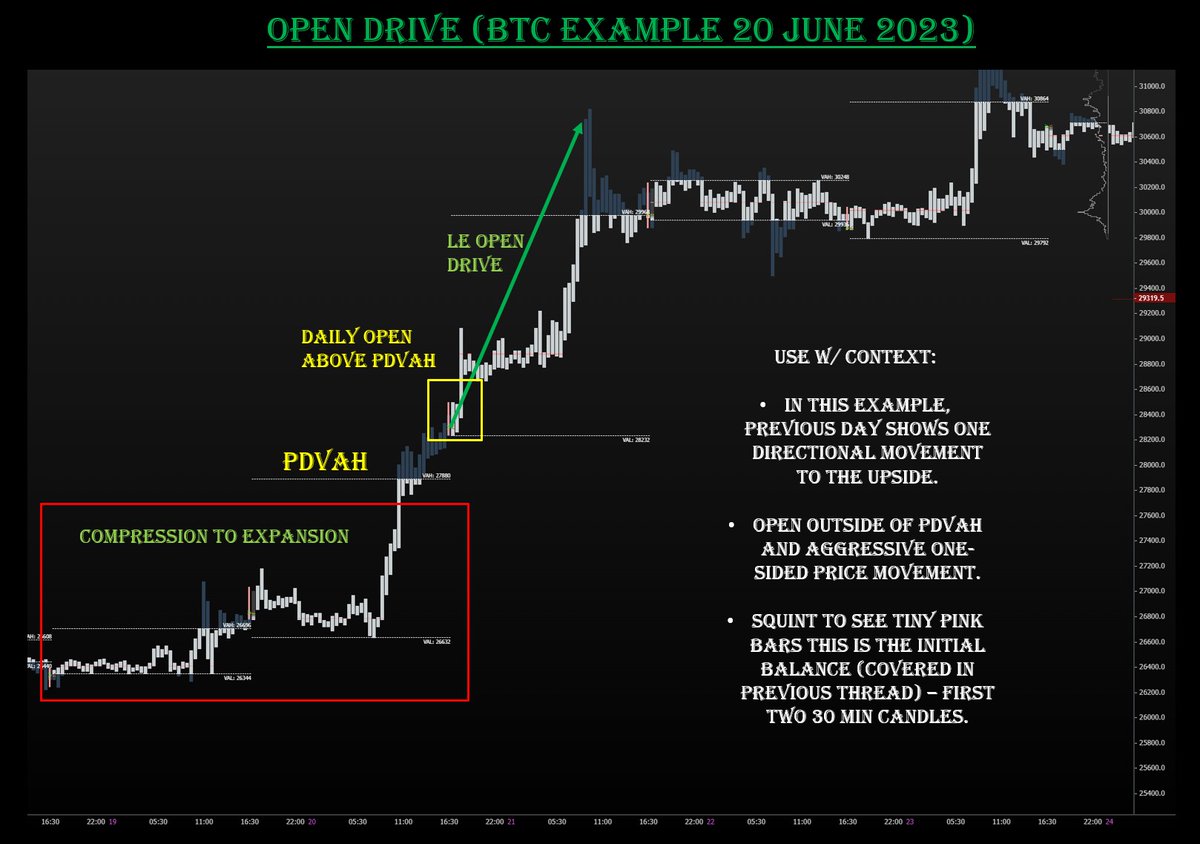
Price opens above or below the previous day’s value area and moves in an aggressive/directional manner.
Anecdotally speaking, these typically seem to get reversed from previous significant levels (e.g. previous day VAH). Use w/ context.
Price opens above or below the previous day’s value area and moves in an aggressive/directional manner.
Anecdotally speaking, these typically seem to get reversed from previous significant levels (e.g. previous day VAH). Use w/ context.
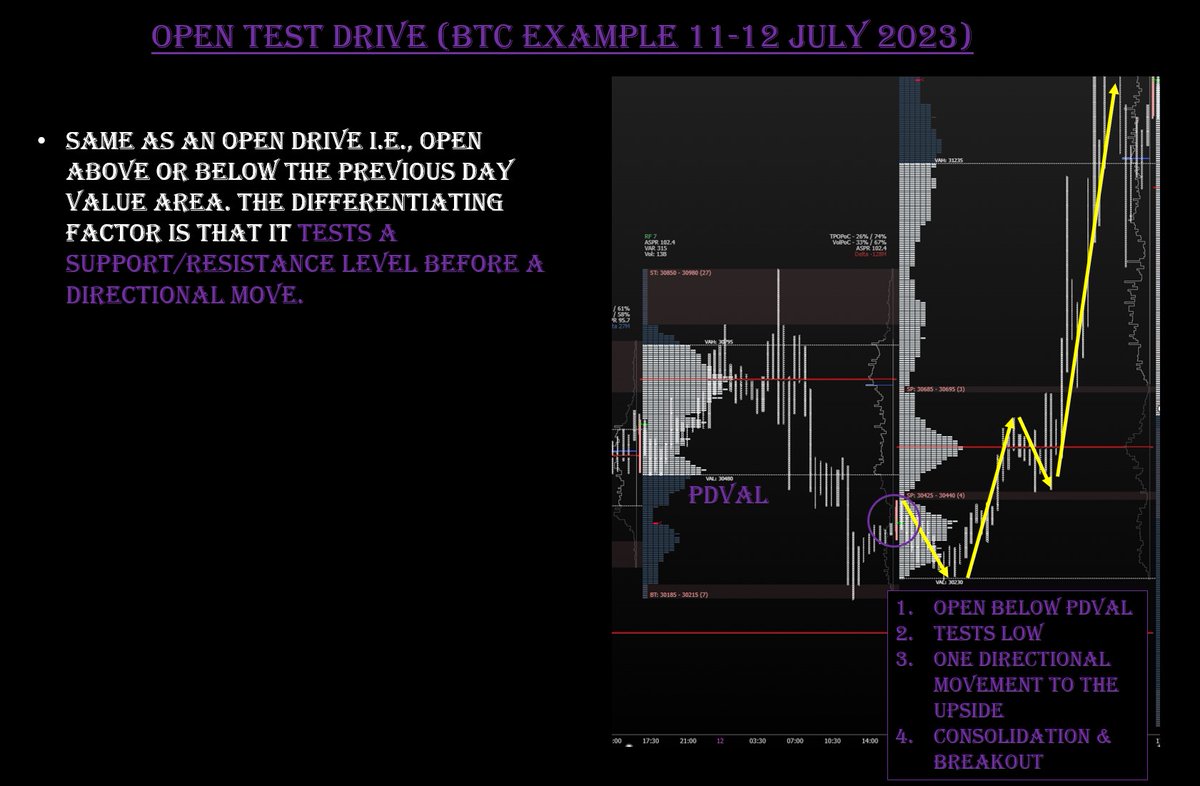
OPEN TEST DRIVE- DETAILS IN IMAGE
Same as an open drive i.e., open above or below the previous day value area. The differentiating factor is that price tests a support/resistance level before reversing for a directional move.
Same as an open drive i.e., open above or below the previous day value area. The differentiating factor is that price tests a support/resistance level before reversing for a directional move.
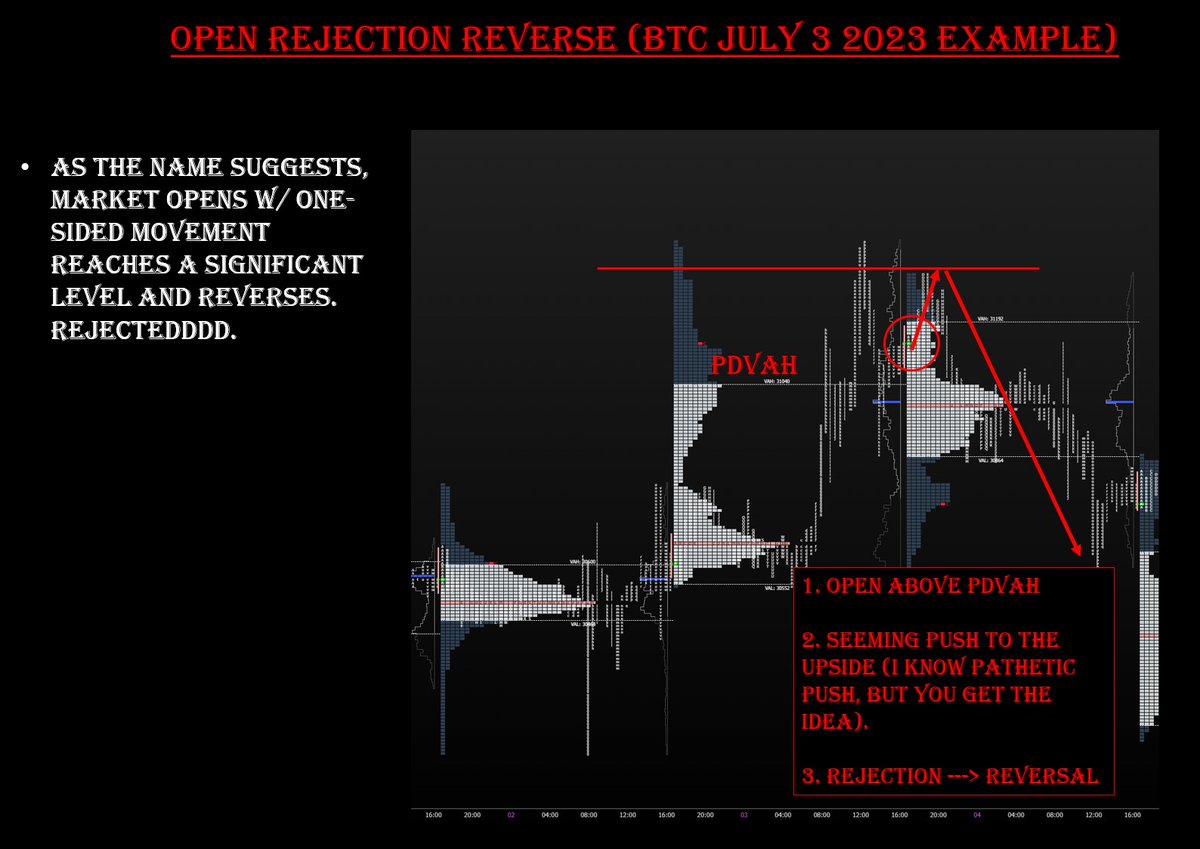
OPEN REJECTION REVERSE - DETAILS IN IMAGE
As the name suggests, market opens w/ one-sided movement reaches a significant level and reverses.
As the name suggests, market opens w/ one-sided movement reaches a significant level and reverses.
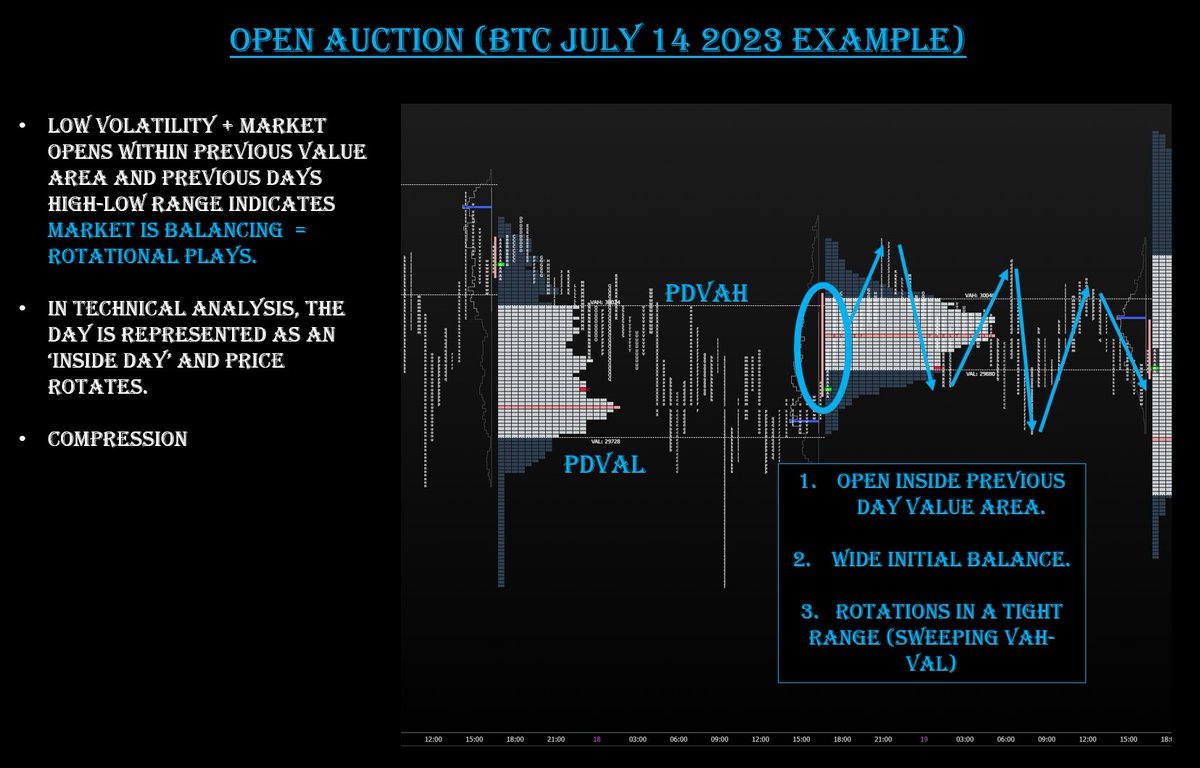
OPEN AUCTION - DETAILS IN IMAGE
Low volatility + market opens within previous value area and previous days high-low range indicates market is balancing = rotational plays. God knows we've been getting a lot of these lately....
Low volatility + market opens within previous value area and previous days high-low range indicates market is balancing = rotational plays. God knows we've been getting a lot of these lately....
Additional Resources-
1. @abetrade -
(TradingRiot has phenomenal free information available if you're interested in learning)
2. https://t.co/ixIMw2eyY7
3. https://t.co/CJDqYFxVQn https://t.co/aK1uHtpYpLtradingriot.com/market-profile/
atas.net/volume-analysi…
marketcalls.in/market-profile…
1. @abetrade -
(TradingRiot has phenomenal free information available if you're interested in learning)
2. https://t.co/ixIMw2eyY7
3. https://t.co/CJDqYFxVQn https://t.co/aK1uHtpYpLtradingriot.com/market-profile/
atas.net/volume-analysi…
marketcalls.in/market-profile…
@abetrade Understanding the daily open types can prove helpful to assign probabilities to how the rest of the day will play out = being able to capitalize on directional or mean-reversion opportunities.
RT to share, LIKE & FOLLOW for more insightful content.
Thank you for the support 🙏
RT to share, LIKE & FOLLOW for more insightful content.
Thank you for the support 🙏

• • •
Missing some Tweet in this thread? You can try to
force a refresh