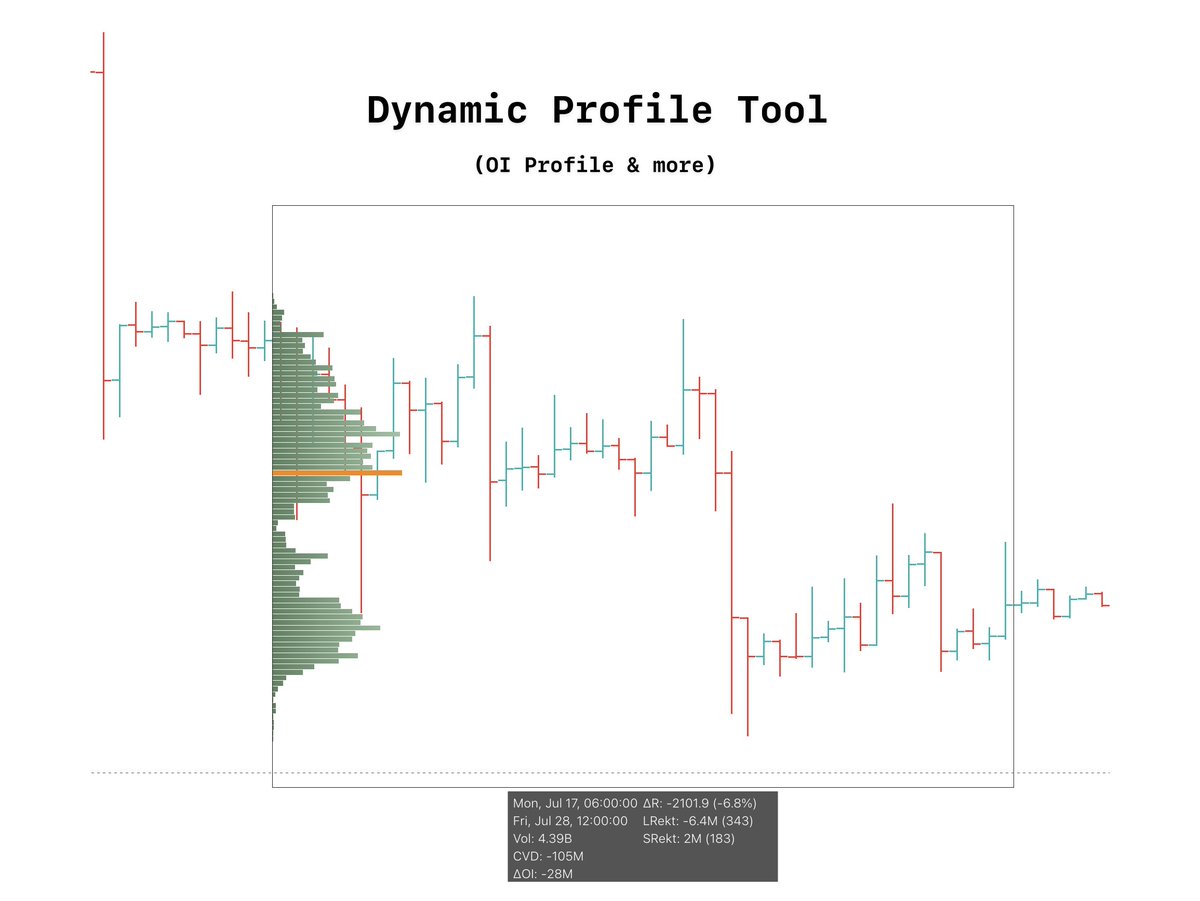
Dynamic Profile Tool (fixed range) 👨💻
🧵 Thread
🧵 Thread
in this thread, I will cover the following:
- my settings
- use cases of the dynamic profile tool
- differences between this and TV
- specific nuances
- my settings
- use cases of the dynamic profile tool
- differences between this and TV
- specific nuances
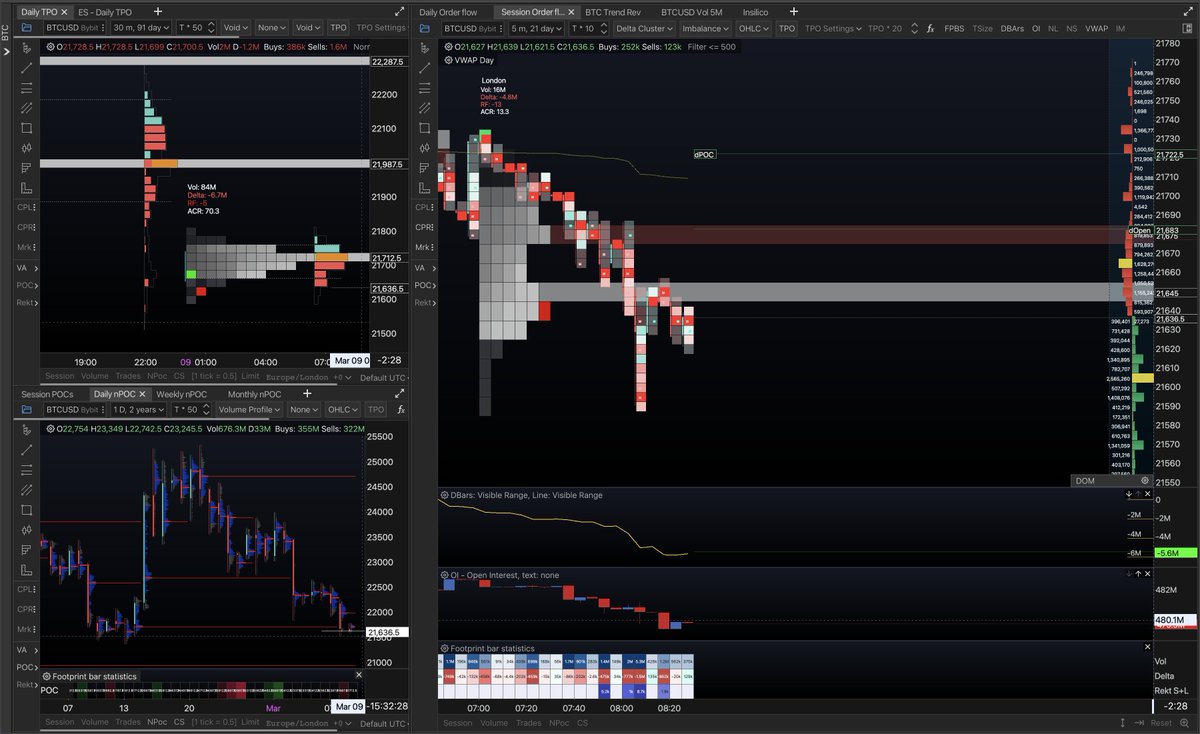
Tradingview vs Exo
Tradingview's Fixed range tool and Exo charts dynamic profile tool are quite different.
Exocharts dynamic profile tool has more capabilities.
TV's fixed range tool simply provides you with volume data whereas Exo can provide:
OI data
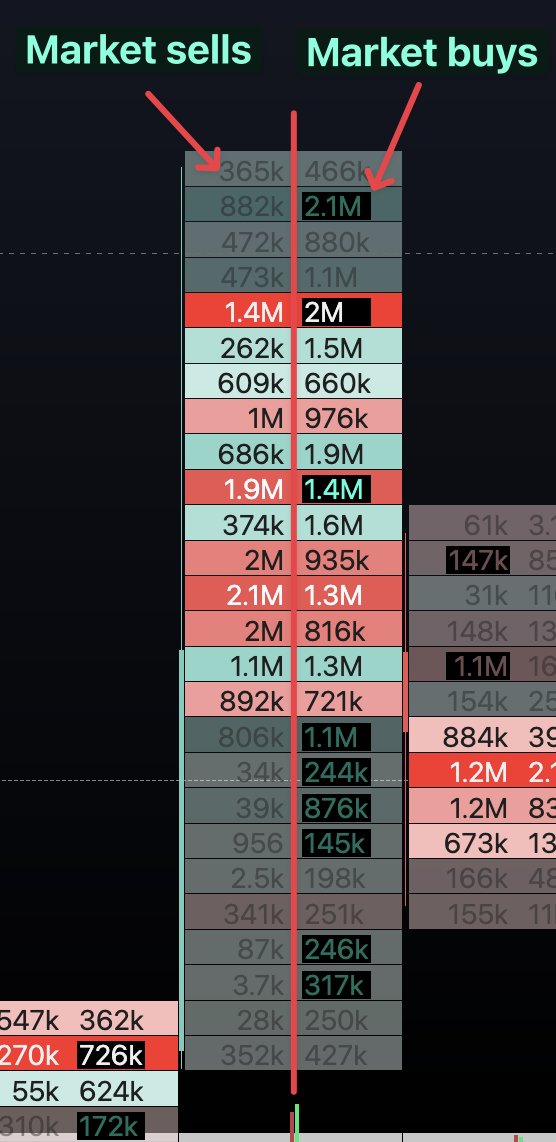
Buys vs Sells
& more
Tradingview's Fixed range tool and Exo charts dynamic profile tool are quite different.
Exocharts dynamic profile tool has more capabilities.
TV's fixed range tool simply provides you with volume data whereas Exo can provide:
OI data
Buys vs Sells
& more
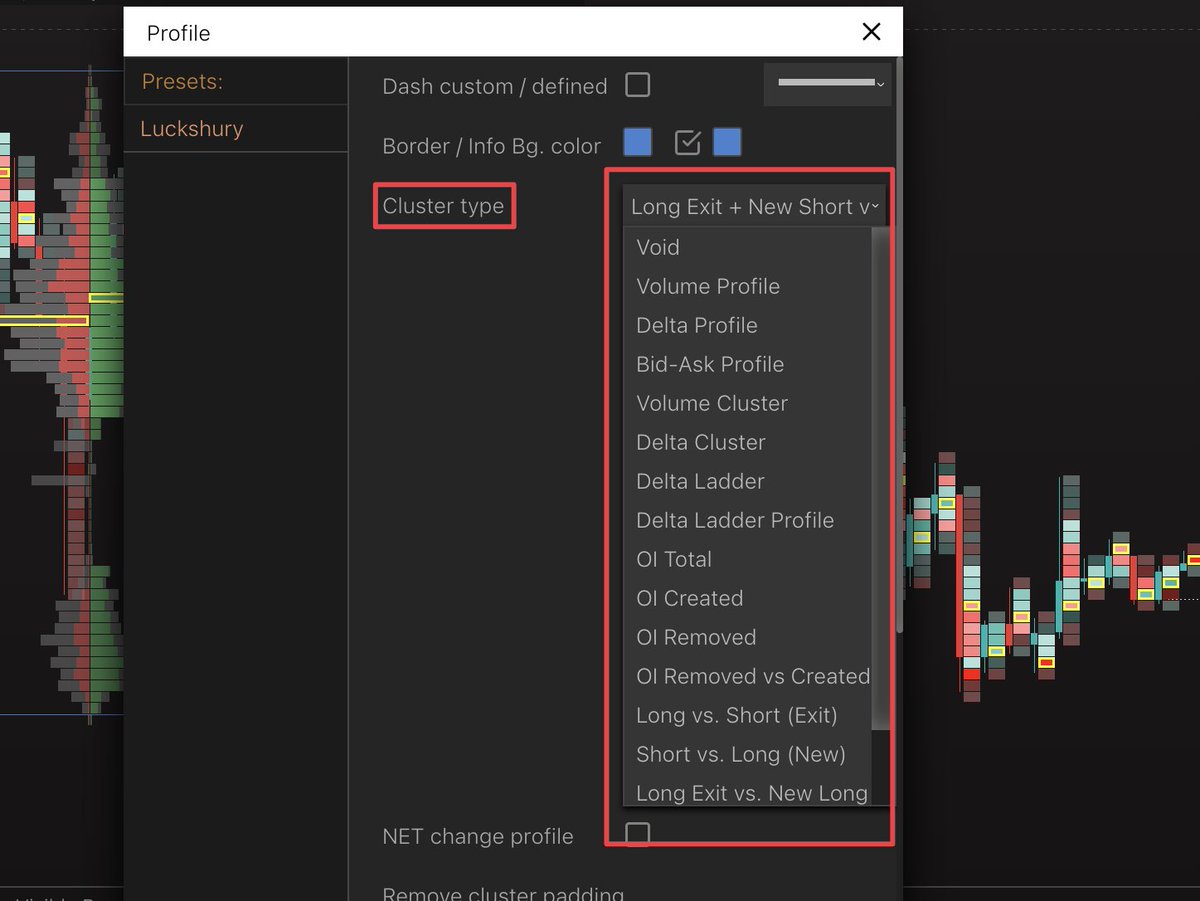
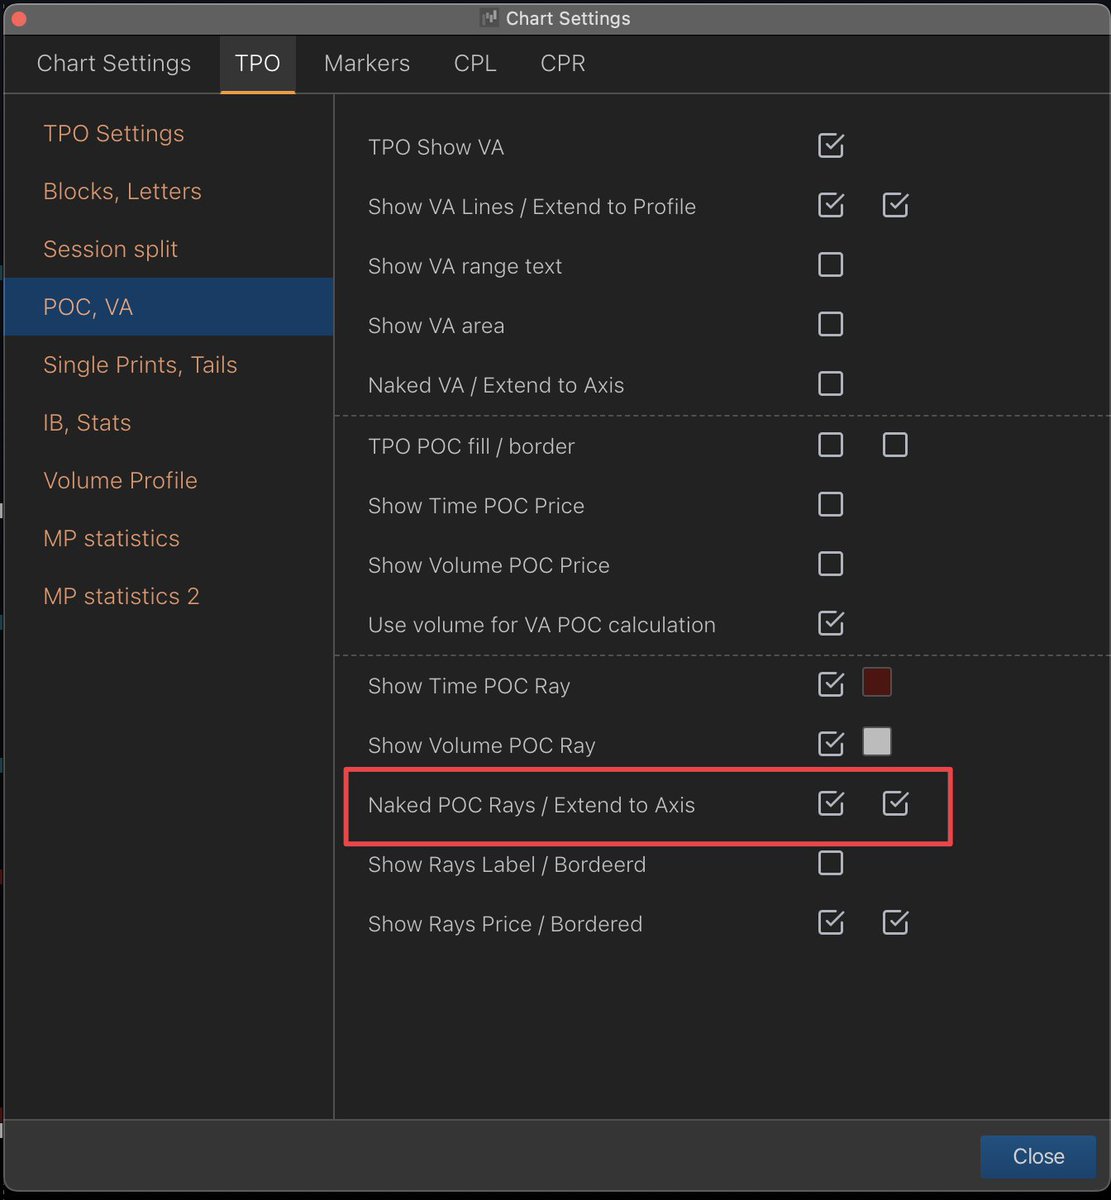
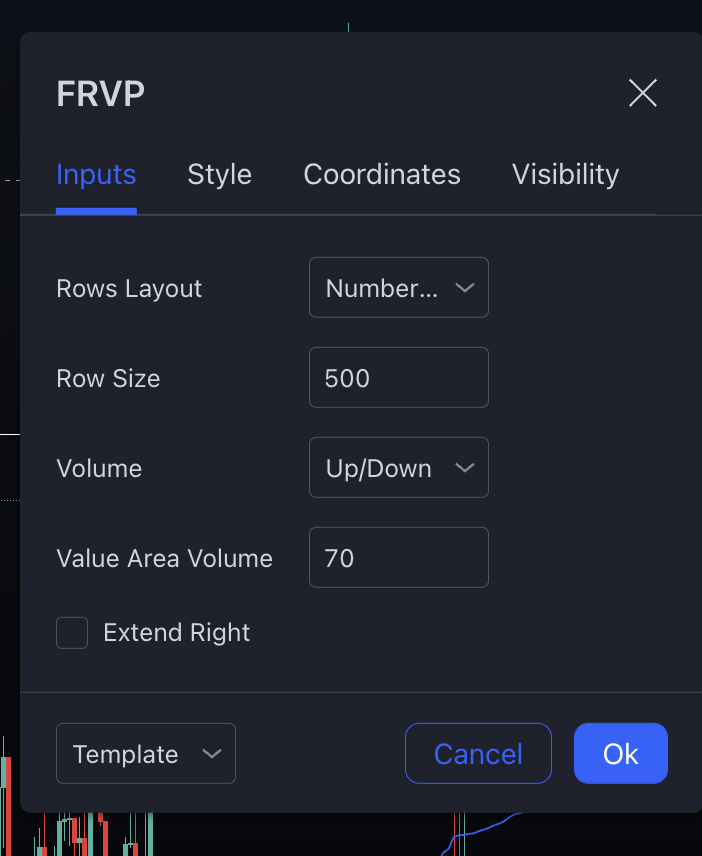
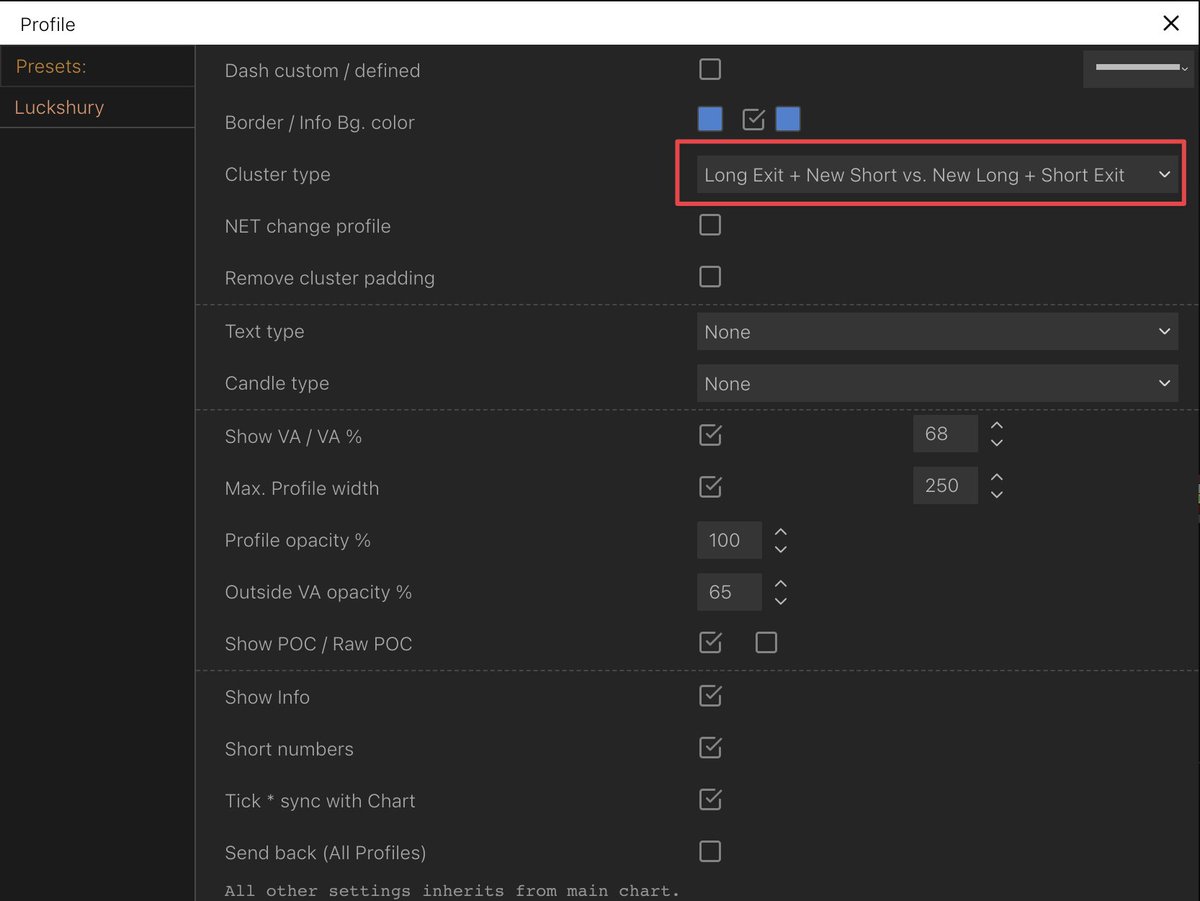
My settings:
I prefer to use the OI cluster type within my dynamic profile tool.
Typically im only using this to find where NEW positions have been opening rather than ones that have closed out.
I prefer to use the OI cluster type within my dynamic profile tool.
Typically im only using this to find where NEW positions have been opening rather than ones that have closed out.
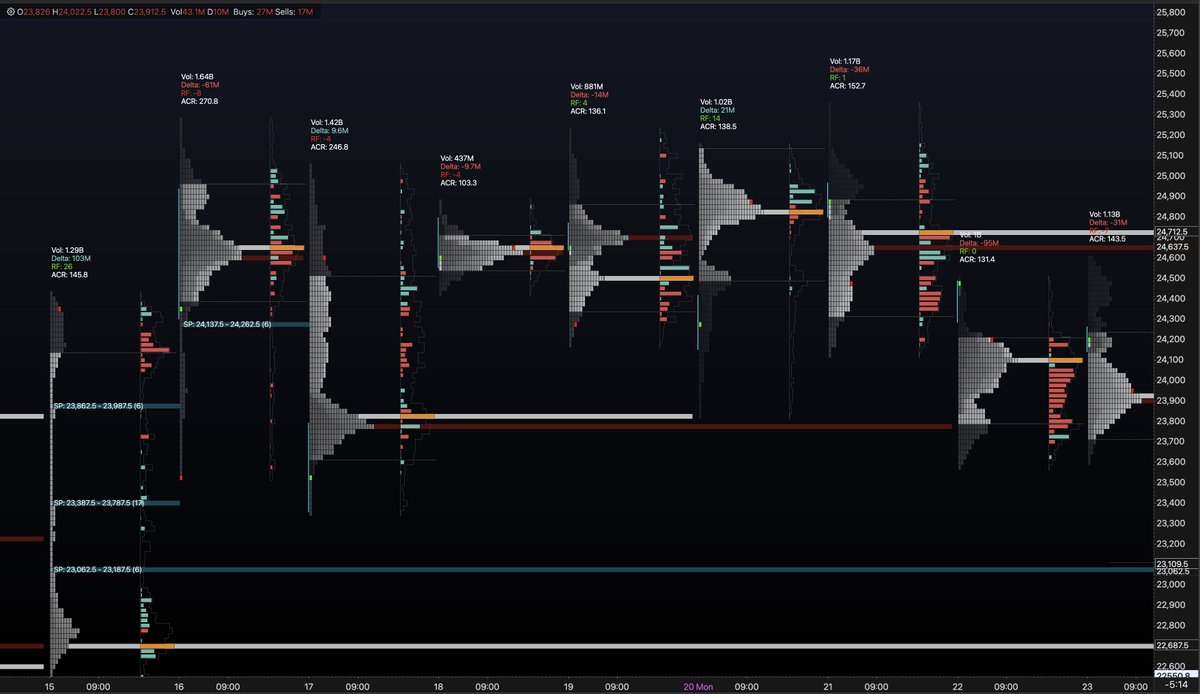
Trending moves:
OI/new position spikes in trending moves can be extremely useful in determining trend strength/weakness
If we have a bullish trending move and can decipher where the most longs are opening within that trend, we can then use that as a strong reference point.
OI/new position spikes in trending moves can be extremely useful in determining trend strength/weakness
If we have a bullish trending move and can decipher where the most longs are opening within that trend, we can then use that as a strong reference point.
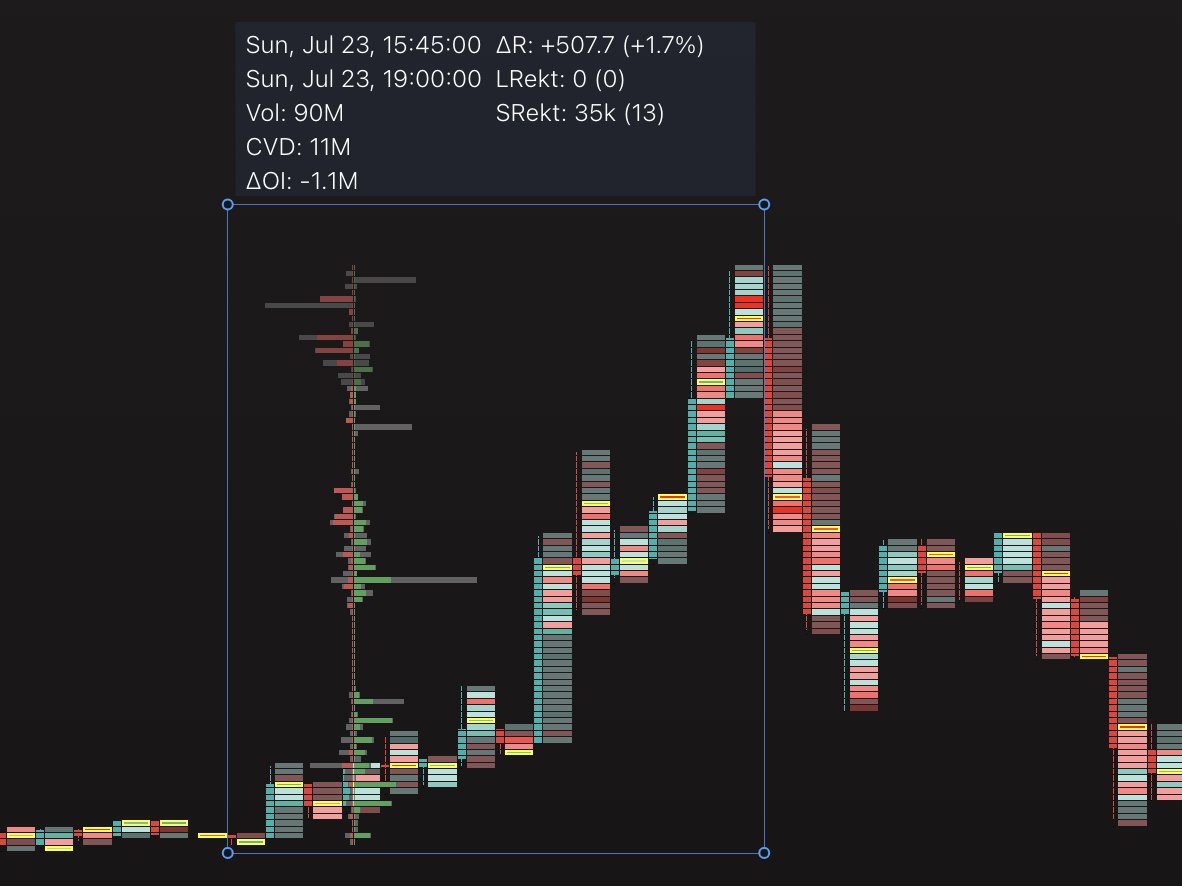
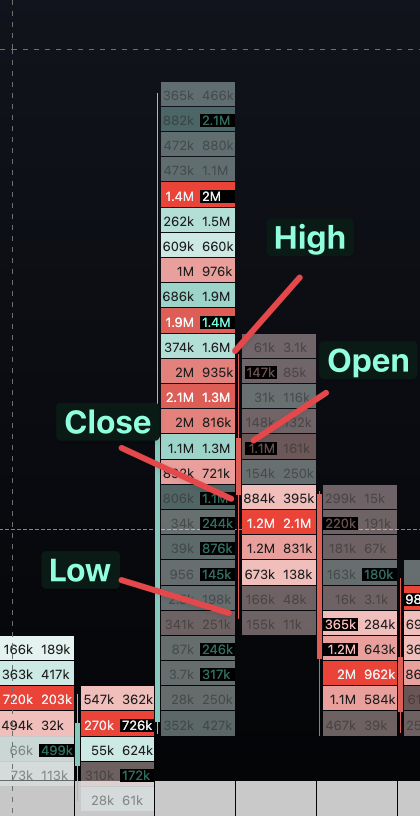
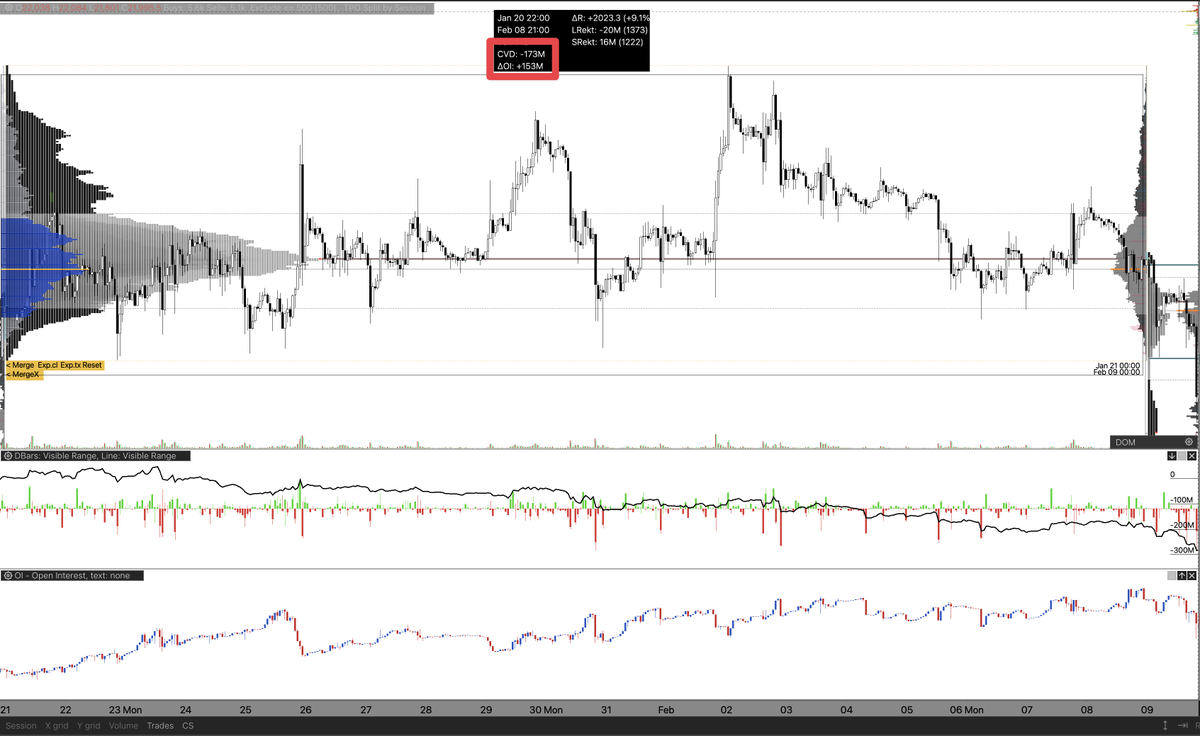
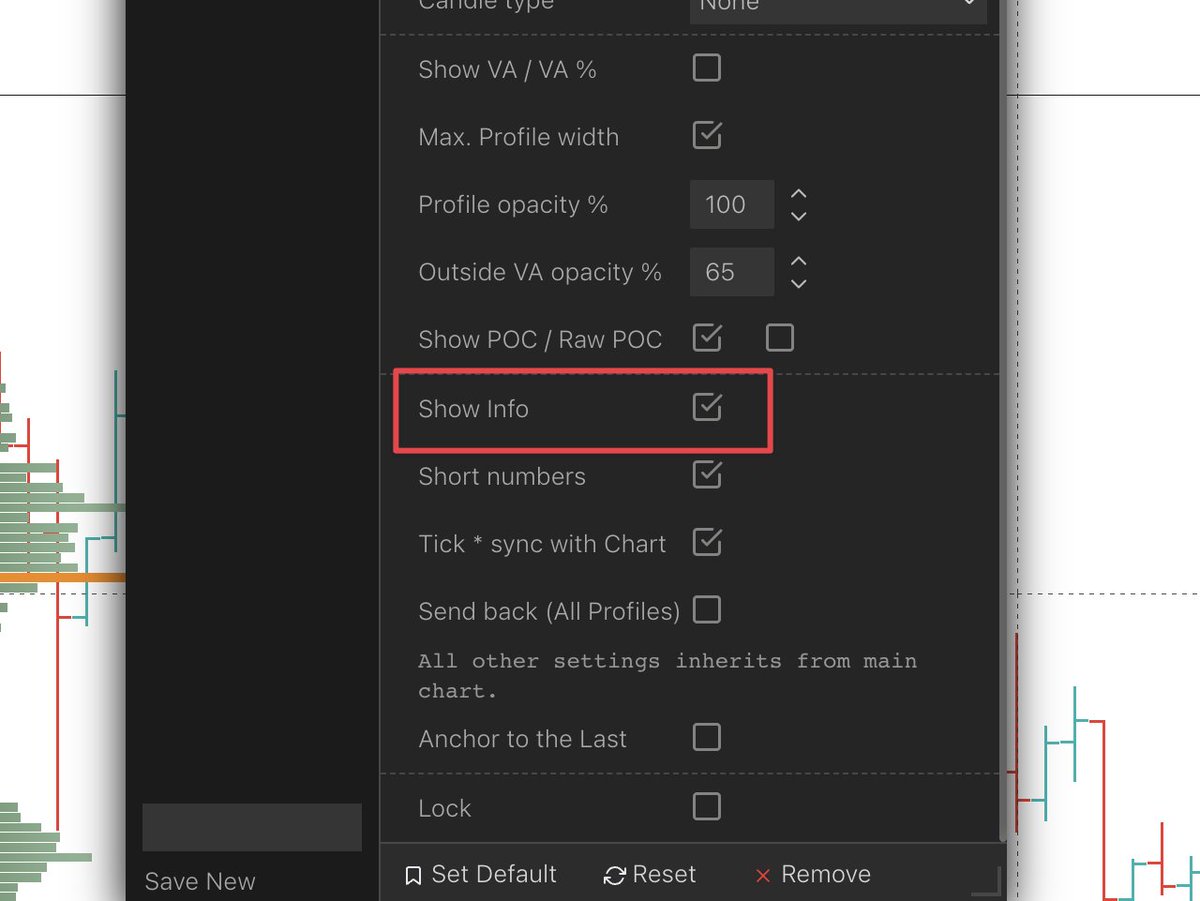
Info box:
This info table can provide some extremely useful statistics in particular the following 2:
- Net change in OI (Open Interest)
- CVD
With a single dynamic profile pull, you can know what the majority are siding towards through those 2 figures.
This info table can provide some extremely useful statistics in particular the following 2:
- Net change in OI (Open Interest)
- CVD
With a single dynamic profile pull, you can know what the majority are siding towards through those 2 figures.
+ CVD w + OI = New Longs
+ CVD w - OI = Shorts Closing
- CVD w + OI = New Shorts
- CVD w - OI = Longs Closing
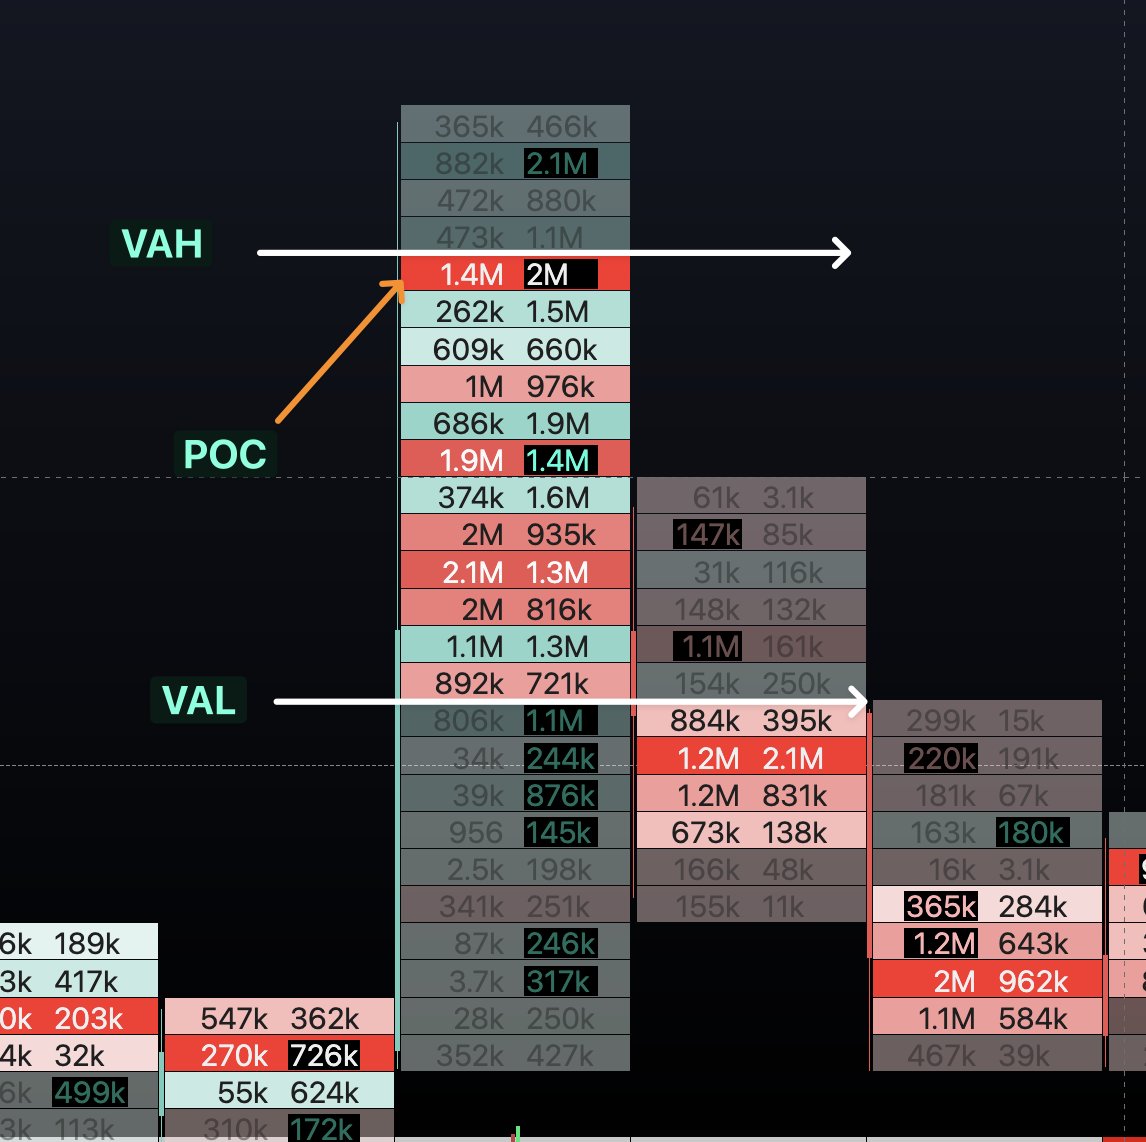
The visual profile tells me at which price point those majorities are coming in, to use as key s/r levels
+ CVD w - OI = Shorts Closing
- CVD w + OI = New Shorts
- CVD w - OI = Longs Closing
The visual profile tells me at which price point those majorities are coming in, to use as key s/r levels
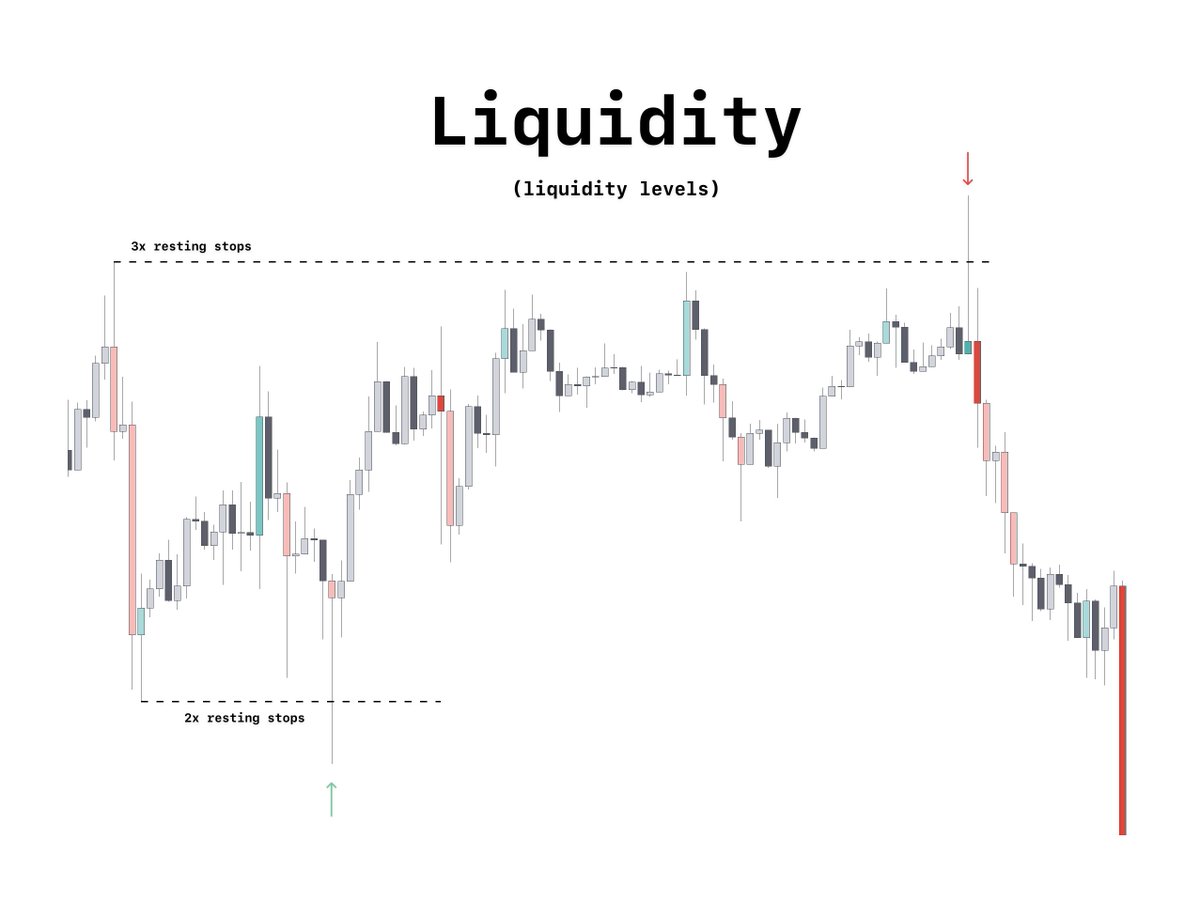
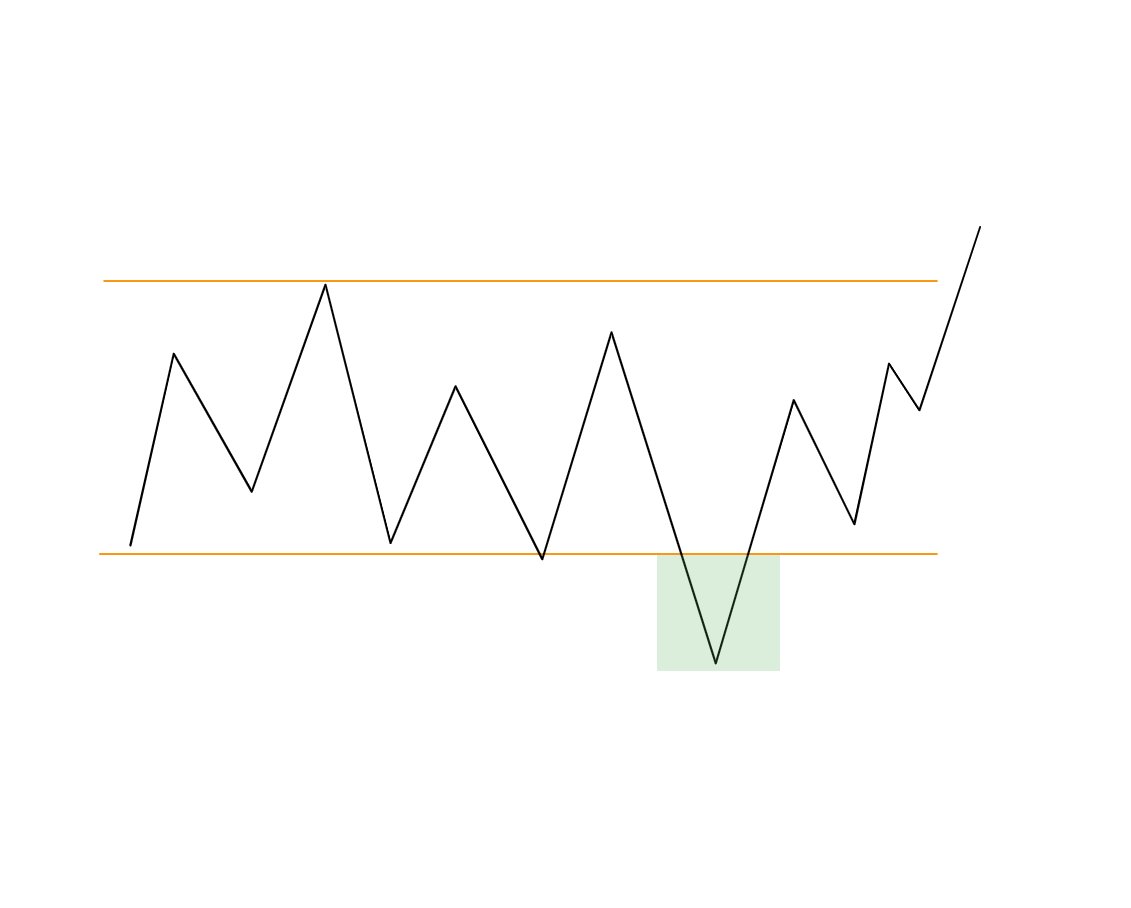
Ranges:
Now you know where the majority are sided you can anticipate potential fakeouts of a range based on this data
ie - if we have a build-up of new longs within a range a possible move down to stop them out before moving up would be my preferred scenario.
Now you know where the majority are sided you can anticipate potential fakeouts of a range based on this data
ie - if we have a build-up of new longs within a range a possible move down to stop them out before moving up would be my preferred scenario.
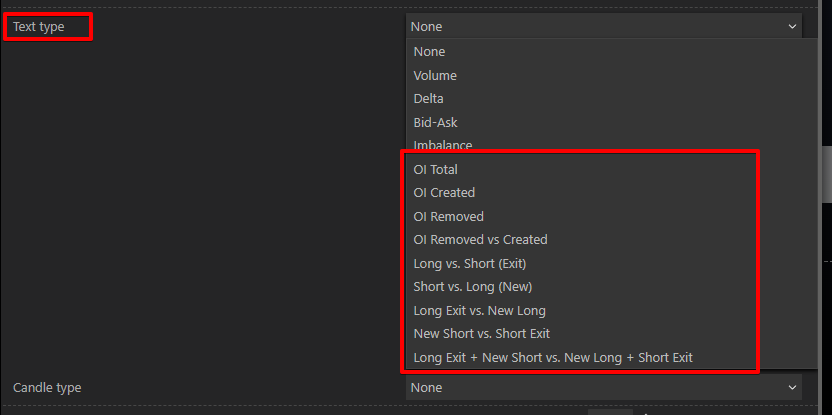
Further tip:
text type - my preferred is short vs long (new)
text type - my preferred is short vs long (new)
I use this tool to mainly identify key s/r levels within a certain trend or recognize what the majority are sided towards within a range.
To use this tool to its fullest you must know how to pull a regular fixed-range tool
(Free video about this on my Youtube)
To use this tool to its fullest you must know how to pull a regular fixed-range tool
(Free video about this on my Youtube)
• • •
Missing some Tweet in this thread? You can try to
force a refresh