Let’s do a quick Short Recap on the day
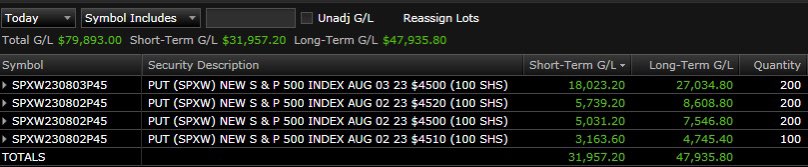
08/02/2023
P/L + $79,893.00
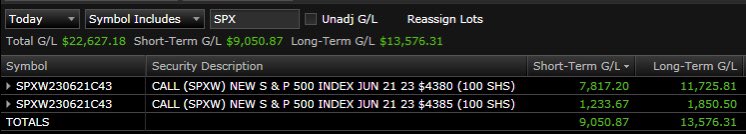
Traded $SPX
Tools Used: Chart Structure & Gamma, Vanna, & Speed Exposure
Thread 🧵👇🏼 $SPX $SPY
08/02/2023
P/L + $79,893.00
Traded $SPX
Tools Used: Chart Structure & Gamma, Vanna, & Speed Exposure
Thread 🧵👇🏼 $SPX $SPY
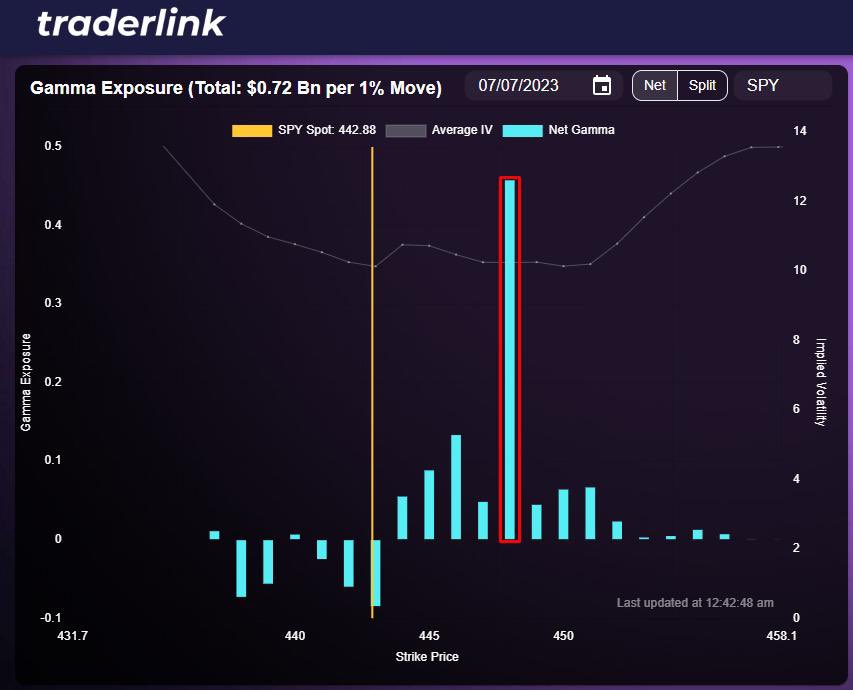
Identify the environments!!
Negative Gamma Exposure
Negative Vanna Exposure
Negative Gamma Exposure
Negative Vanna Exposure
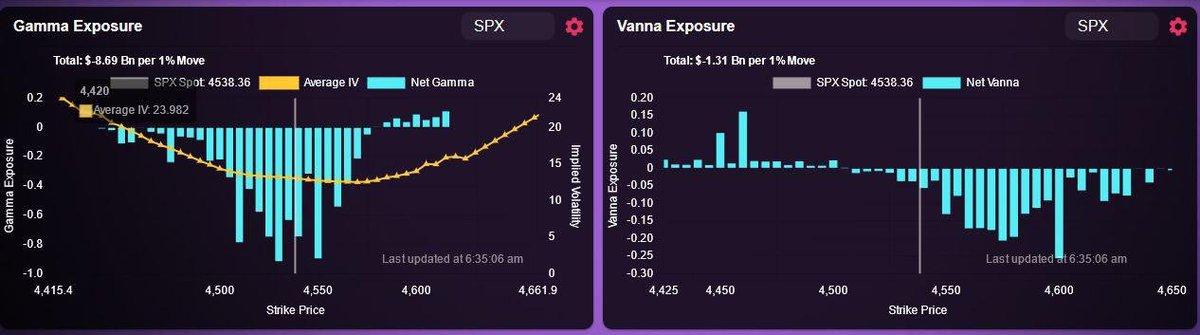
Identify the AOI (Area of Interest)!!
ANY of the big exposures can be used as AOIs today.
Identify the Vol relation to the underlying!!
If we increase in underlying, the AOI gains vol suggesting dealers need to sell stock to hedge
ANY of the big exposures can be used as AOIs today.
Identify the Vol relation to the underlying!!
If we increase in underlying, the AOI gains vol suggesting dealers need to sell stock to hedge
If we decrease in the underlying, the AOI loses vol suggesting dealers need to sell stock to hedge
Create your bias from hedging mechanics!!
This information from the data gives us the suggested bias for the day being in a sell/sell letting me know to look for short entries.
This information from the data gives us the suggested bias for the day being in a sell/sell letting me know to look for short entries.
To understand speed here is an analogy that may make it simple. You have a rock rolling down a hill, speed can be seen as the slope of said hill. The higher the Speed Exposure, the steeper the hill, the faster the rock rolls down.
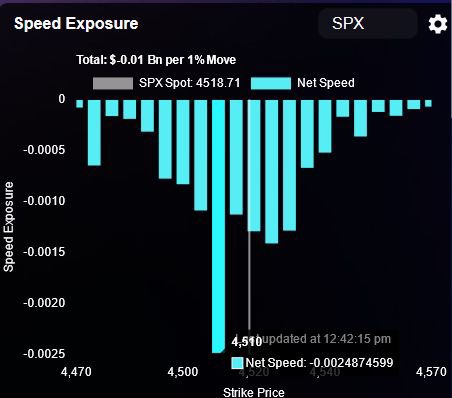
The higher the speed exposure, the faster the delta of an option can pick up when the underlying moves in your favor, this can increase your potential profit compared to if you were to just take any contract
it will help you select the one in which the delta will increase the fastest
Video breaking down how to read the data the same way:
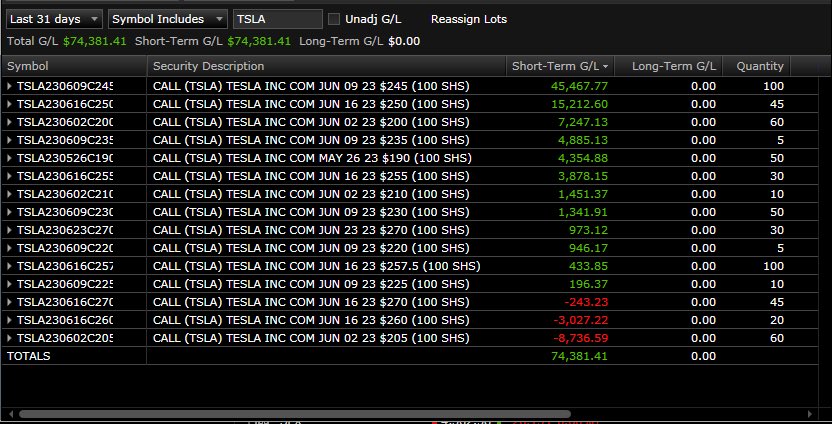
Time stamps of all the trades with entries and exits
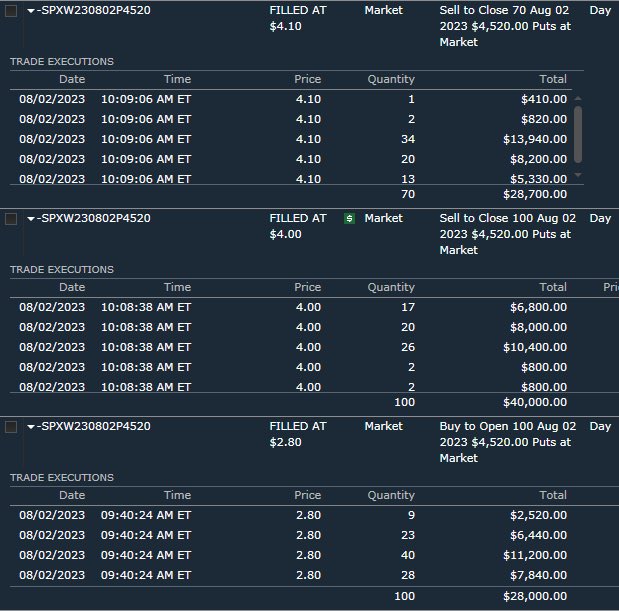
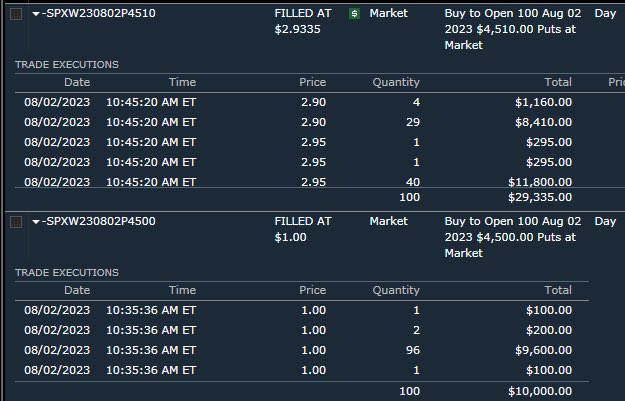
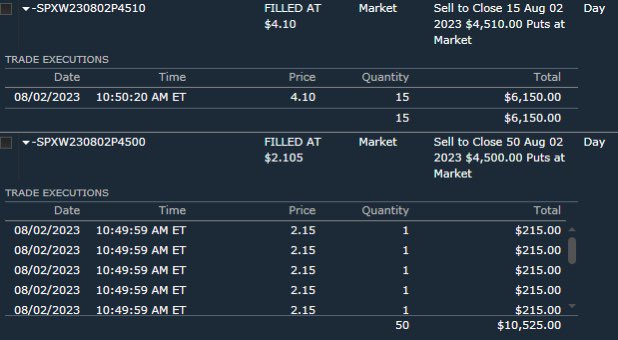
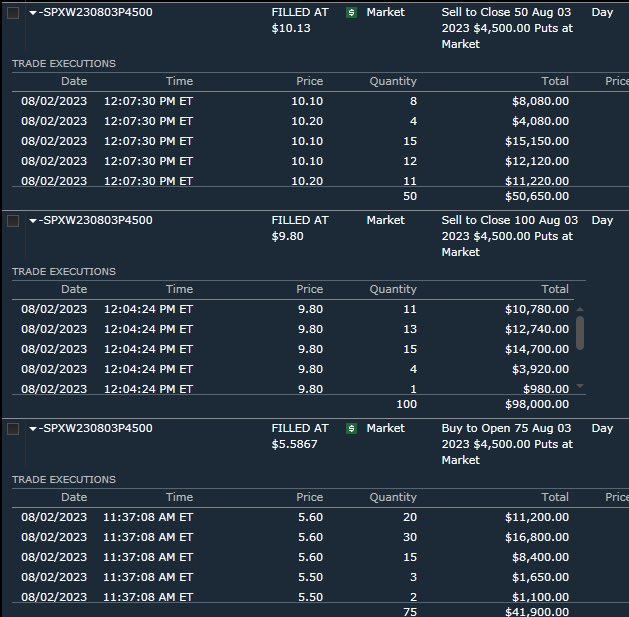
Main level to watch for today was the break of 4527 (10 day outside day break) all trades today were based on this level. And mid day when it retested and rejected was another entry for it.
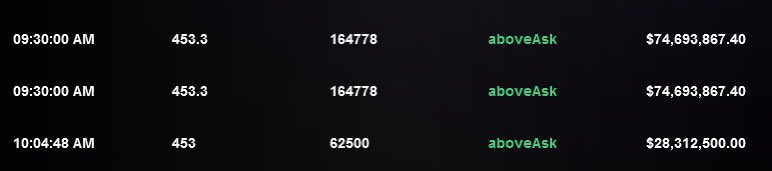
Bonus tape recap: off open this trades were filled as imbalance started to shift to the sell side. These were the top 3 market orders before it dumped from 453 where we had our stops for the day, slightly above that level at 453.30
All data derived from
It’s your last and final chance to sign up for the beta launch that ends Aug 6. What are you waiting for?Traderlink.io
It’s your last and final chance to sign up for the beta launch that ends Aug 6. What are you waiting for?Traderlink.io
• • •
Missing some Tweet in this thread? You can try to
force a refresh