Volume Candles 🧠
(reversals & breakouts)
🧵 thread
(reversals & breakouts)
🧵 thread

In this thread we will go through the following:
- my specific settings
- uses within potential reversal points
- uses within-range breakouts
- my specific settings
- uses within potential reversal points
- uses within-range breakouts
my settings
im using the volume suite indicator by my good friend @leviathancrypto
check out his page for more free indicators if you so wish
my settings are as shown below 👇
im using the volume suite indicator by my good friend @leviathancrypto
check out his page for more free indicators if you so wish
my settings are as shown below 👇

@leviathancrypto use cases
- used as 1 of many confluences for when I take a trade (I do not look at this solely on its own)
- looking for spikes in volume at my levels of interest
- whether a range break is legit or not
- used as 1 of many confluences for when I take a trade (I do not look at this solely on its own)
- looking for spikes in volume at my levels of interest
- whether a range break is legit or not
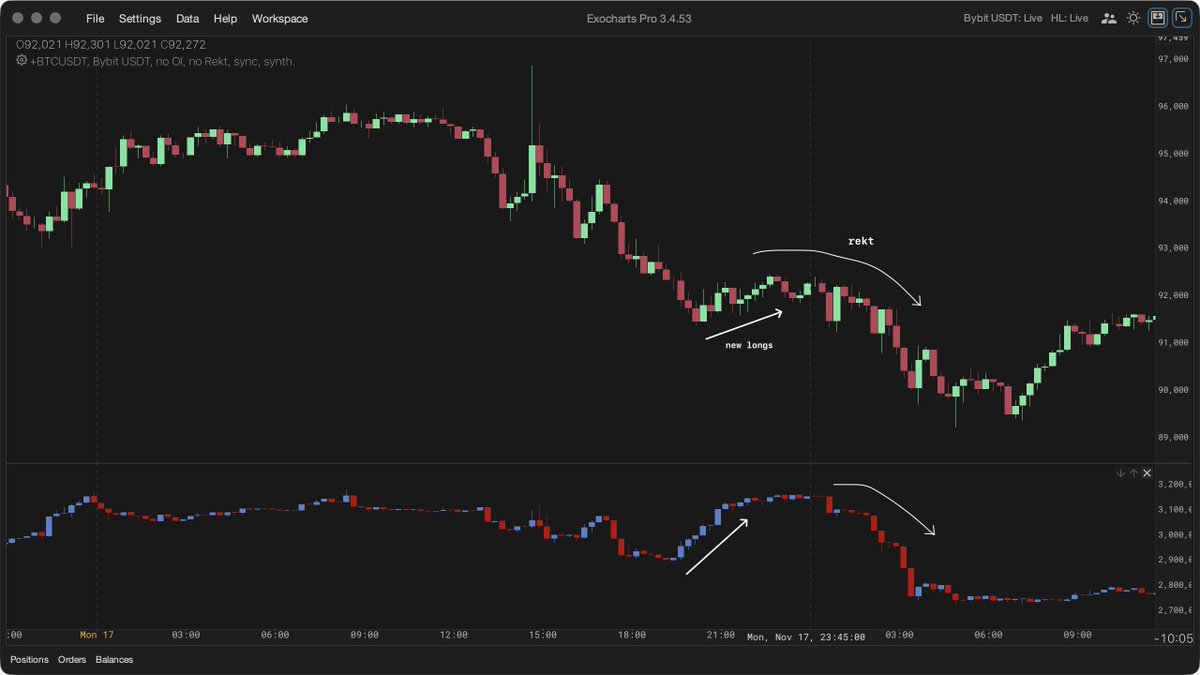
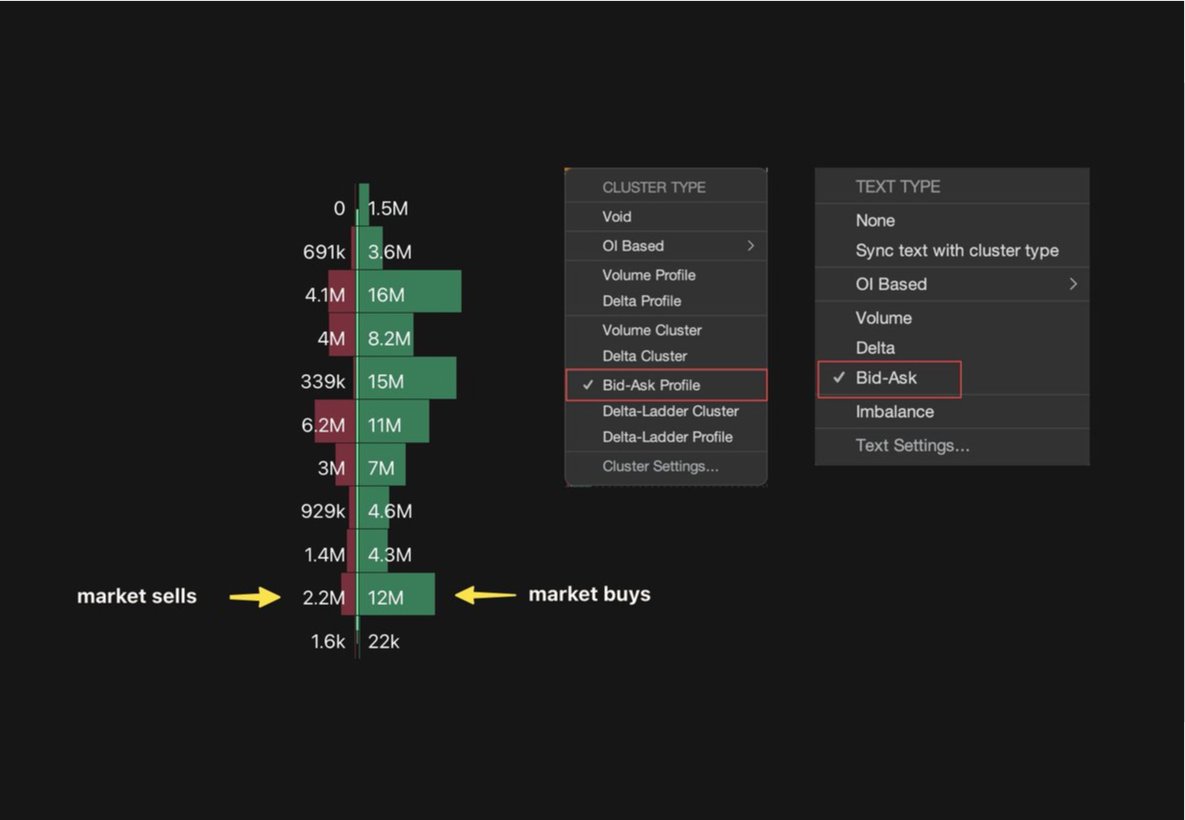
@leviathancrypto volume spikes
- have a key level of interest
- when the price reaches that level of interest how does the volume within the candle compare to the previous 20-30 candles?
- if higher than the average of those previous 20-30 candles then yes we have a volume spike
- have a key level of interest
- when the price reaches that level of interest how does the volume within the candle compare to the previous 20-30 candles?
- if higher than the average of those previous 20-30 candles then yes we have a volume spike
@leviathancrypto volume spikes (2)
you will typically want to see volume spikes upon your key levels being hit for reversals.
using the volume candles indicator allows me to easily see (via TV) whether at my level of interest if there is a volume spike or not
and put them into 3 categories
you will typically want to see volume spikes upon your key levels being hit for reversals.
using the volume candles indicator allows me to easily see (via TV) whether at my level of interest if there is a volume spike or not
and put them into 3 categories
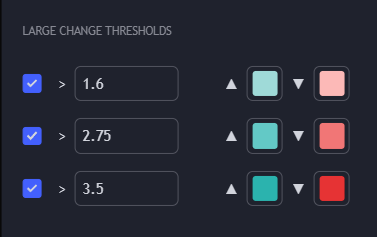
@leviathancrypto the 3 categories (all relative)
1.6x the average - spike in volume
2.75x the average - relatively large spike in volume
3.5x the average - LARGE spike in volume
1.6x the average - spike in volume
2.75x the average - relatively large spike in volume
3.5x the average - LARGE spike in volume
@leviathancrypto timeframes
for reversals:
- 15m
- 30m
- 1h
for range breakouts:
I rotate from 1h up to 4h/daily time frame
for reversals:
- 15m
- 30m
- 1h
for range breakouts:
I rotate from 1h up to 4h/daily time frame
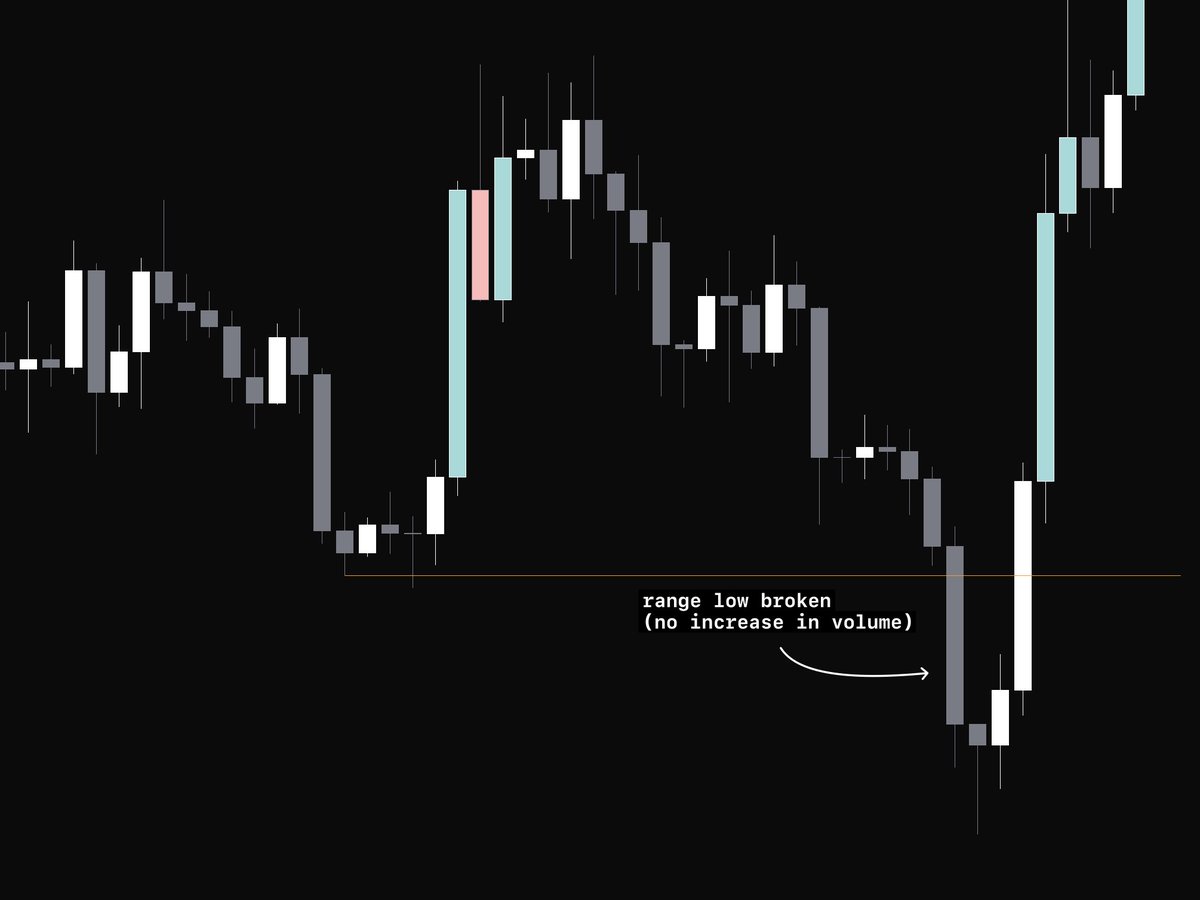
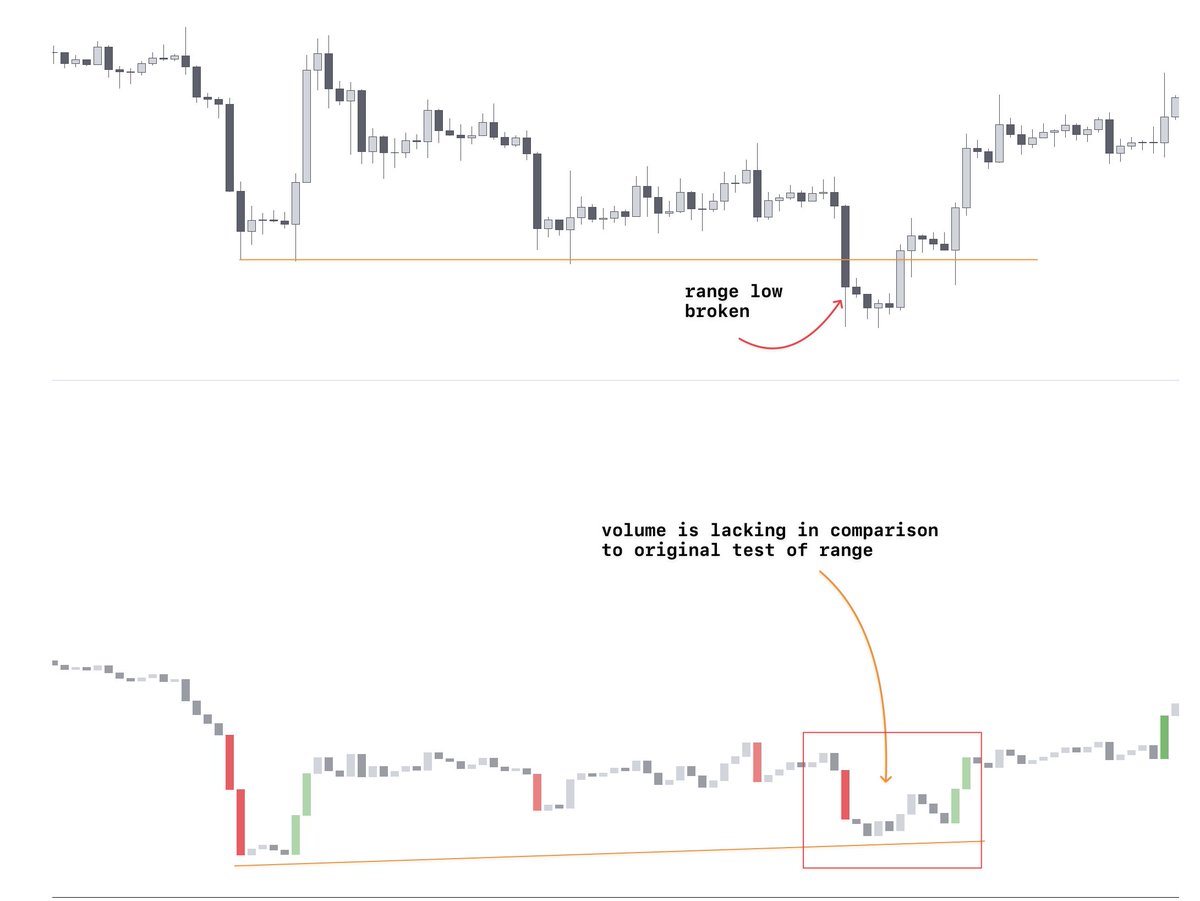
@leviathancrypto ranges
upon range breakouts, you want to see some form of volume spike
if you do not the likelihood for a range fakeout/failed auction would have increased
simple
upon range breakouts, you want to see some form of volume spike
if you do not the likelihood for a range fakeout/failed auction would have increased
simple
@leviathancrypto ranges (2) BONUS
another indicator in the same suite called CRVOL is extremely useful when looking for weakness in range breakouts.
another indicator in the same suite called CRVOL is extremely useful when looking for weakness in range breakouts.
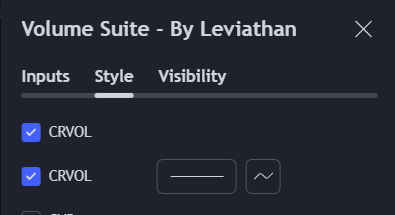
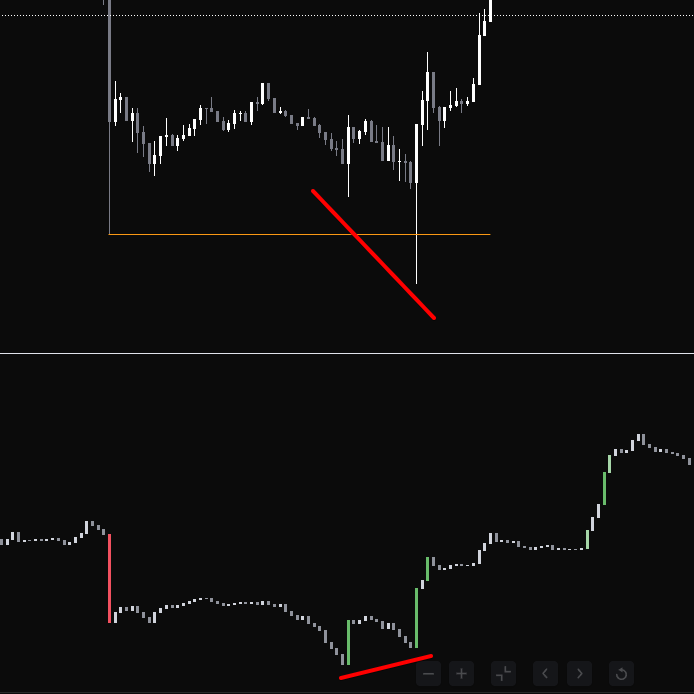
@leviathancrypto CRVOL
very clear and visual indicator for recognizing weakness in range breaks
compare the strength/weakness of one range break to another
use this relative info to your advantage when deciding whether you want to fade a range break or not
very clear and visual indicator for recognizing weakness in range breaks
compare the strength/weakness of one range break to another
use this relative info to your advantage when deciding whether you want to fade a range break or not
• • •
Missing some Tweet in this thread? You can try to
force a refresh