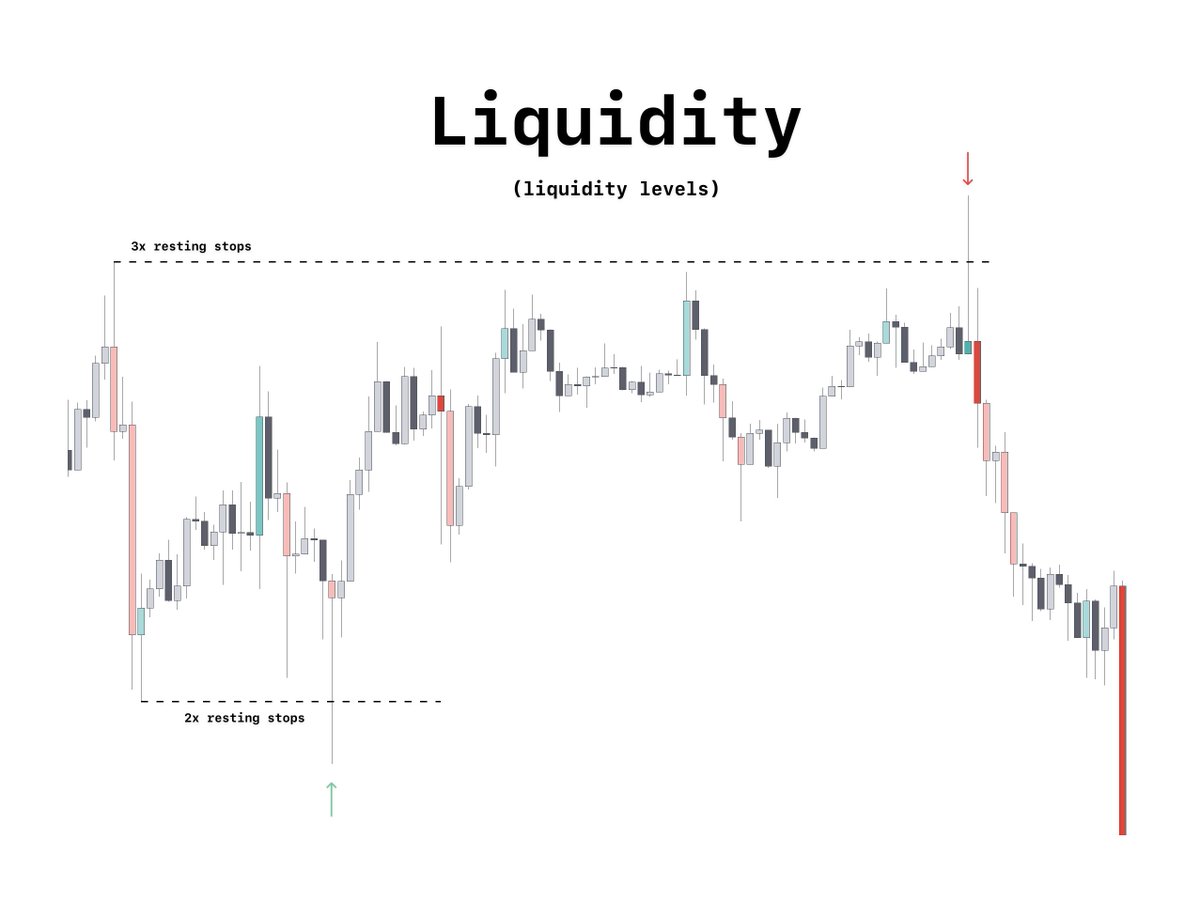
Liquidity Levels
a thread 🧵
a thread 🧵
this thread will cover the following:
- how I find my favorite liquidity levels
- indicators I use to aid in finding them
- session candles
- daily high/lows
- pivot rays
- preferred timeframes
- how I find my favorite liquidity levels
- indicators I use to aid in finding them
- session candles
- daily high/lows
- pivot rays
- preferred timeframes
pivot line indicator
a simple indicator I had made to suit my needs in marking out pivot/fractal highs and lows by extending the rays out.
a simple indicator I had made to suit my needs in marking out pivot/fractal highs and lows by extending the rays out.

pivot line indicator (2)
the concept -
look for a series of either higher lows or lower highs on this indicator which do the following:
- remain untapped
- are close together
- have a decent gap after them before the next swing pivot.
the concept -
look for a series of either higher lows or lower highs on this indicator which do the following:
- remain untapped
- are close together
- have a decent gap after them before the next swing pivot.

preferred time frames -
- 5m (scalpers)
- 15m (most used)
- 1h
- 4h
- daily (great M-HTF trades)
- 5m (scalpers)
- 15m (most used)
- 1h
- 4h
- daily (great M-HTF trades)
daily highs/lows
note - this does not show swing highs/lows
it shows each individual days daily high & low
I use these in a similar matter to the pivot lines
series of consecutive HLs or LHs followed by a gap
the last one of those consecutive h/ls offers a trade opportunity
note - this does not show swing highs/lows
it shows each individual days daily high & low
I use these in a similar matter to the pivot lines
series of consecutive HLs or LHs followed by a gap
the last one of those consecutive h/ls offers a trade opportunity

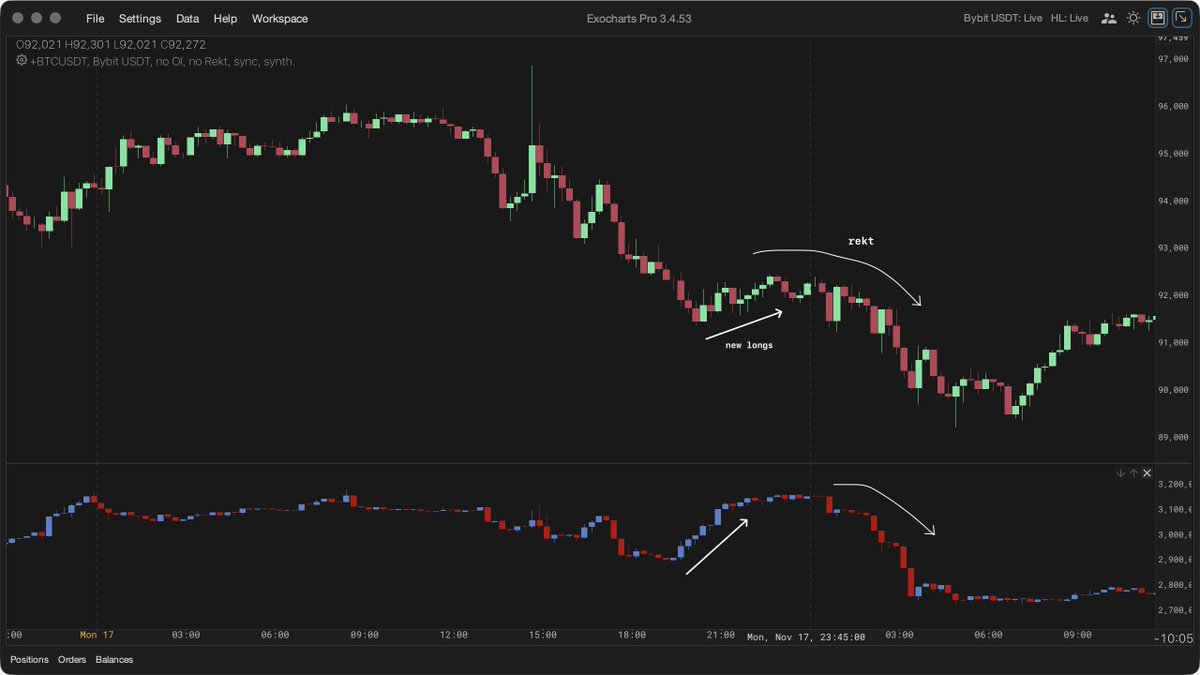
session candles
untested highs/lows from session candles are also really good resting liquidity points.
there is no ray possible for this currently
its the same concept just without visual rays
untested highs/lows from session candles are also really good resting liquidity points.
there is no ray possible for this currently
its the same concept just without visual rays

tpo poor highs/lows
2 blocks or more highs/lows on TPO profiles
- 50 tick on the inverse (BTC/USD) pair
when leaving poor highs/lows behind expect continuation/revisits of those levels
2 blocks or more highs/lows on TPO profiles
- 50 tick on the inverse (BTC/USD) pair
when leaving poor highs/lows behind expect continuation/revisits of those levels

BONUS
to RECEIVE everything
- TPO Chart
- Session candles
- liquidity indicator
option 1 - go through everything I've posted manually and try and find it somehow (you are welcome to do)
option 2 to RECEIVE - Follow, Like and reply to the original tweet of this thread
to RECEIVE everything
- TPO Chart
- Session candles
- liquidity indicator
option 1 - go through everything I've posted manually and try and find it somehow (you are welcome to do)
option 2 to RECEIVE - Follow, Like and reply to the original tweet of this thread
• • •
Missing some Tweet in this thread? You can try to
force a refresh