adam Profile picture
Aug 4, 2023 8 tweets 4 min read Read on X
I am happy to announce that the indicator I worked on with @leviathancrypto is now live on Tradingview and completely free.

Here is a short thread on how to use it.


/cont https://t.co/mBC3KVJtwNtradingview.com/script/lfbSiHI…
Image
Indicator colours the candles based on three conditions.

High volume, low volume and churn bars.

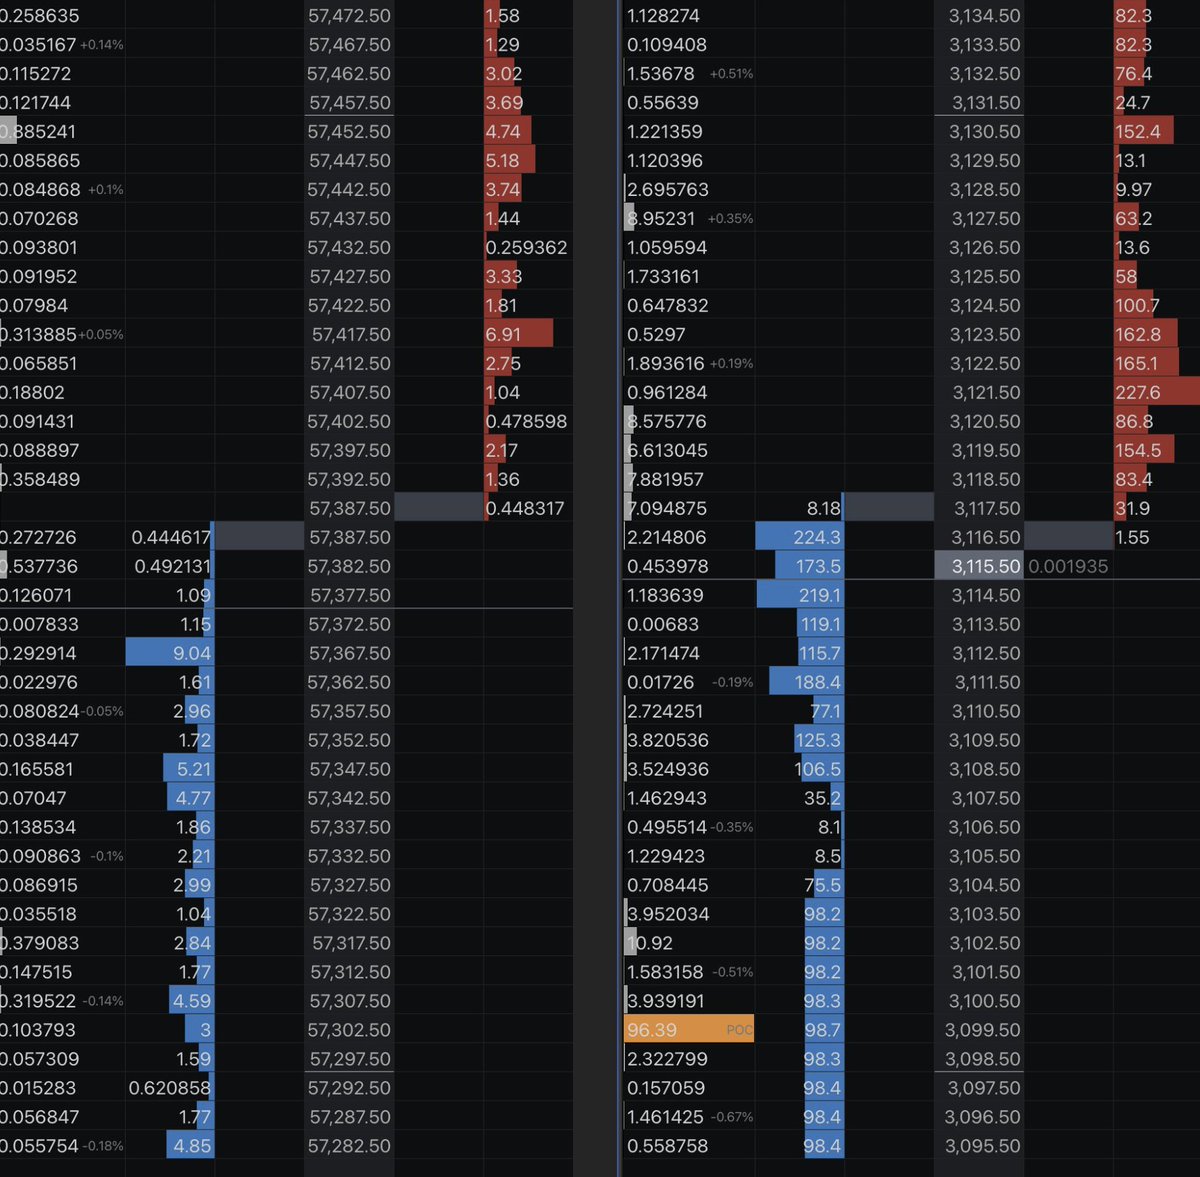
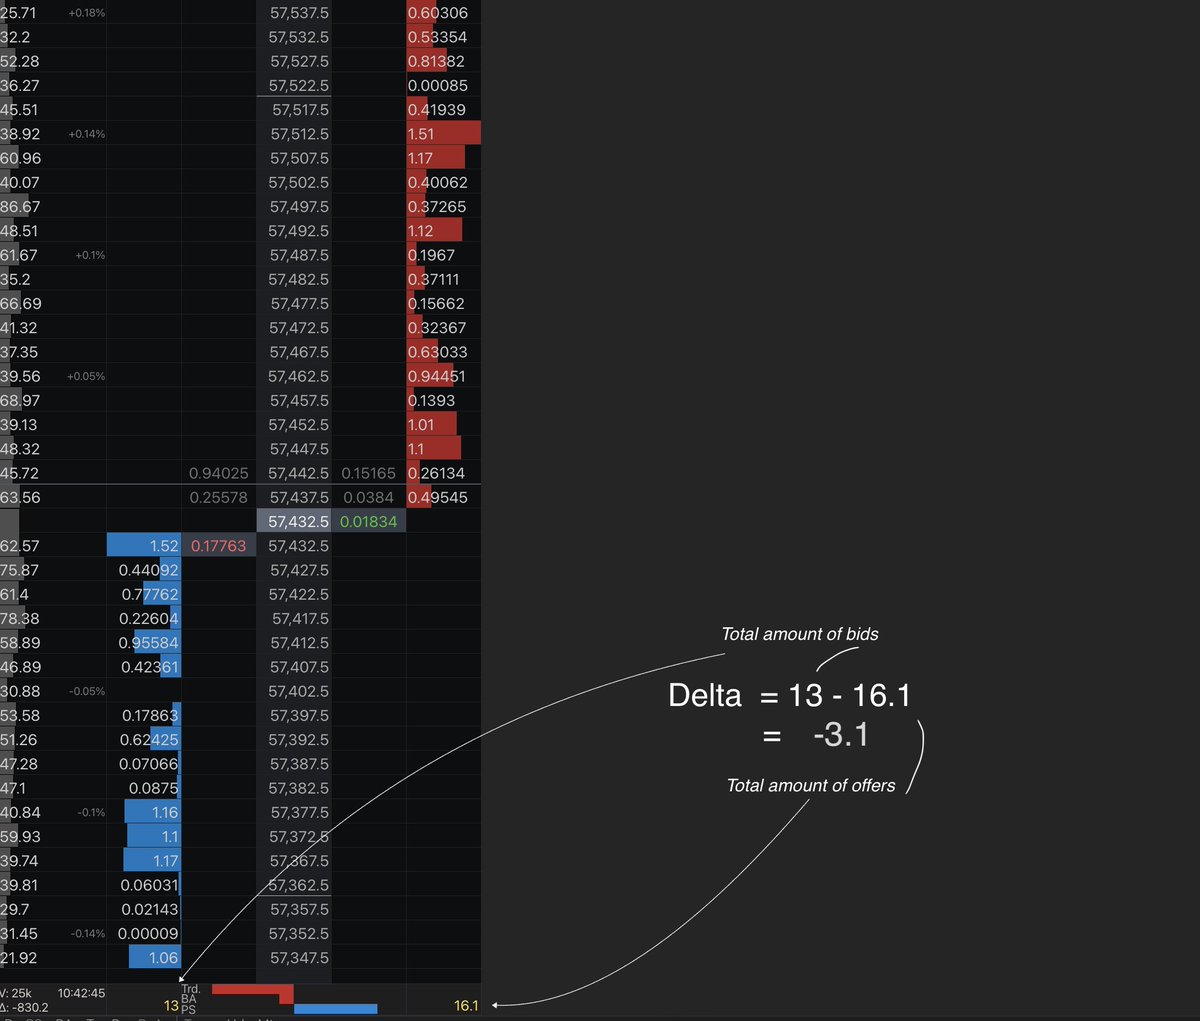
This is a "simplified" orderflow that I have been using for ages.

It is originally inspired b Emini watch https://t.co/ehuTTsb2caemini-watch.com/free-stuff/vol…
Image
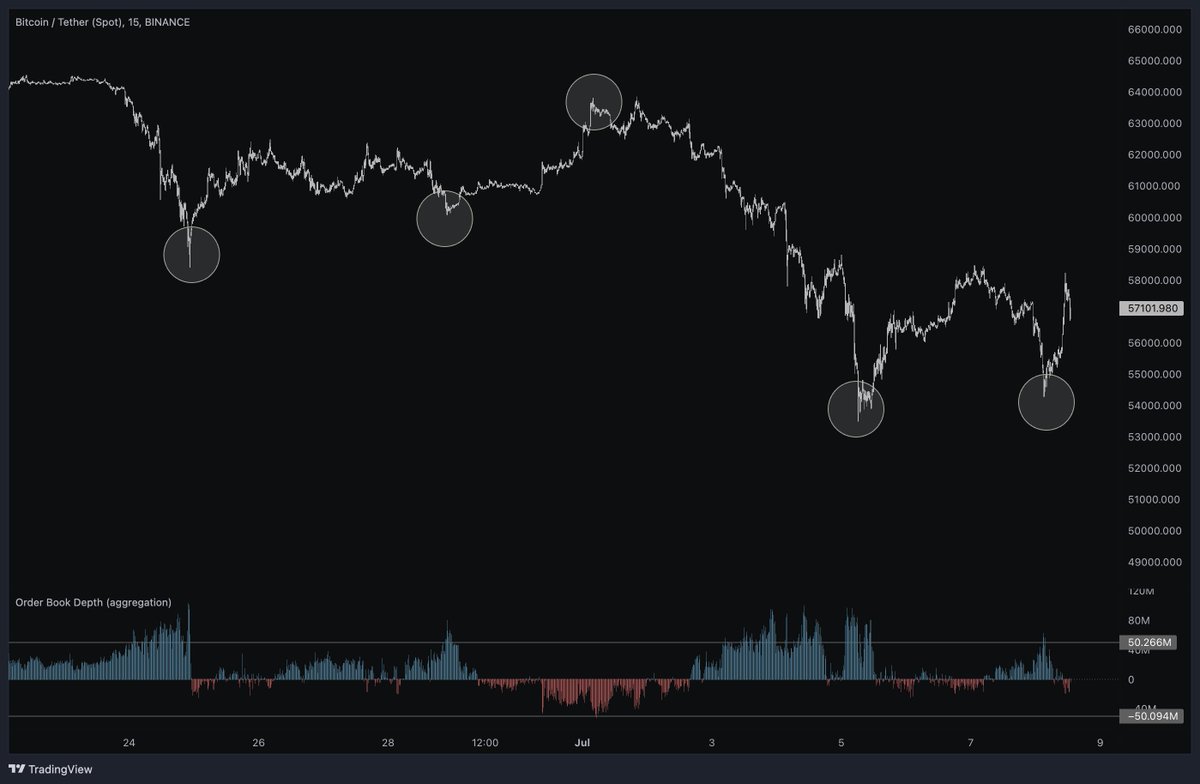
High relative volume tells us a large amount of buying or selling stepping-in wide-body candles.

This is an indication of either end of the move or the start of new trends.
Image
Image
High Volume often shows more of a retail participation as people ape in into wide-body candles. Churn bars also show high volume and signal start/end of moves but inside small body candles.

This means there was a more sophisticated execution to avoid large price changes. Image
Low-volume candles tell us there is a lack of participation. These are often the "weak spots" and work great as trade targets.
Image
Image
I published an article while ago that dives deeper into relative volume and you can find it here - tradingriot.com/volume-trading…
Although relative volume is a very useful indicator to have, it is not a standalone trading strategy. If you are interested in how I use it in my trading, you can check out the Tradingriot Bootcamp tradingriot.com/blueprint/trad…
Once again, thanks @leviathancrypto for the collaboration and make sure to check out his long list of indicators.

I use many of them and they are one of the best (and completely free) you will find. Image

• • •

Missing some Tweet in this thread? You can try to force a refresh
 

Keep Current with adam

adam Profile picture

Stay in touch and get notified when new unrolls are available from this author!

Read all threads

This Thread may be Removed Anytime!

PDF

Twitter may remove this content at anytime! Save it as PDF for later use!

Try unrolling a thread yourself!

how to unroll video
  1. Follow @ThreadReaderApp to mention us!

  2. From a Twitter thread mention us with a keyword "unroll"
@threadreaderapp unroll

Practice here first or read more on our help page!

More from @abetrade

Dec 20, 2025
fintwit is flooded with the retail trader / quant discussion now.

I have been reading some of the threads and figured out why not to share some things or areas to look at as a filthy bottom of the barel click trader which make money
I'm gonna start by saying that trading sucks, it's hard, and things constantly change and stop working (especially in less liquid markets where you should be looking at).

Funnily enough, one of the original "retail should never trade" posts mentioned that people should buy index funds instead, which is honestly advice I give to people as well, but if you want to give things a spin, here we go
(day) trading the most liquid markets such as ES or NQ futures, Forex, Gold, etc., is what I think a lot of these kwant posts are aimed at. While you can make money day trading these markets, this is honestly incredibly hard.

This, unfortunately, is what all of the content evolves around these days as day trading makes money quickly, drives affiliate volume for exchanges and prop firms, etc.

If you ever decide to do this, keep in mind that you are truly competing with some of the smartest people, and you have very little edge, if any, in these markets.

Trading a lot also means you pay a lot in commissions, which is not always great and can very easily make your whole strategy unprofitable.
Read 9 tweets
Feb 28, 2025
Compared to traditional futures or forex, one of the biggest advantages of trading crypto is the transparency of data.

Data that often costs hundreds of dollars per month in traditional finance is available in crypto for free or at a fraction of the cost.

This thread will cover one of my favorite tools—the order book data.

/contImage
what is order book data

Simply put, order book data shows the orders that are currently resting in the order books.

One of the most popular uses of this data that I’ve seen over the years is heatmaps.

These charts visualize limit orders directly on the price chart, often using gradient colors to represent the concentration of resting orders at different price levels.

In my opinion, while heatmaps can be useful at times, they tend to draw too much attention to individual orders, many of which may just be spoofs—orders placed with no real intention of being filled.Image
Image
order book as supply and demand indicator

In my opinion, a much better use of order book data is analyzing who has the heavier hand by looking at delta imbalance—the difference between resting buy limit orders and resting sell limit orders.

Luckily, you don’t have to calculate this delta manually by analyzing the order book, as many platforms provide it as an indicator.

Here’s a chart example from In my opinion, a much better use of order book data is analyzing who has the heavier hand by looking at delta imbalance—the difference between resting buy limit orders and resting sell limit orders..

As you can see, when the delta between limit buyers and sellers becomes significant, we often see price reversals due to the large presence of supply or demand in the market.Image
Image
Read 6 tweets
Feb 18, 2025
Open interest can provide valuable insights into market positioning, but I often see it misinterpreted online.

This thread will break down everything you need to know about OI in a quick and straightforward way. Image
Open Interest Definition

Open interest does not mean that people are openly interested in the market. Instead, it measures the number of outstanding contracts in a given market.

In other words, it tracks the positions that are still open and have not yet been closed.

In the simplest terms:

Open interest increasing = traders are opening new positions.
Open interest decreasing = traders are closing positions.

The biggest mistake I often see online is the claim that markets move because "there are more buyers than sellers."

This is not true. For every buyer, there must be a seller, and vice versa, meaning all positions are always matched 1:1.

So, why does open interest change if every trade has both a buyer and a seller?

The reason is that not everyone in the market is trading directionally. Delta-neutral participants, such as market makers, do not speculate on price movements—they simply provide liquidity.

Because of this, you can think of open interest as a measure of directional positions in the market.Image
Open Interest as an Indicator

Open interest is plotted as a running indicator in a separate panel below the price chart.

It is available on all popular charting platforms such as TradingView, Velo, TradingLite, and others.

We observe large changes in open interest, which can signal potential breakouts or the end of a move.

As you can see on the chart below, a significant rise in open interest while the price barely moves upward indicates that many directional longs have entered the market. If that’s the case, the price should be trading much higher.

This happens because someone on the opposite side is filling passive sell orders into rising prices. This could occur either on the same exchange or in the spot market.Image
Read 7 tweets
Feb 14, 2025
As with most aspects of trading, order flow has been heavily over-marketed over the years by many as a so-called "hidden grail" that will unlock secret insights and make you profitable overnight.

This often comes with absurd price tags and overly complicated explanations.

This thread will teach you the most important concepts of order flow trading in just a few minutes.Image
So, what is order flow trading?

Simply put, it is the study of the relationship between limit and market orders.

Most of the focus is on market orders, as they are the ones actually executed in the live market, while limit orders often act more like advertisements in the order book.Image
While, in its simplest form, you can see limit and market orders on the depth of market (DOM), making trading decisions based solely on that is extremely difficult—if not nearly impossible.

This is especially true in thin markets like crypto, but in reality, all markets have become much thinner over the years, increasingly dominated by market makers (MMs), high-frequency traders (HFTs), and overall market noise.

Before we continue, keep in mind that all of these tools and concepts are only viable for short-term trading. Anything plotted on a higher timeframe is just misleading.
Read 12 tweets
Feb 10, 2025
Over the last few years, there has been a significant shift in Bitcoin market participation.

The BitMEX era of wild volatility spikes and relentless stop runs is long gone, replaced by a market shaped by more sophisticated participants.

This thread will cover tools that can help you make more informed decisions across emerging derivatives—some of which you might not even be aware of.Image
Commitment of Traders

The COT (Commitments of Traders) report is a weekly publication by the CFTC that breaks down the positioning of different market participants in futures markets, this report can give you valuable insights into the positioning.

In Bitcoin futures that are traded on CME, the main participants are:

Commercials (Hedgers): Institutions like miners and large firms using futures to hedge price risk.

Non-Commercials (Large Speculators): Hedge funds and asset managers trading for profit, often trend-followers.

Non-Reportables (Small Speculators): Retail traders and smaller players who are not required to report their positions to CFTC.Image
Although the COT report for Bitcoin futures has been available since 2017, when BTC futures launched on the CME, it only became significantly relevant after October 2023, when open interest nearly tripled.

The best way to use the COT report is not by looking at the running total of positions but rather by using normalized indicators that provide a much clearer view of positioning.

While behaviors vary across markets, the general approach is to trade in the same direction as Commercials while fading Speculators and Non-Commercials.

Small speculators and non-commercials typically bet on trends but are often forced to exit when they are wrong, which drives prices in the opposite direction due to position covering.Image
Read 13 tweets
Feb 6, 2025
Orderblocks are probably one of the most popular and over-marketed concepts regarding price action trading.

Supply and demand zones, orderblocks, bases, clusters and millions of other names are floating around the internet, usually hidden behind the paywalls.

This thread will explain everything you need to know about them so you can start using them in your trading without paying for anything.Image
First, there is absolutely zero magic voodoo manipulation reasoning why prices react from these levels.

The market is going up from the demand zone and down from the supply zone because large traders that move prices accumulate their positions slowly.

If you want to accumulate a significant position, you can't just buy or sell wherever you want; you need to do it in an area with enough liquidity to avoid slippage.

These liquid areas are often seen as sideways price action where there is enough two-way auction (plenty of buying and selling).Image
The optimal condition for large traders to buy is when a significant amount of traders are selling simultaneously.

That way, they will ensure the best possible entry since there are plenty of counterparties for their orders in the market.

To drive this point forward, we can use a cumulative volume delta, which shows executed market orders.

As you can see, there was a lot of market selling while the market went sideways and also on the retracement.

Why did the market not go down? Large traders were buying into sell orders until they were completely absorbed.Image
Read 7 tweets

Did Thread Reader help you today?

Support us! We are indie developers!


This site is made by just two indie developers on a laptop doing marketing, support and development! Read more about the story.

Become a Premium Member ($3/month or $30/year) and get exclusive features!

Become Premium

Don't want to be a Premium member but still want to support us?

Make a small donation by buying us coffee ($5) or help with server cost ($10)

Donate via Paypal

Or Donate anonymously using crypto!

Ethereum

0xfe58350B80634f60Fa6Dc149a72b4DFbc17D341E copy

Bitcoin

3ATGMxNzCUFzxpMCHL5sWSt4DVtS8UqXpi copy

Thank you for your support!

Follow Us!

:(