Forming a Daily Bias
a thread 🧵
a thread 🧵
In this thread, I will cover the following:
- some MS points
- using stats to help my bias
- directional bias through liquidity
- some MS points
- using stats to help my bias
- directional bias through liquidity
market structure
2 timeframes
- 1h
- 15m
(depending on the type of trader you are)
uptrending
downtrending
rangebound
identifying swing points can be done either using manual lookback or via williams fractal indicator (set to 2 on either side of the swing high)
2 timeframes
- 1h
- 15m
(depending on the type of trader you are)
uptrending
downtrending
rangebound
identifying swing points can be done either using manual lookback or via williams fractal indicator (set to 2 on either side of the swing high)

market structure (2)
notes -
majority of the time price will be within the "rangebound" category.
breaking that "rangebound" environment then deciphers the trending move you are given
notes -
majority of the time price will be within the "rangebound" category.
breaking that "rangebound" environment then deciphers the trending move you are given

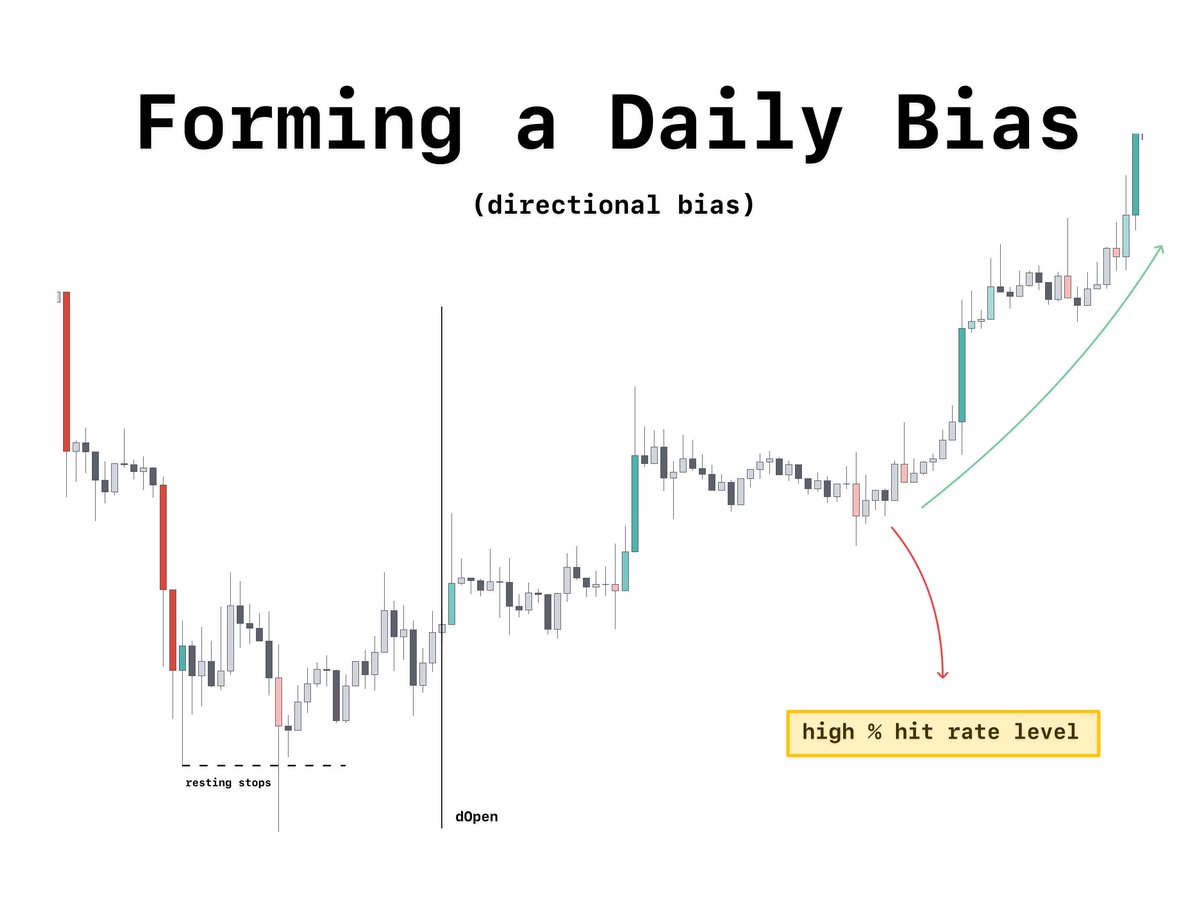
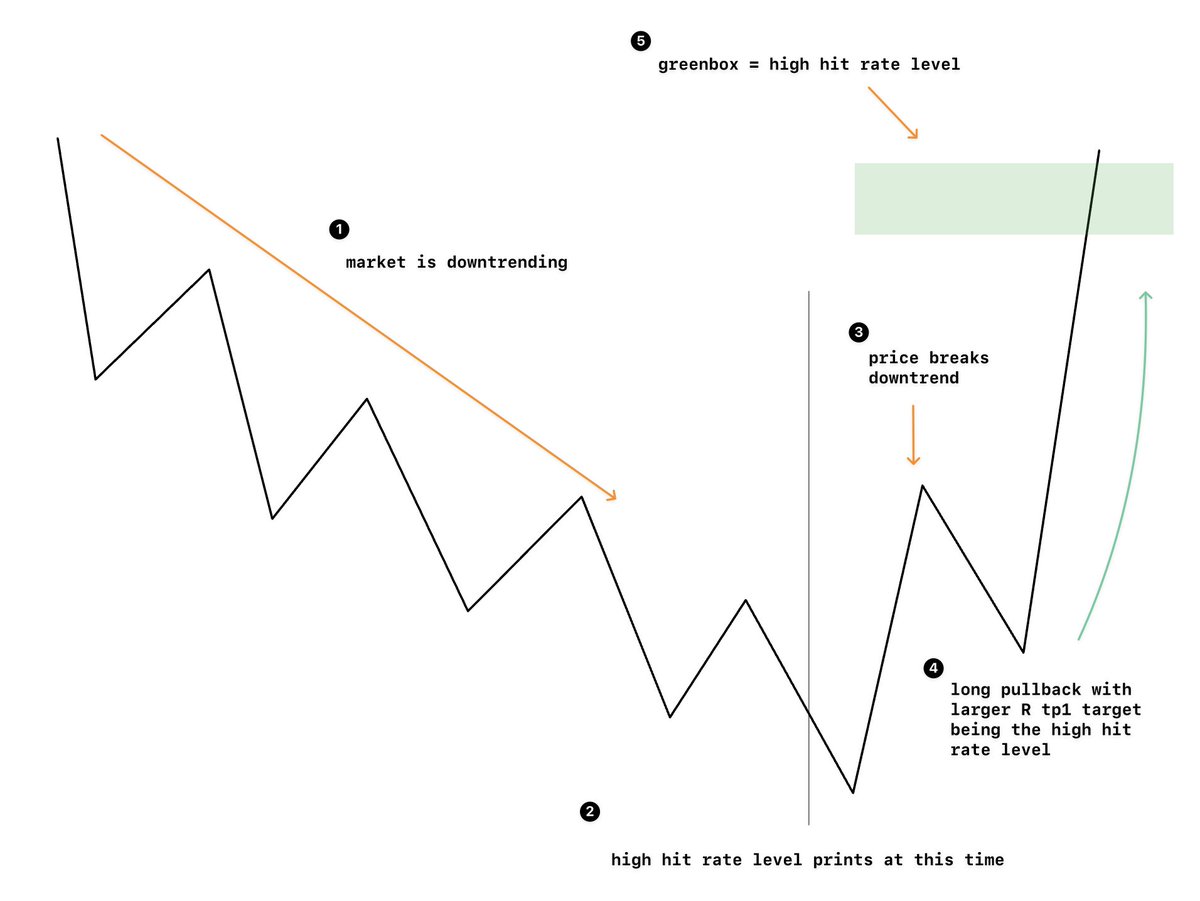
high hit rate levels
- level(s) that reset after a certain period (generally daily) which gives me some form of directional bias whether they are below or above price when printed.
- level(s) that reset after a certain period (generally daily) which gives me some form of directional bias whether they are below or above price when printed.

high hit rate levels (2)
confluence
the most powerful thing is to use this with is Market structure, below is an exact example of how I would do so.
on a day as such my directional bias would be to look for longs.
confluence
the most powerful thing is to use this with is Market structure, below is an exact example of how I would do so.
on a day as such my directional bias would be to look for longs.
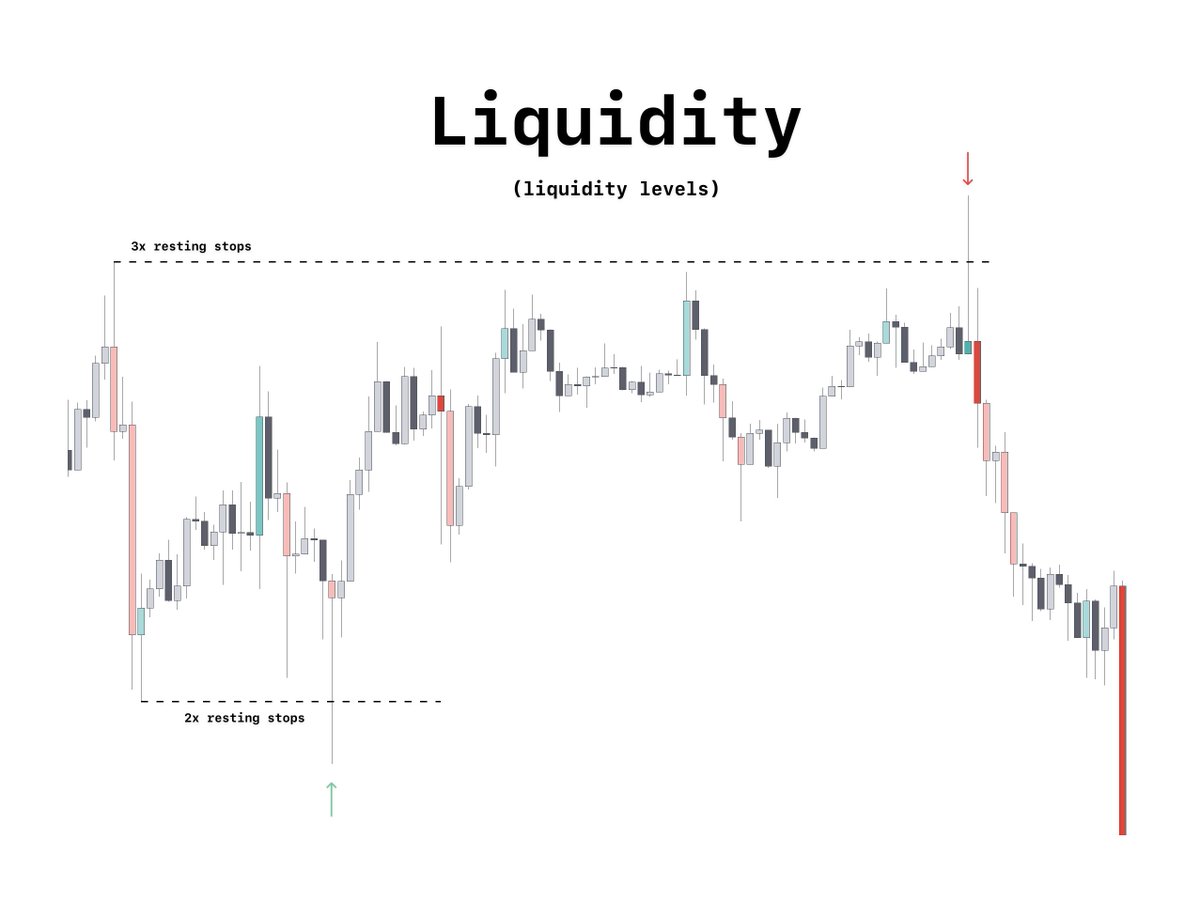
liquidity
resting liquidity is important
if I see there is more resting liquidity on one end of a range over another I would favour that direction for my bias.
resting liquidity is important
if I see there is more resting liquidity on one end of a range over another I would favour that direction for my bias.

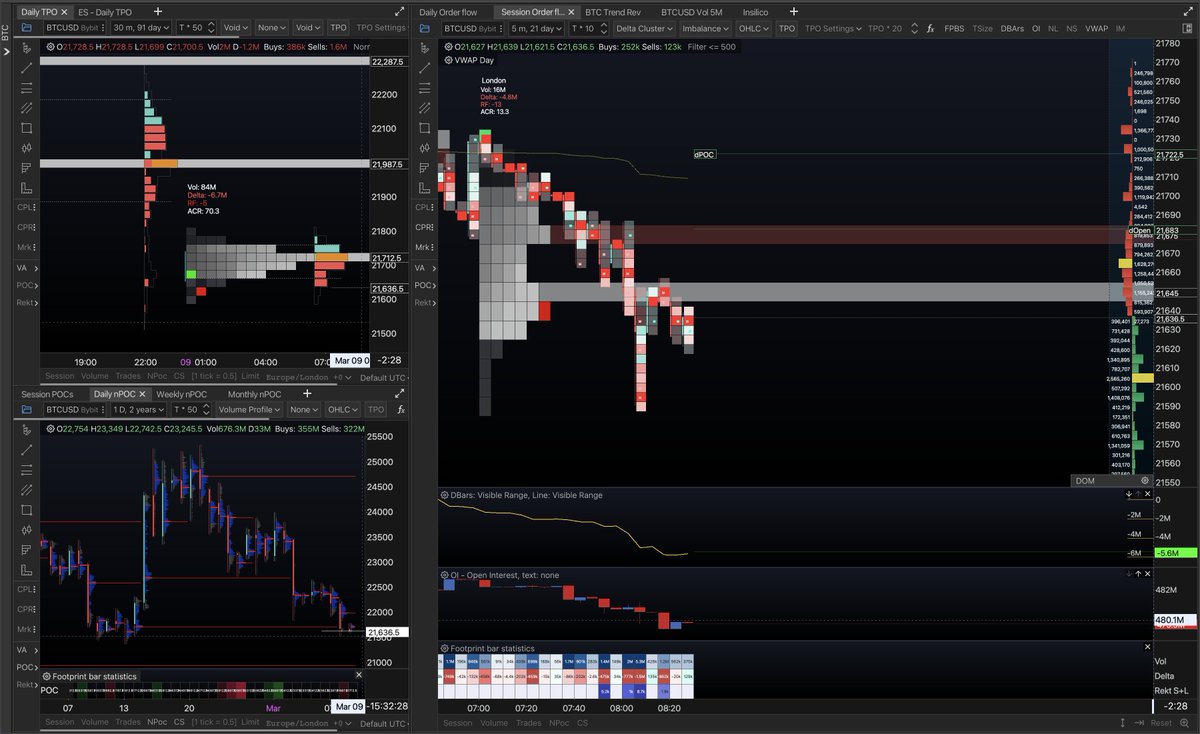
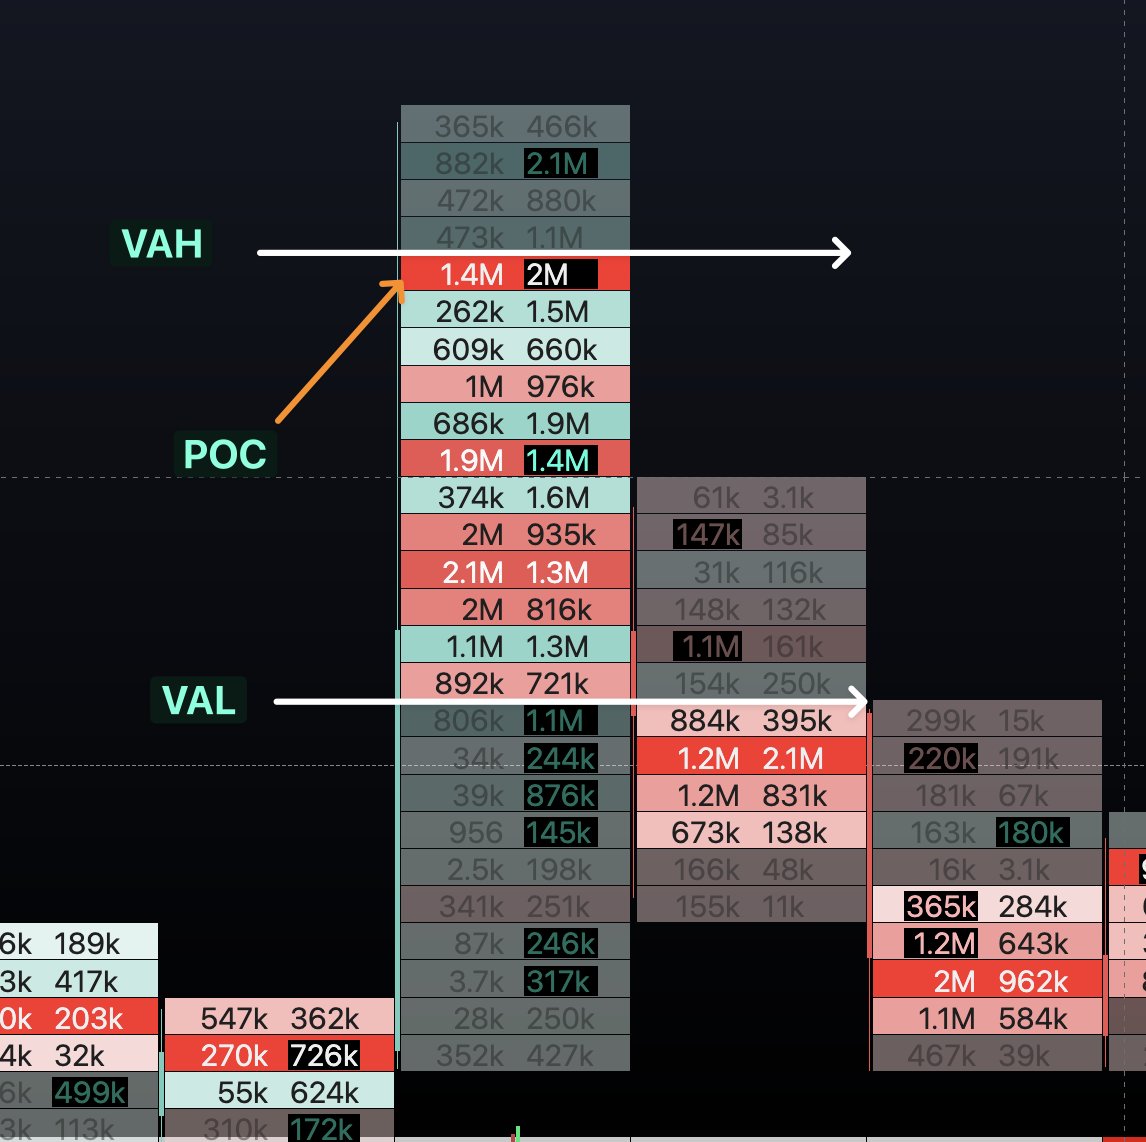
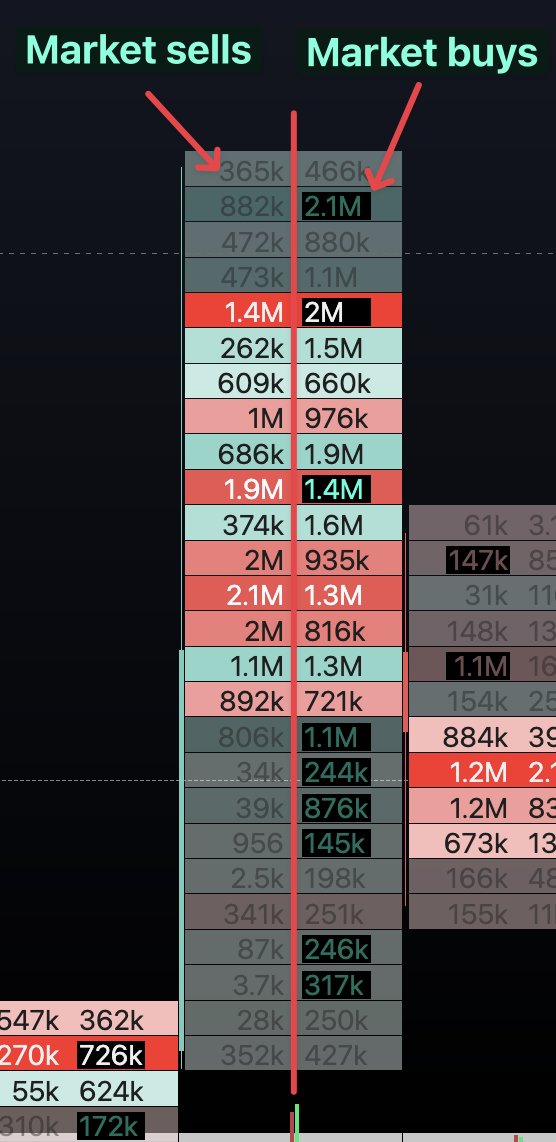
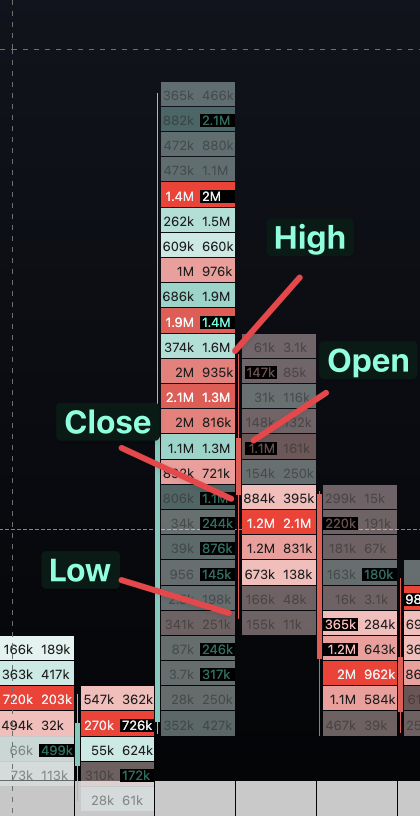
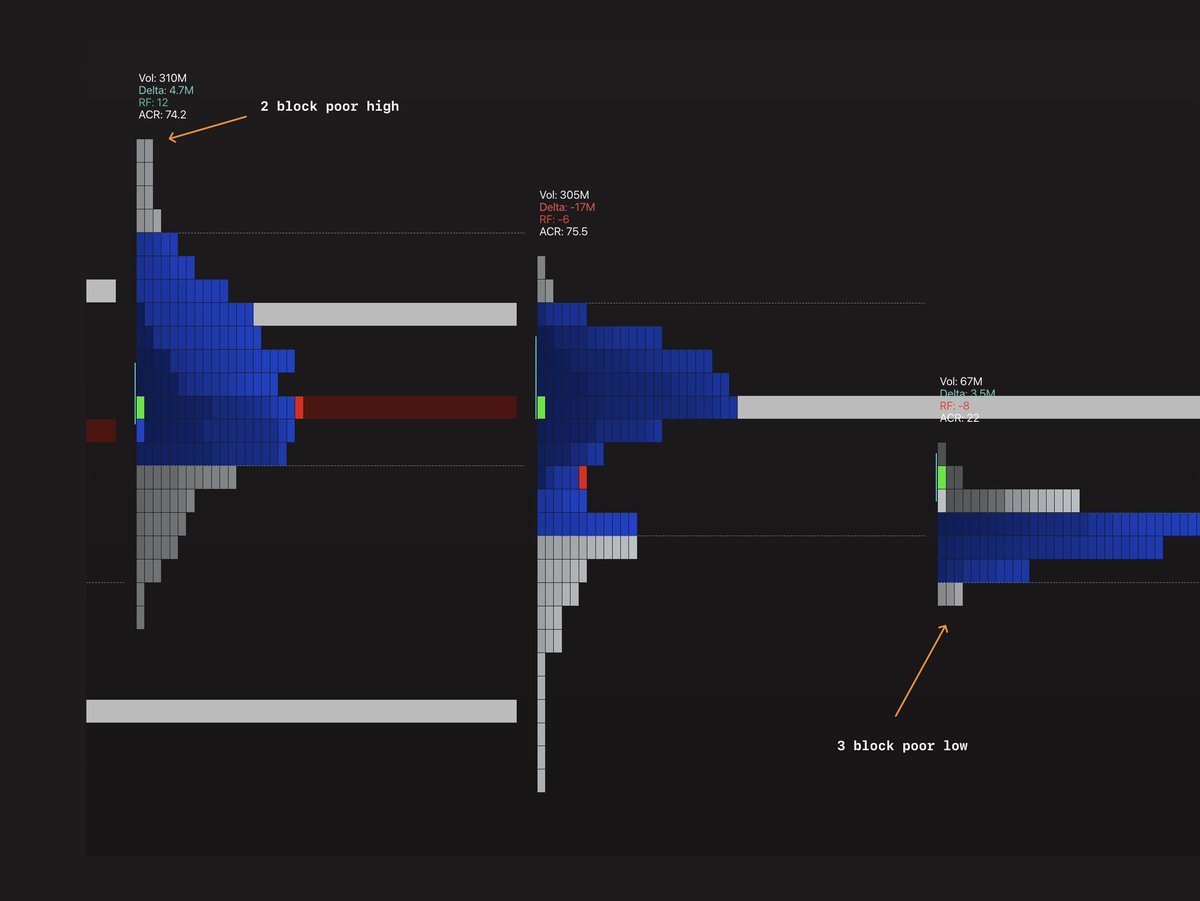
poor highs/lows
routine check - simply I check my 50tick BTC/USD TPO chart
if there are more than 2 or more blocks at either a high/low then i classify that as a poor H/L
This is typically part of my liquidity routine and these levels have a higher likelihood of being tested.
routine check - simply I check my 50tick BTC/USD TPO chart
if there are more than 2 or more blocks at either a high/low then i classify that as a poor H/L
This is typically part of my liquidity routine and these levels have a higher likelihood of being tested.
combination
resting liquidity - below price
high hit rate level - below price
poor highs/lows - below price
I would be favoring shorts that day
and visa versa
resting liquidity - below price
high hit rate level - below price
poor highs/lows - below price
I would be favoring shorts that day
and visa versa
finding high hit rate levels
in the future, I will share some of mine, currently they do give me too much of an edge to release
what I suggest is to think about levels you generally feel would be revisited then put the work in and get direct figures on a trial-and-error basis
in the future, I will share some of mine, currently they do give me too much of an edge to release
what I suggest is to think about levels you generally feel would be revisited then put the work in and get direct figures on a trial-and-error basis
hope you found this valuable, likes and retweets are appreciated
Let me know below what thread you would like to see next 👇
Let me know below what thread you would like to see next 👇
• • •
Missing some Tweet in this thread? You can try to
force a refresh