**LONE STAR STAKES**
A Deep Dive Analysis of Texas’ 17 Political Regions
Part 2: GREATER HOUSTON
TL;DR:
While still reliably red, Greater Houston shifted hard left the last two cycles. Its increasingly educated & racially diverse population bodes well for further Dem gains
🧵 https://t.co/uPHRnczfC3

A Deep Dive Analysis of Texas’ 17 Political Regions
Part 2: GREATER HOUSTON
TL;DR:
While still reliably red, Greater Houston shifted hard left the last two cycles. Its increasingly educated & racially diverse population bodes well for further Dem gains
🧵 https://t.co/uPHRnczfC3
https://twitter.com/admcrlsn/status/1685360231381901312
*Geography*
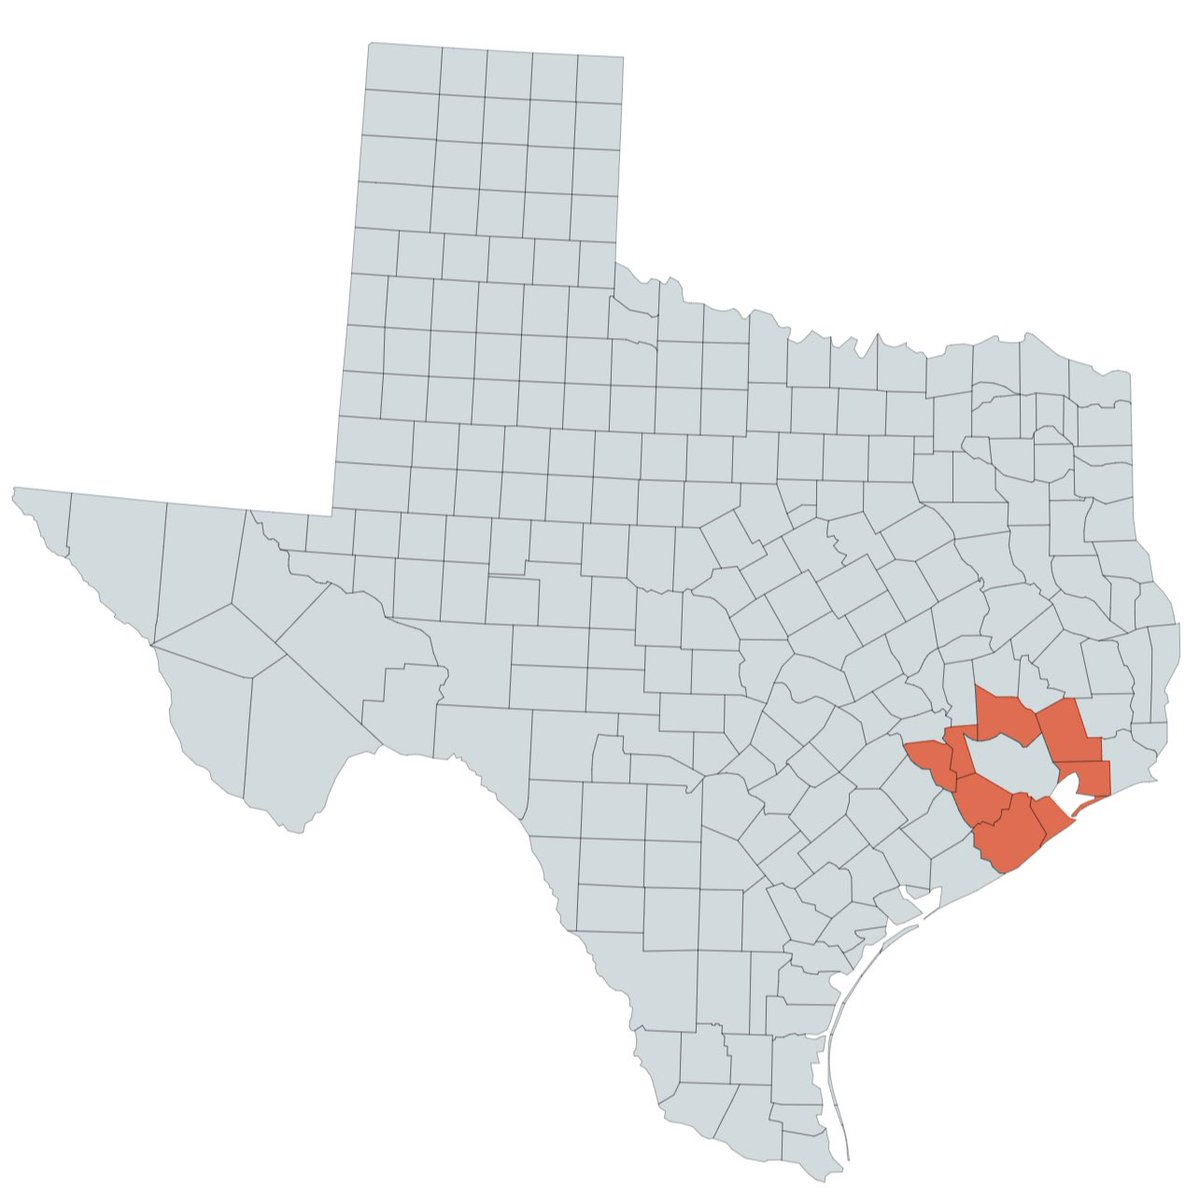
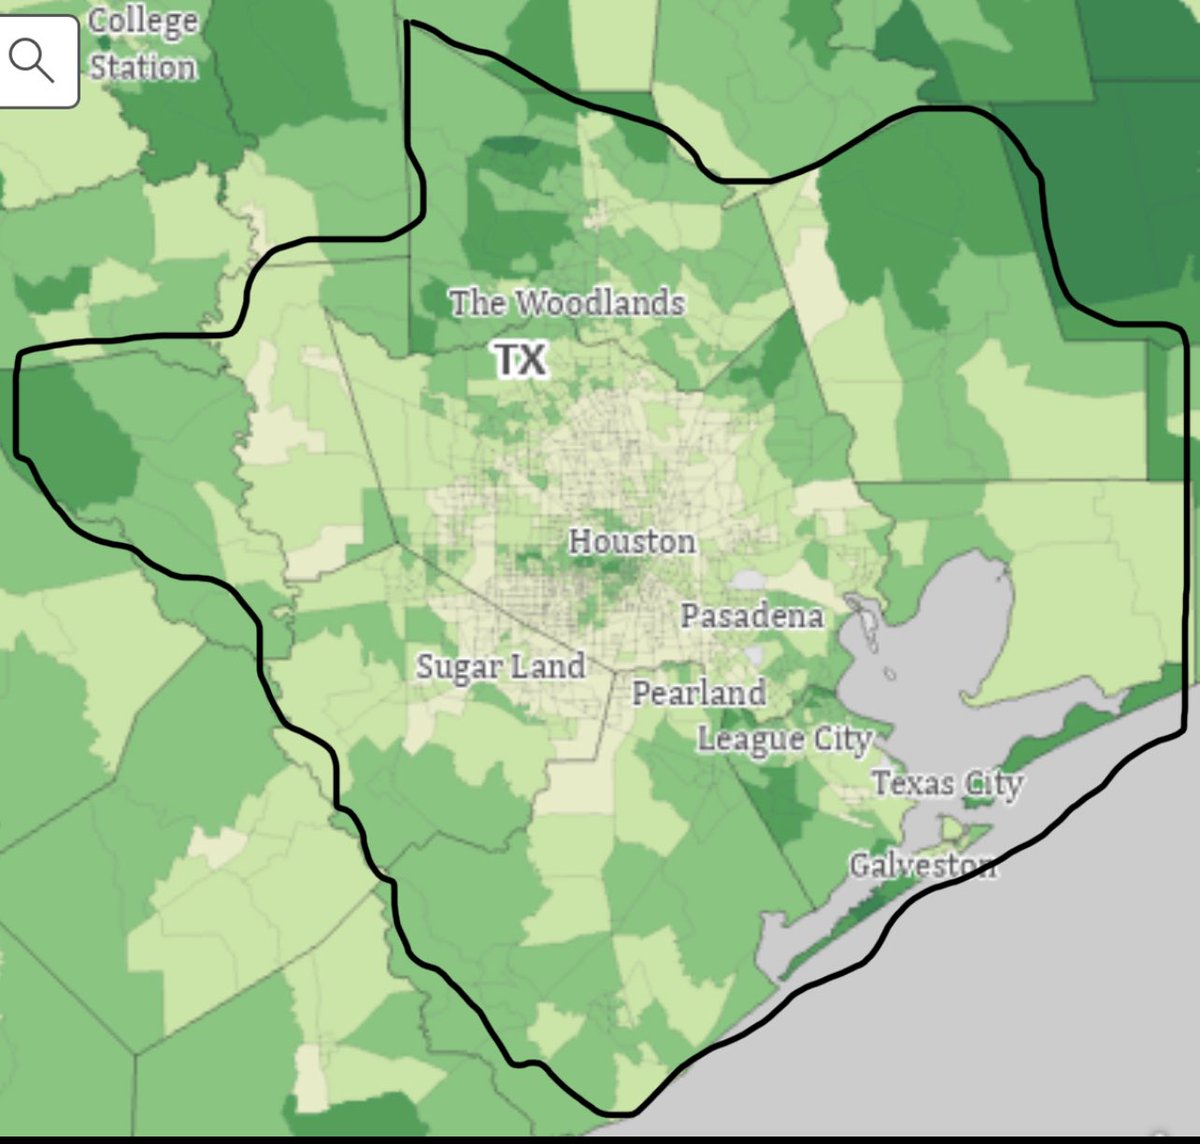
Greater Houston (the Houston-The Woodlands-Sugar Land metropolitan area excluding Harris County) is comprised of 8 largely suburban counties surrounding Harris County.
(Pardon the rough hand-drawn lines throughout this thread, I drew them on my phone)
Greater Houston (the Houston-The Woodlands-Sugar Land metropolitan area excluding Harris County) is comprised of 8 largely suburban counties surrounding Harris County.
(Pardon the rough hand-drawn lines throughout this thread, I drew them on my phone)
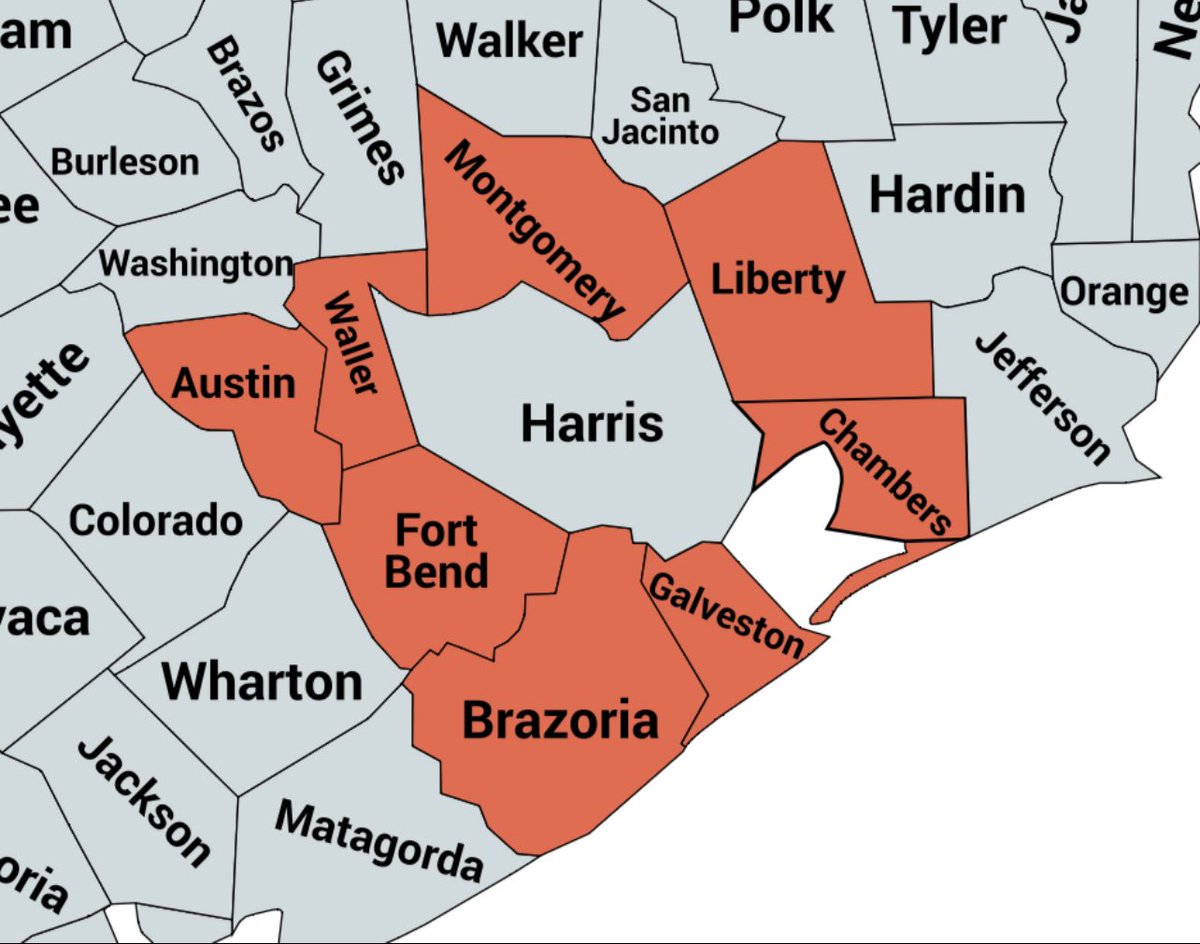
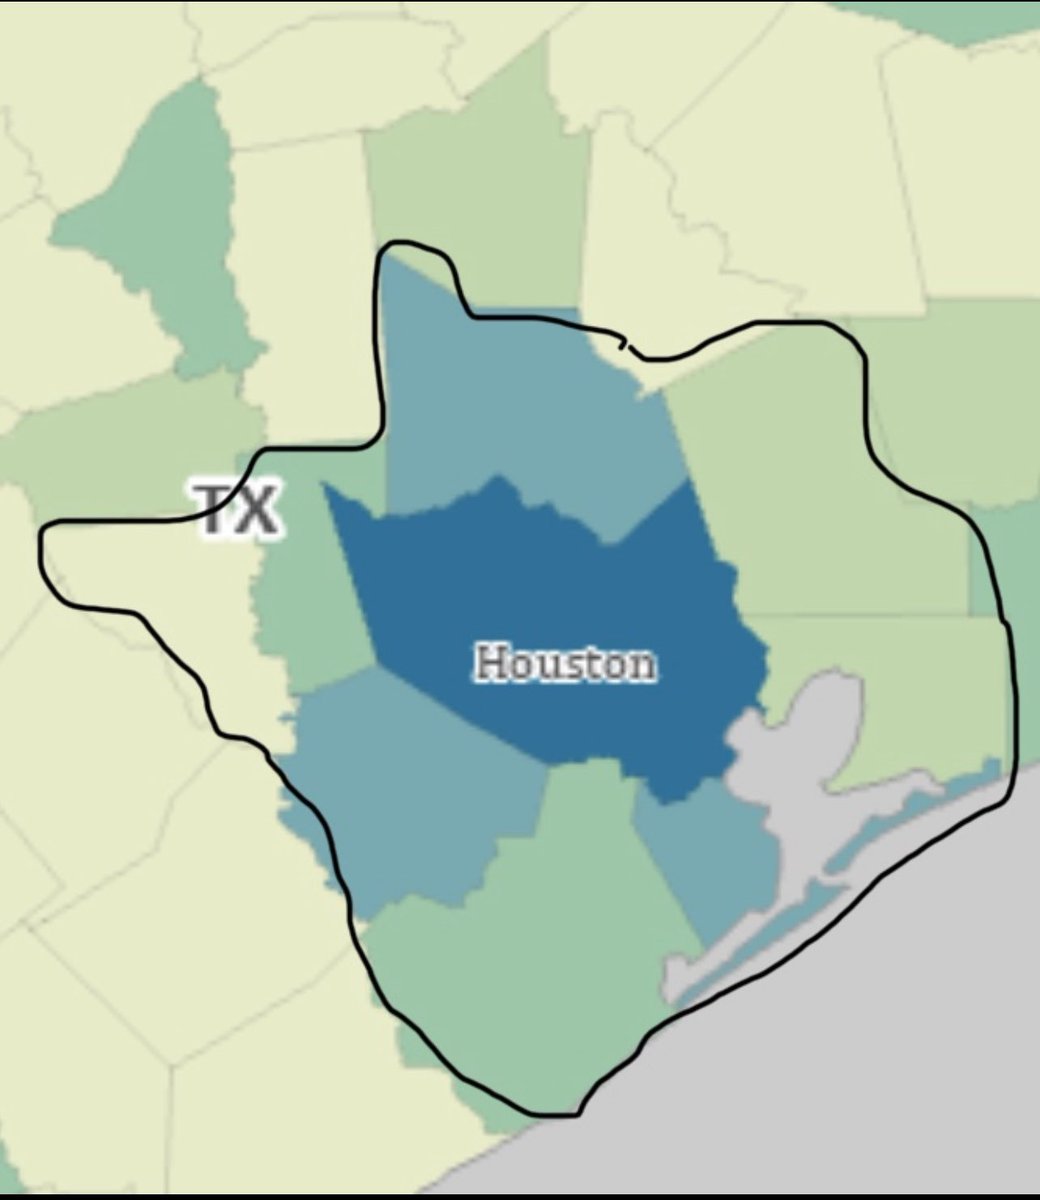
~35% of its population lives in Fort Bend County (Sugar Land/Missouri City) to the SW
~26% in Montgomery County (The Woodlands/Conroe) to the north
~15% in Galveston County (League City/Texas City/Galveston) to the SE
~15% in Brazoria County (Pearland) to the south
~26% in Montgomery County (The Woodlands/Conroe) to the north
~15% in Galveston County (League City/Texas City/Galveston) to the SE
~15% in Brazoria County (Pearland) to the south
*Demographics: Race/Ethnicity*
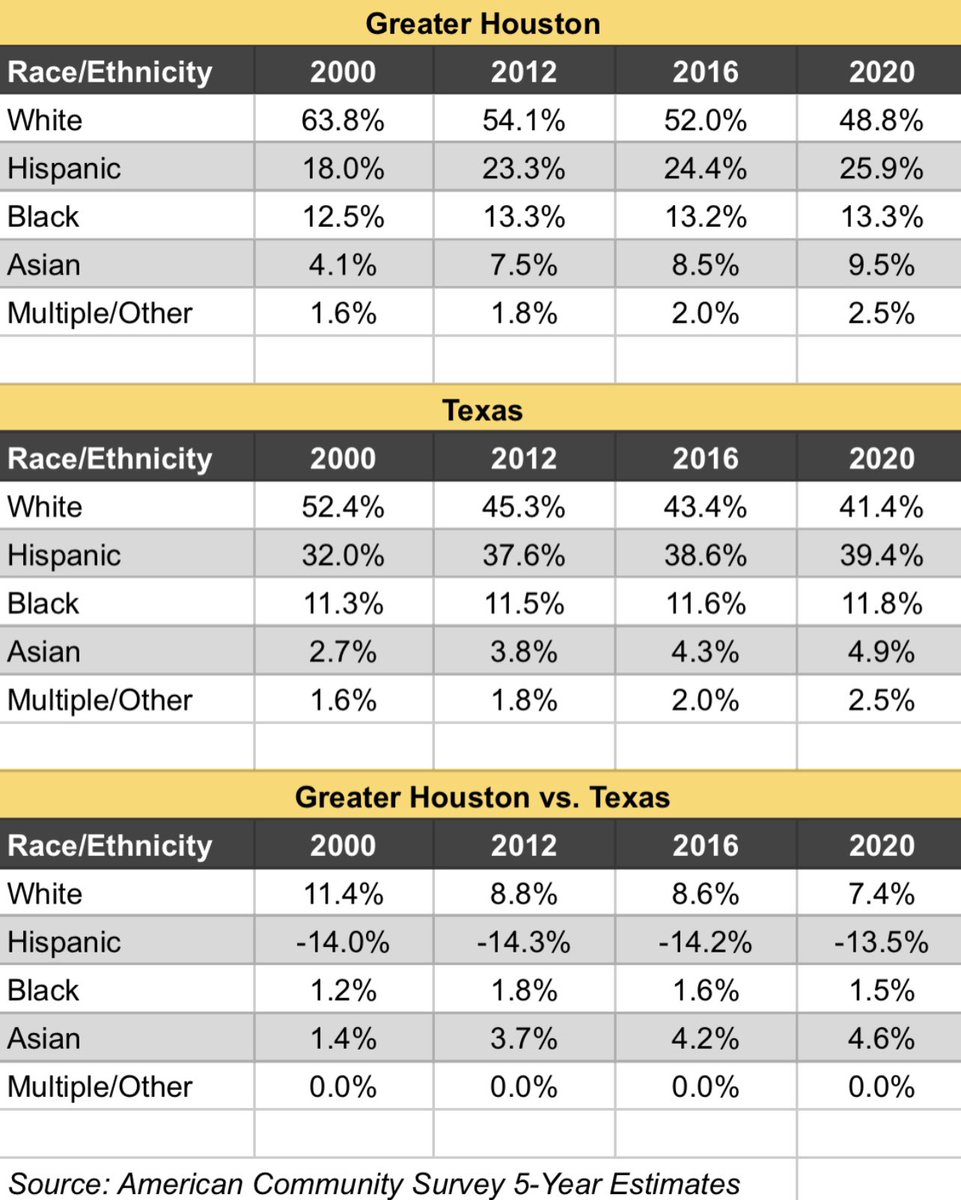
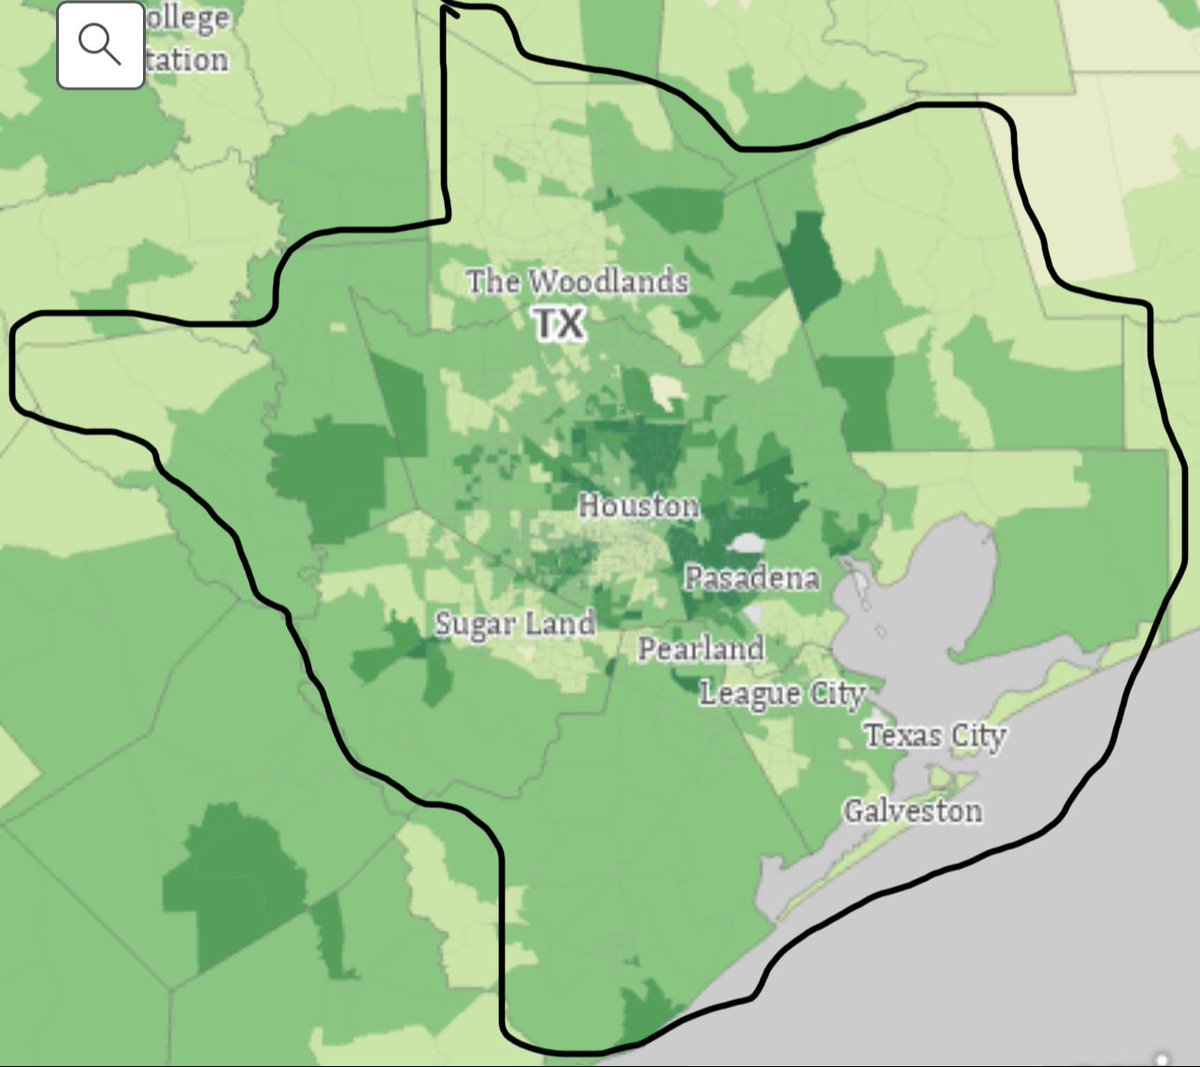
Greater Houston is just under 50% White, ~25% Latino, ~13% Black & ~10% Asian.
In 2020, it was 7.5 pts more White, 13.5 pts less Latino, 1.5 pts more Black & 4.5 points more Asian than TX as a whole.
Greater Houston is just under 50% White, ~25% Latino, ~13% Black & ~10% Asian.
In 2020, it was 7.5 pts more White, 13.5 pts less Latino, 1.5 pts more Black & 4.5 points more Asian than TX as a whole.
Fort Bend County, the most populous and fastest growing in the region, has the highest share of people or color (68%, up from 54% in 2000).
The other counties in the region are also becoming more racially diverse, but at varying rates.
The other counties in the region are also becoming more racially diverse, but at varying rates.
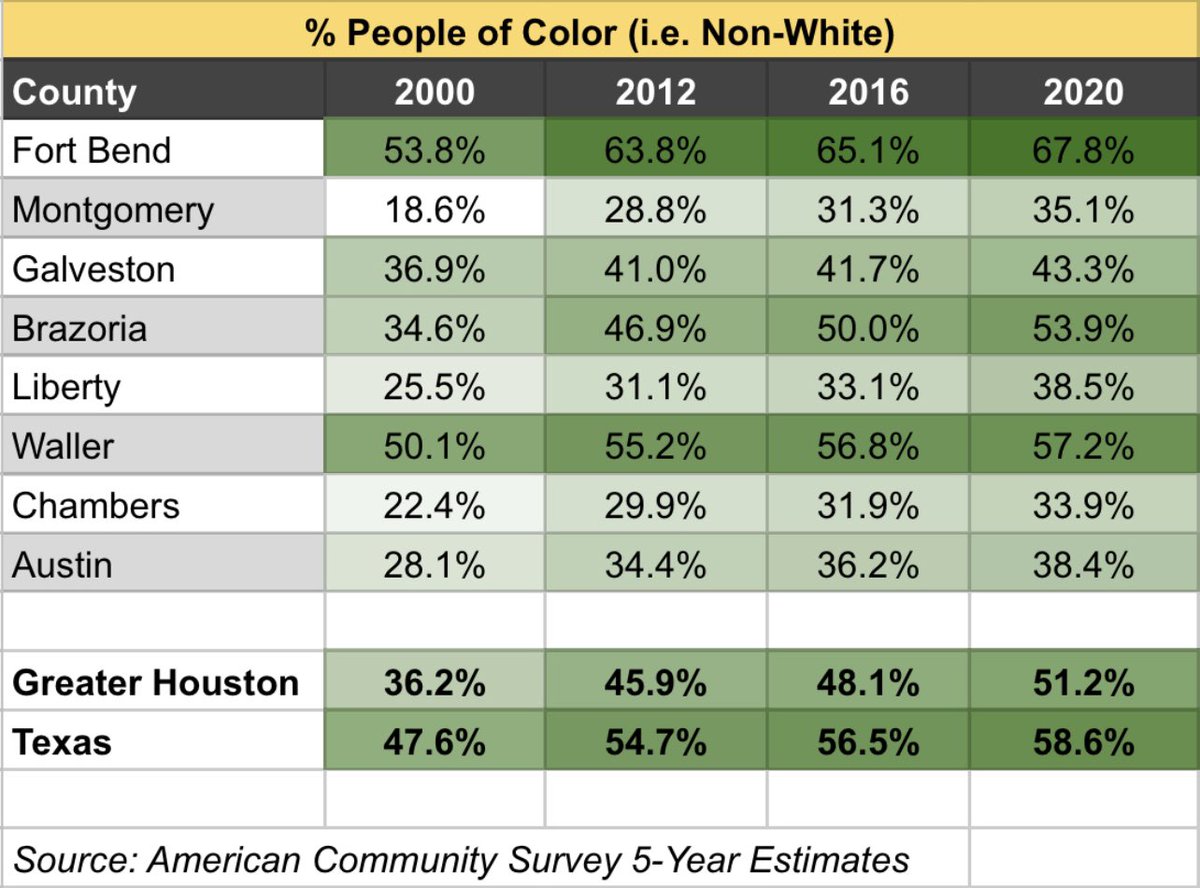
Its share of White residents has been declining at a faster rate than TX’s since 2012.
Montgomery County (anchored by The Woodlands) & the more sparsely populated counties (Austin, Chambers, Liberty, Waller) have the highest shares of White residents (all 60%+ White in 2020).
Montgomery County (anchored by The Woodlands) & the more sparsely populated counties (Austin, Chambers, Liberty, Waller) have the highest shares of White residents (all 60%+ White in 2020).
Its share of Latino residents has been growing at a slightly faster rate than TX’s since 2012, due to a sizable jump from 2016 to 2020
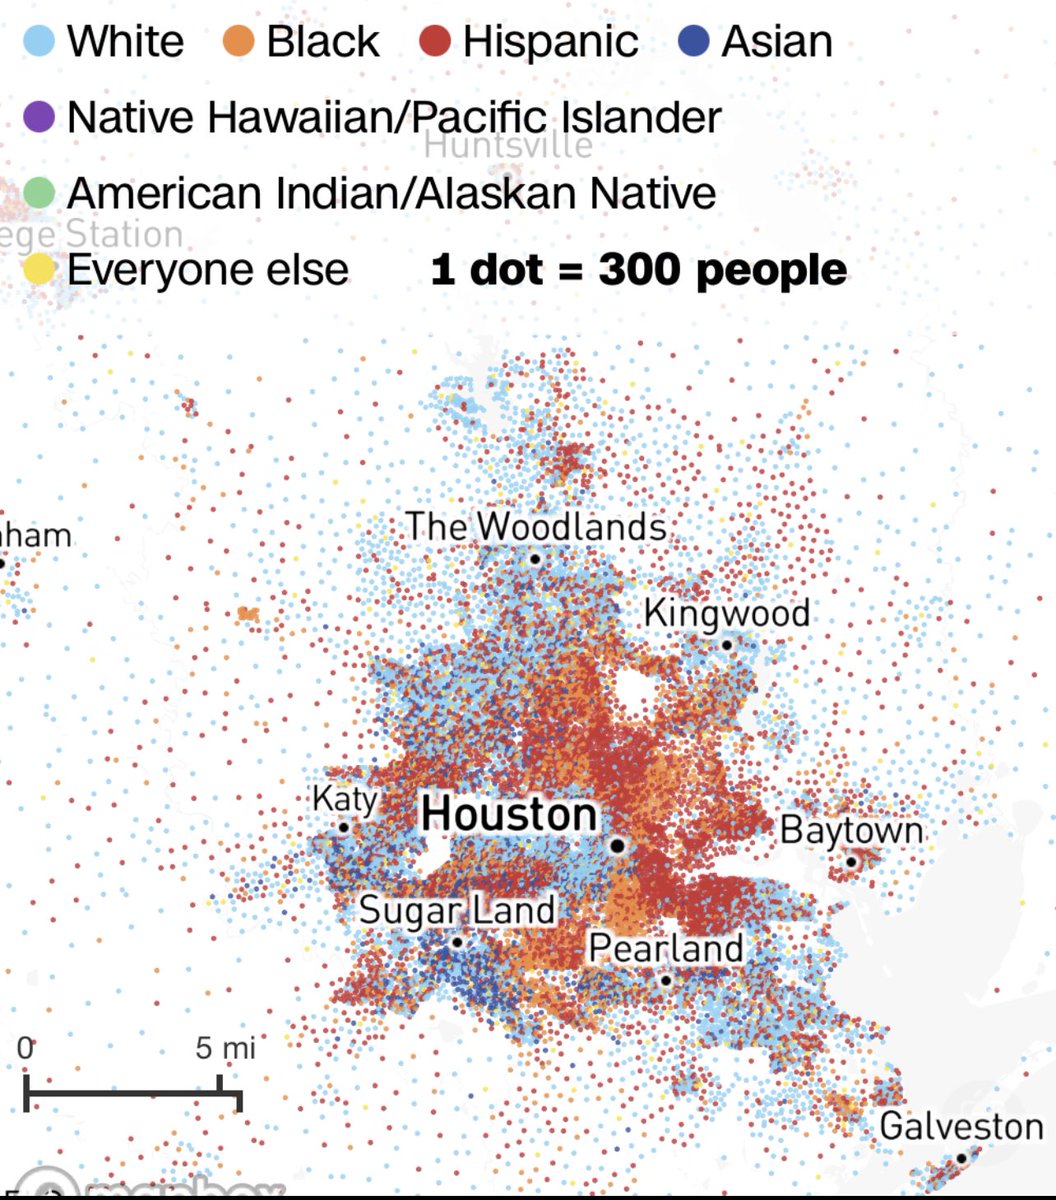
Its Latino population is distributed fairly evenly (all counties were btwn 23-31% in 2020), w/ the highest share in Brazoria County to the south
Its Latino population is distributed fairly evenly (all counties were btwn 23-31% in 2020), w/ the highest share in Brazoria County to the south
Its Black population has held relatively steady since 2012 (consistently just over 13%).
It’s concentrated in Fort Bend County (~20% Black) to the SW (anchored by Missouri City).
The smaller Waller County to the west has the highest share of Black residents (~24%) in the region
It’s concentrated in Fort Bend County (~20% Black) to the SW (anchored by Missouri City).
The smaller Waller County to the west has the highest share of Black residents (~24%) in the region
Its share of Asian residents has been growing at a faster rate than TX’s since 2012
Its Asian population (mostly Vietnamese, Chinese & Indian) is concentrated in Fort Bend County (~21%) — which has the highest share of Asians in the South — & anchored in the suburb of Sugar Land
Its Asian population (mostly Vietnamese, Chinese & Indian) is concentrated in Fort Bend County (~21%) — which has the highest share of Asians in the South — & anchored in the suburb of Sugar Land
*Demographics: Education*
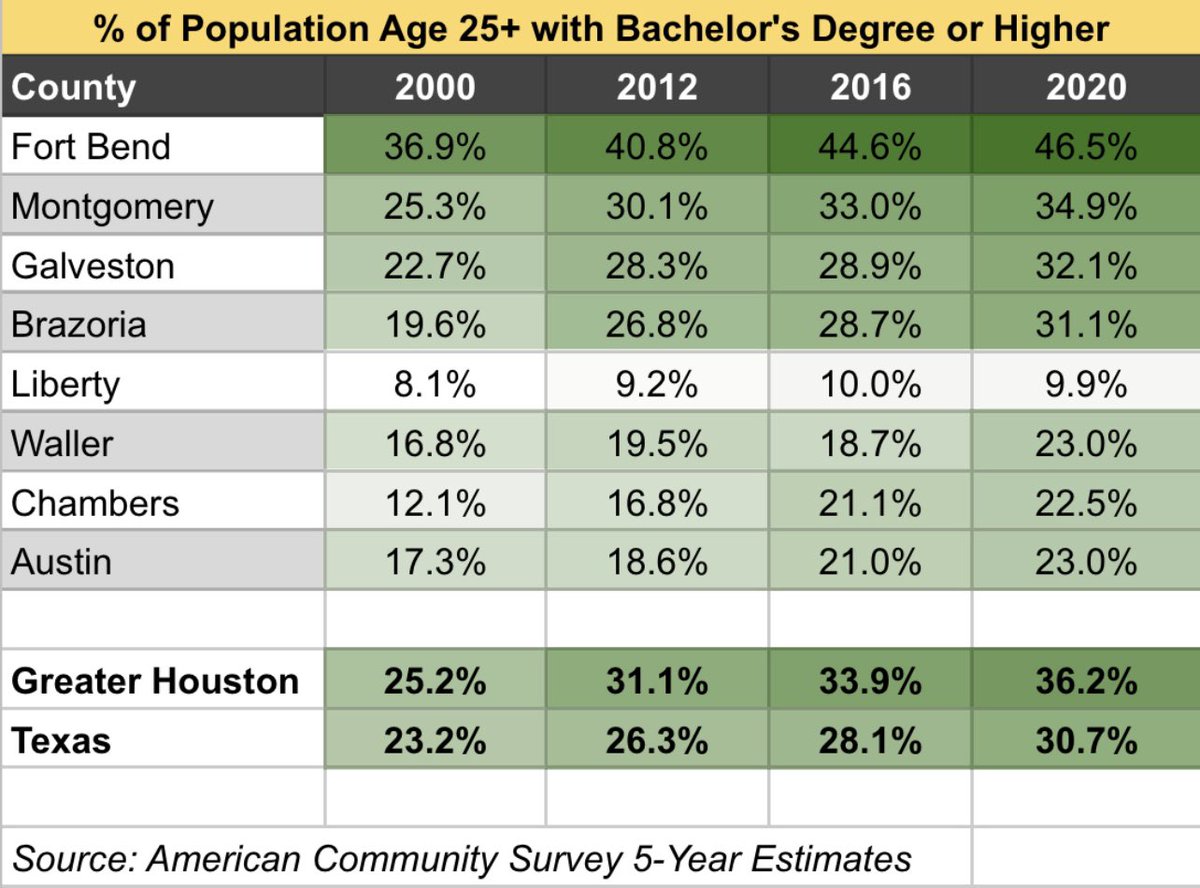
Greater Houston has a higher share of college grads than TX as a whole
Fort Bend County (47%) has the highest share of college grads in the region, then Montgomery (35%), Galveston (32%) & Brazoria (31%)
The less populated counties range from 10-23%
Greater Houston has a higher share of college grads than TX as a whole
Fort Bend County (47%) has the highest share of college grads in the region, then Montgomery (35%), Galveston (32%) & Brazoria (31%)
The less populated counties range from 10-23%
*Vote Share*
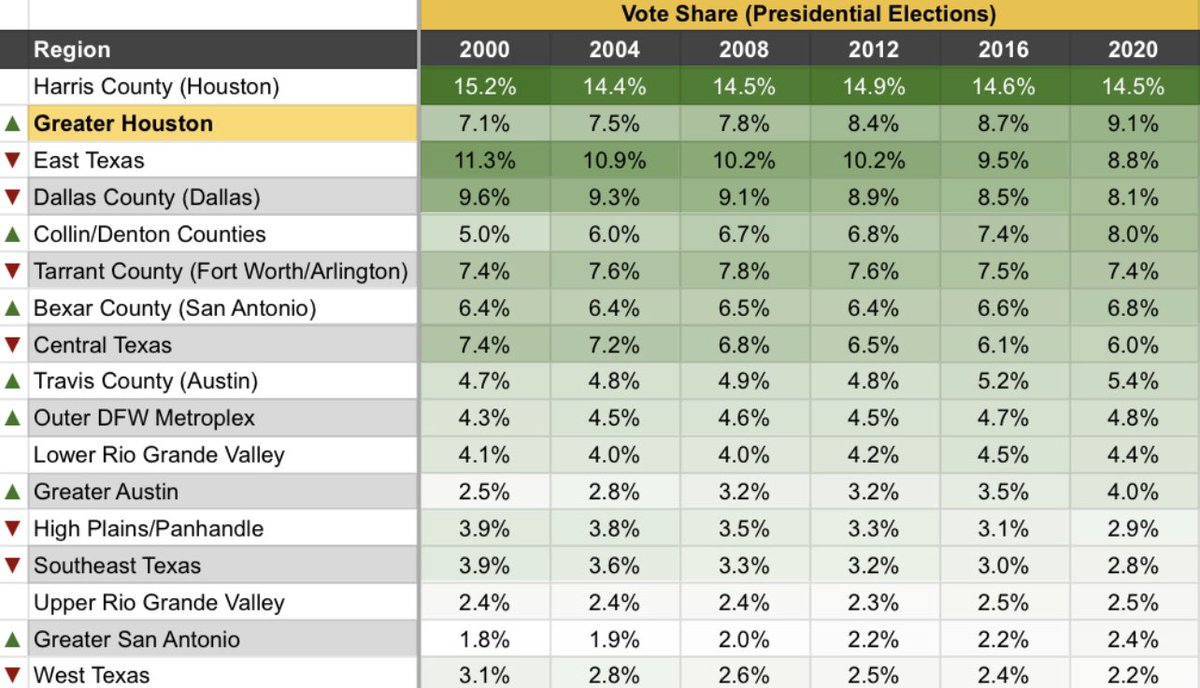
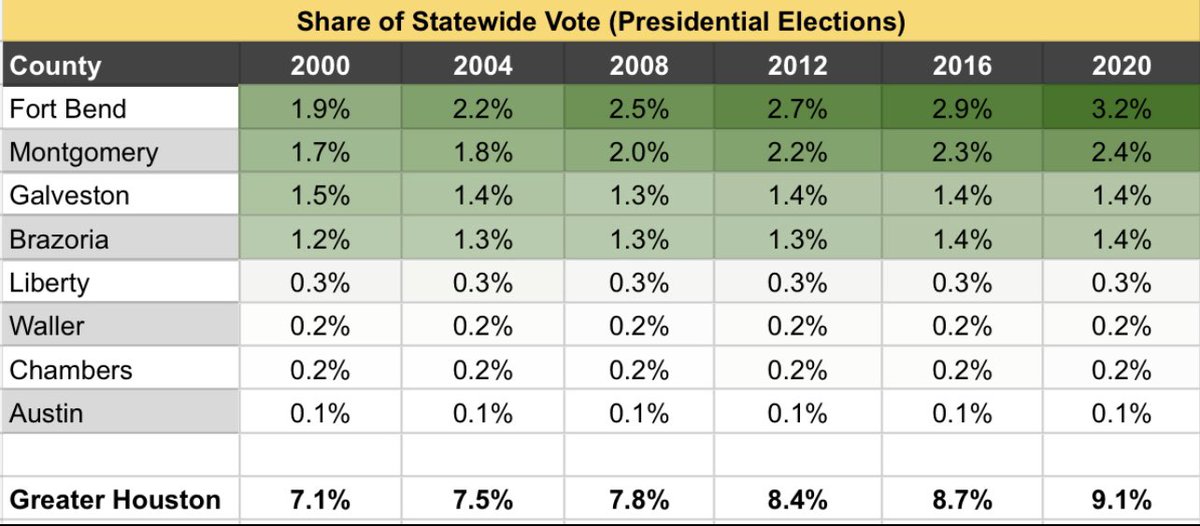
Now the second most populous region in the state, Greater Houston’s share of the statewide vote has risen in each pres. election since 2000 (from 7.1% in 2000 to 9.1% in 2020)
This is primarily due to rapid growth in Fort Bend County & to a lesser extent Montgomery
Now the second most populous region in the state, Greater Houston’s share of the statewide vote has risen in each pres. election since 2000 (from 7.1% in 2000 to 9.1% in 2020)
This is primarily due to rapid growth in Fort Bend County & to a lesser extent Montgomery
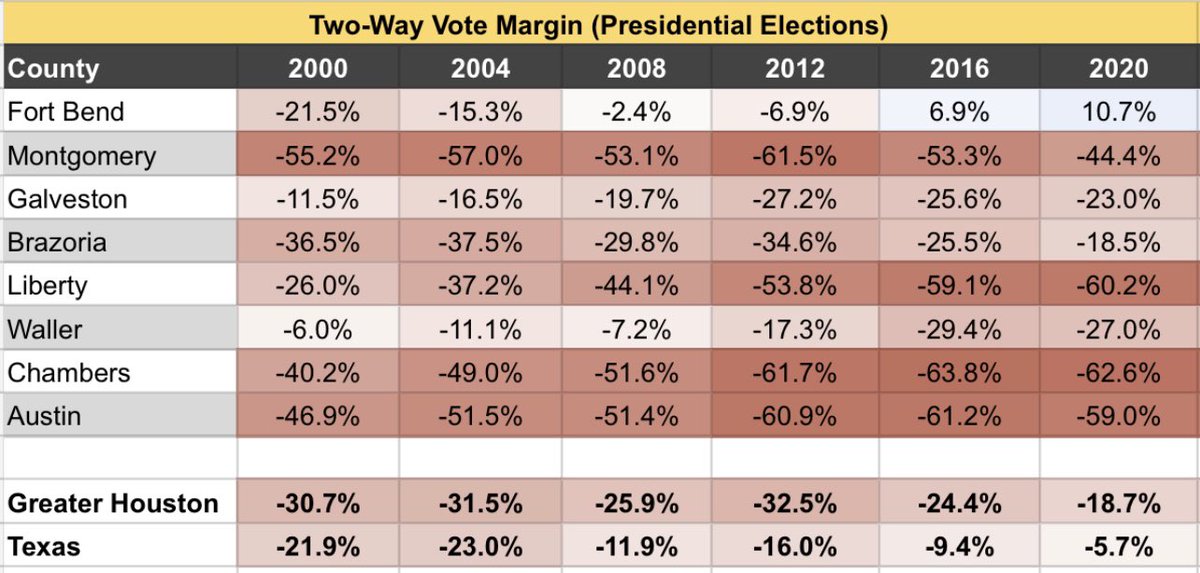
*Political Geography & Trends*
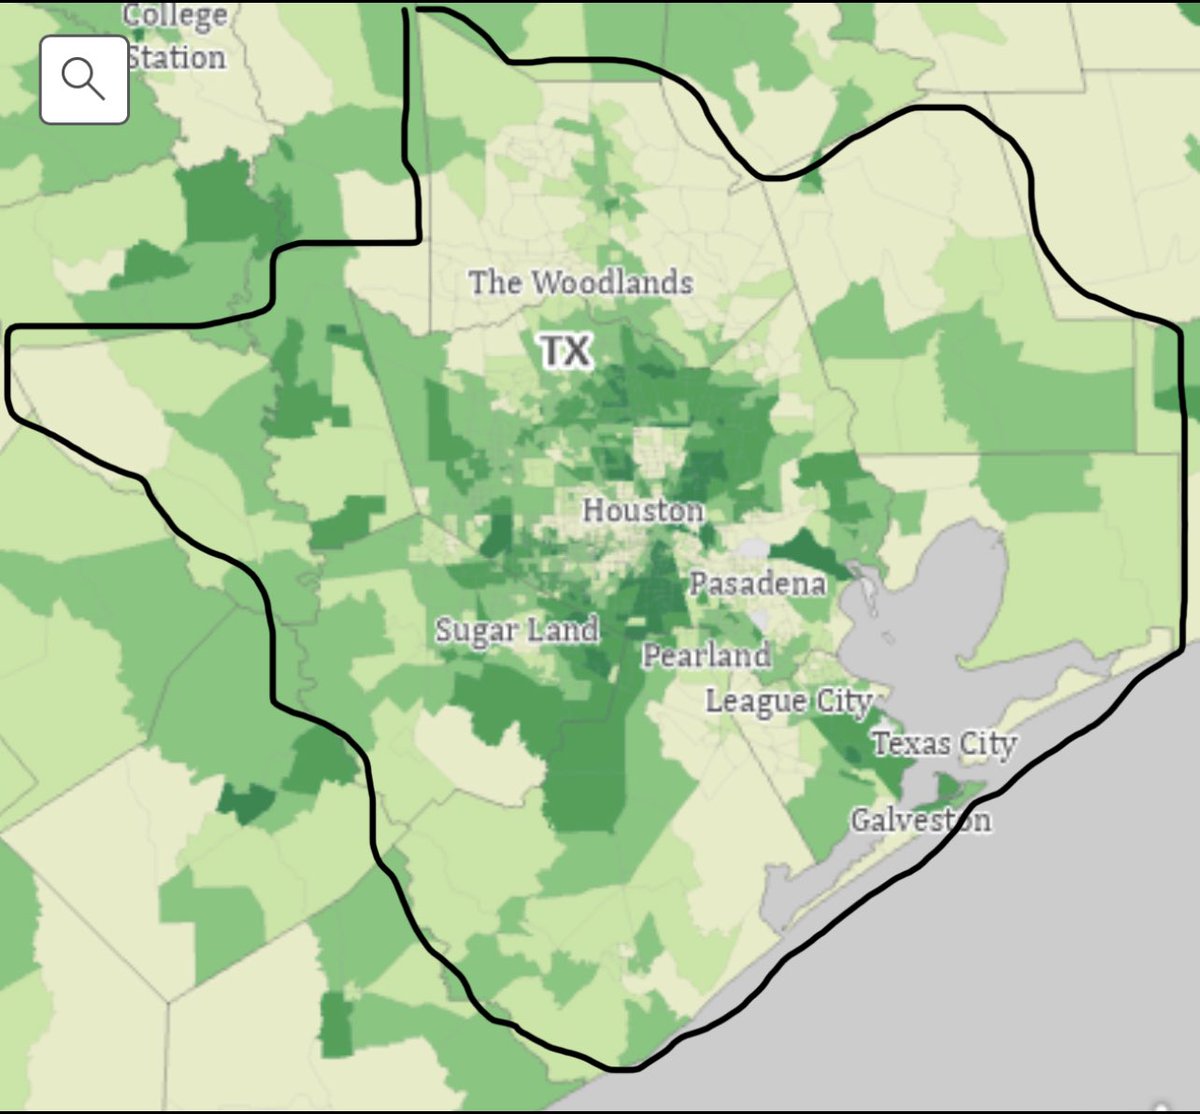
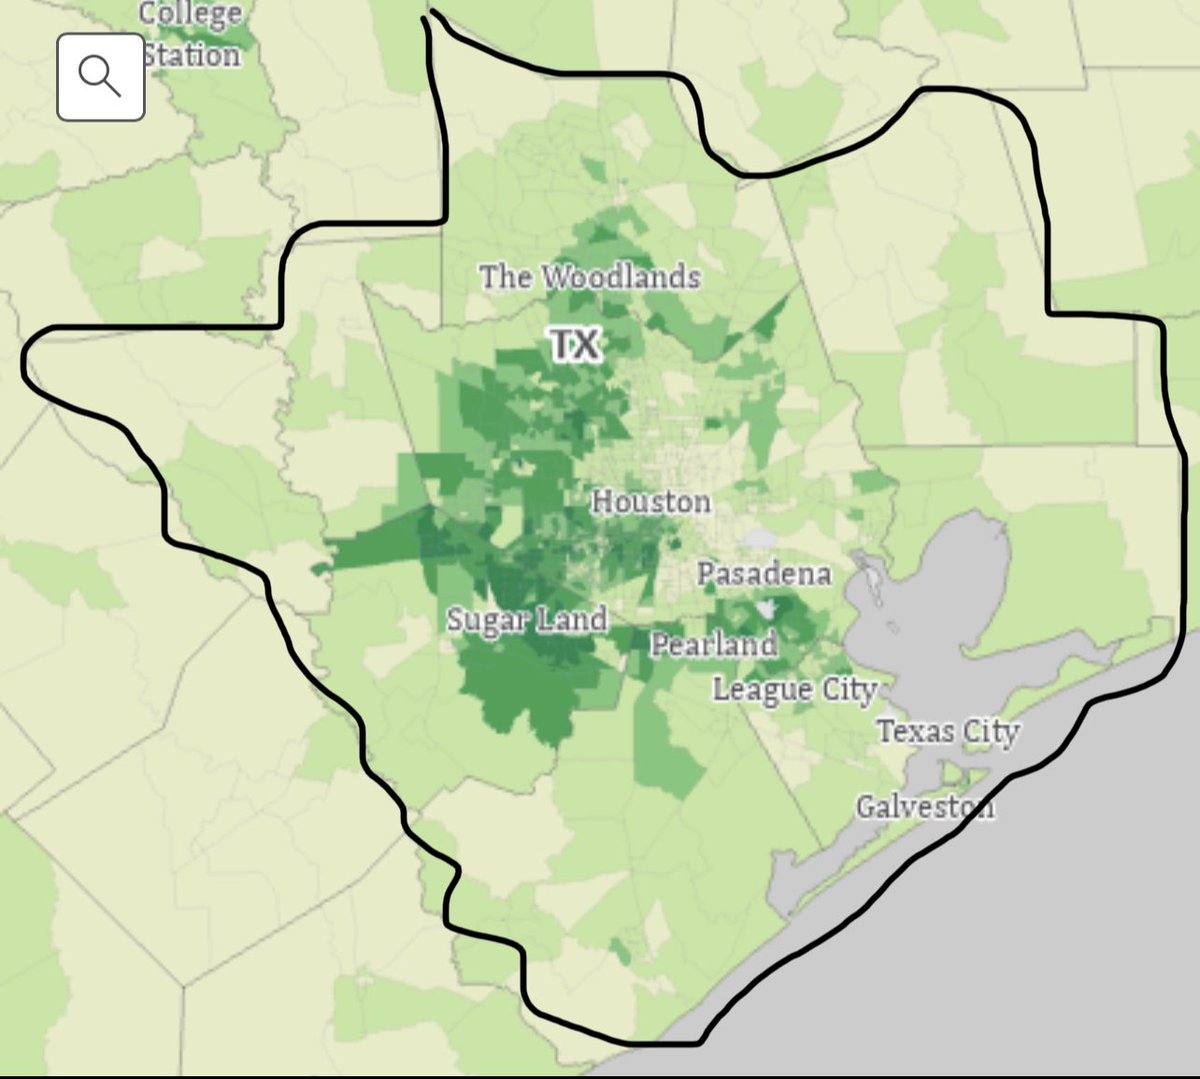
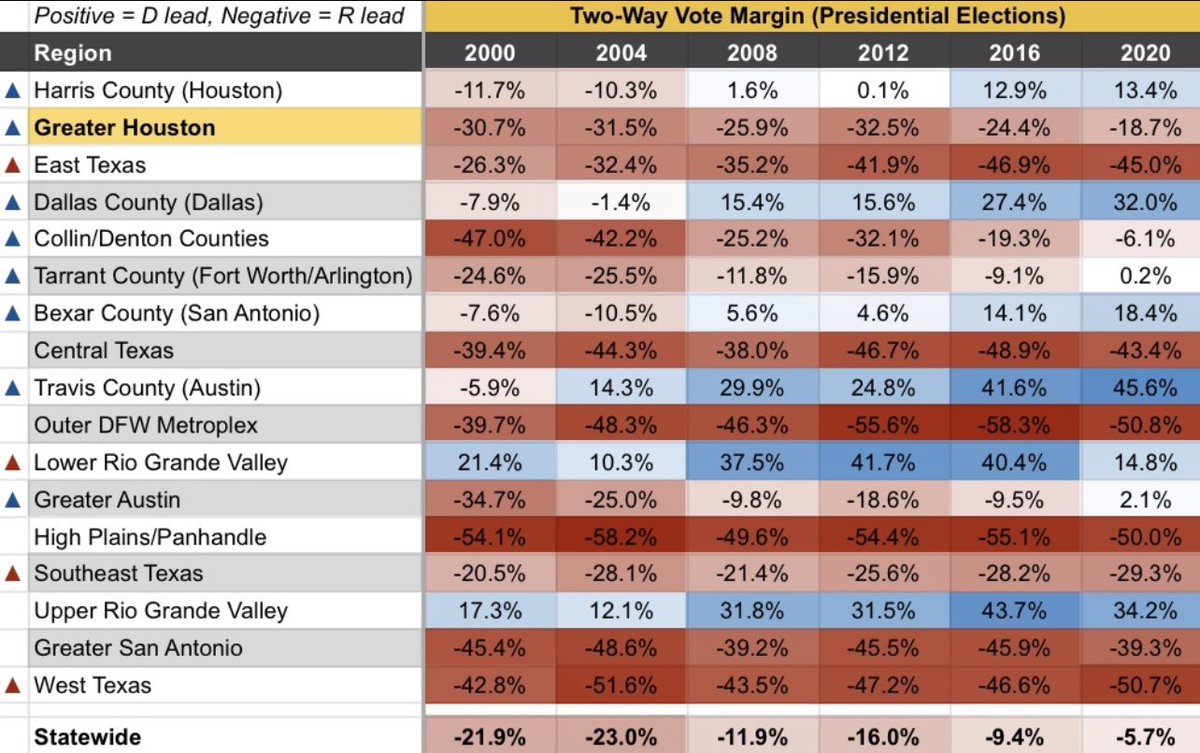
While Greater Houston consistently votes for Rs by double-digit margins, it’s shifted sharply left the last two pres. cycles (R+33 in 2012 to R+19 in 2020) — driven by ~16-18 pt shifts in 3/4 most populous counties (Fort Bend, Montgomery, Brazoria)
While Greater Houston consistently votes for Rs by double-digit margins, it’s shifted sharply left the last two pres. cycles (R+33 in 2012 to R+19 in 2020) — driven by ~16-18 pt shifts in 3/4 most populous counties (Fort Bend, Montgomery, Brazoria)
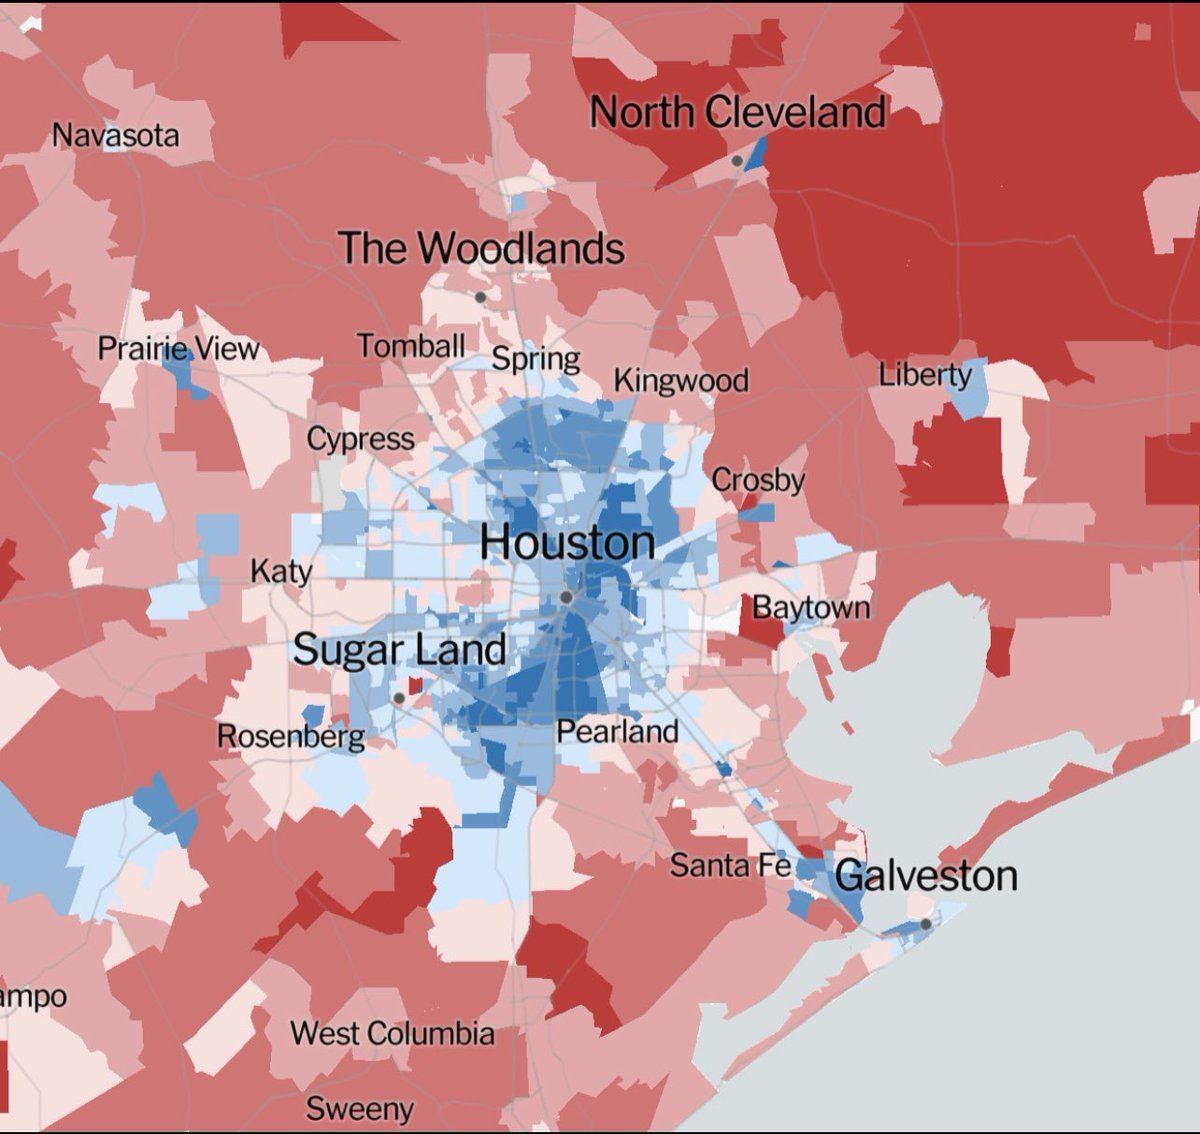
Here are maps of the 2020 results (left) & the shift from 2016 to 2020 (right)
In 2020, Trump won all the counties in this region except the rapidly growing & diversifying Fort Bend (which flipped to Ds in 2016)
But once again the more Latino-heavy areas shifted right from 2016
In 2020, Trump won all the counties in this region except the rapidly growing & diversifying Fort Bend (which flipped to Ds in 2016)
But once again the more Latino-heavy areas shifted right from 2016
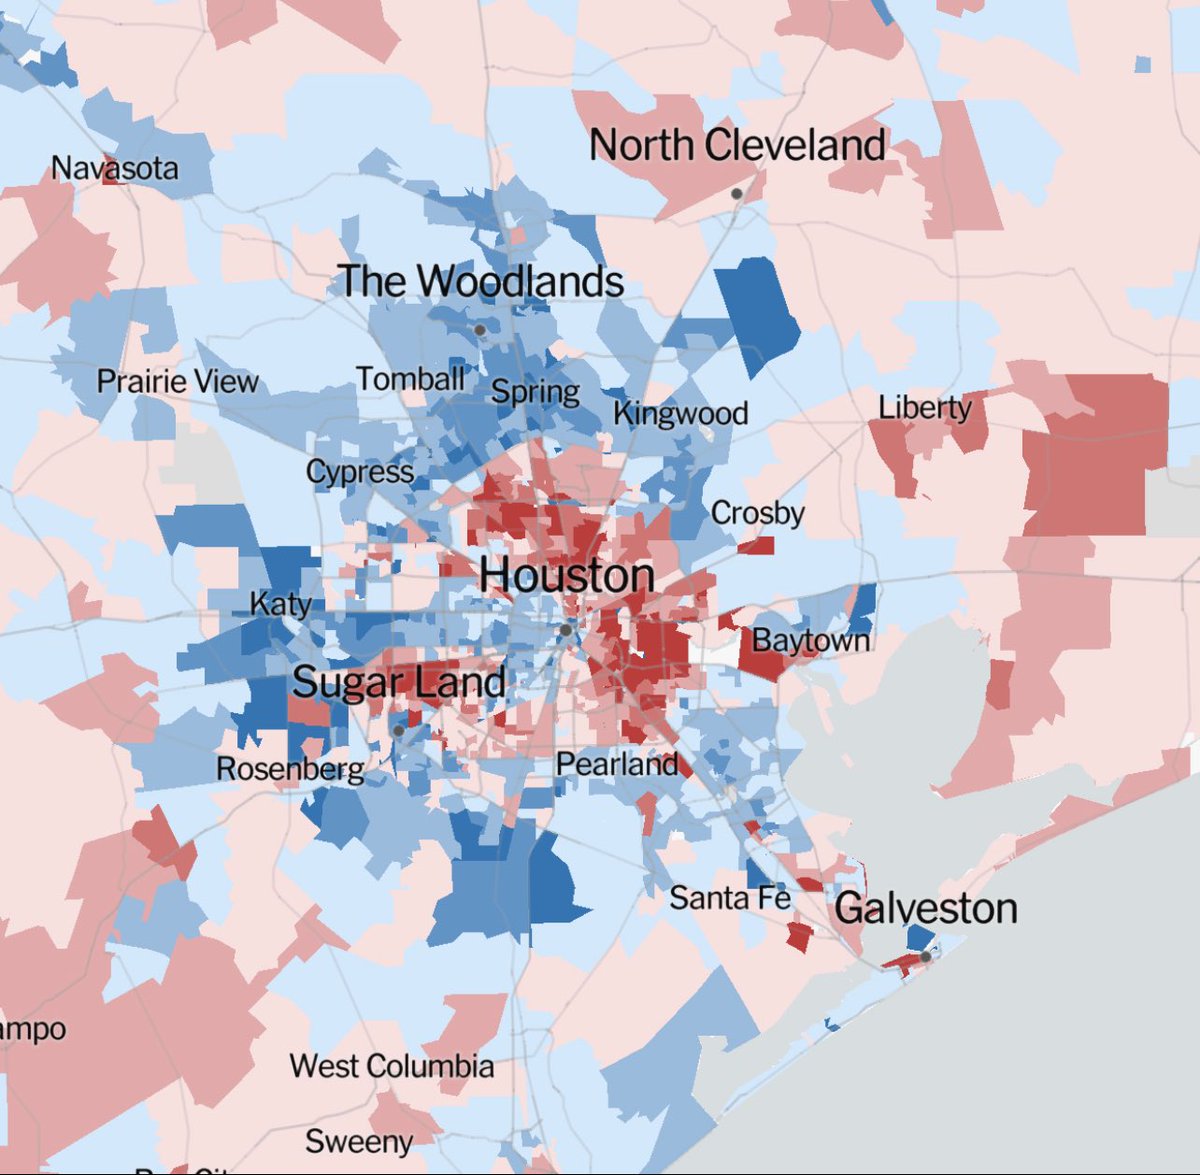
It remains to be seen whether this is due to demographic shifts (i.e. becoming less White non-college) or a specific aversion to Trump — likely a combination of both.
But it’s reasonable to expect these trends to continue if Trump is nominated again.
But it’s reasonable to expect these trends to continue if Trump is nominated again.
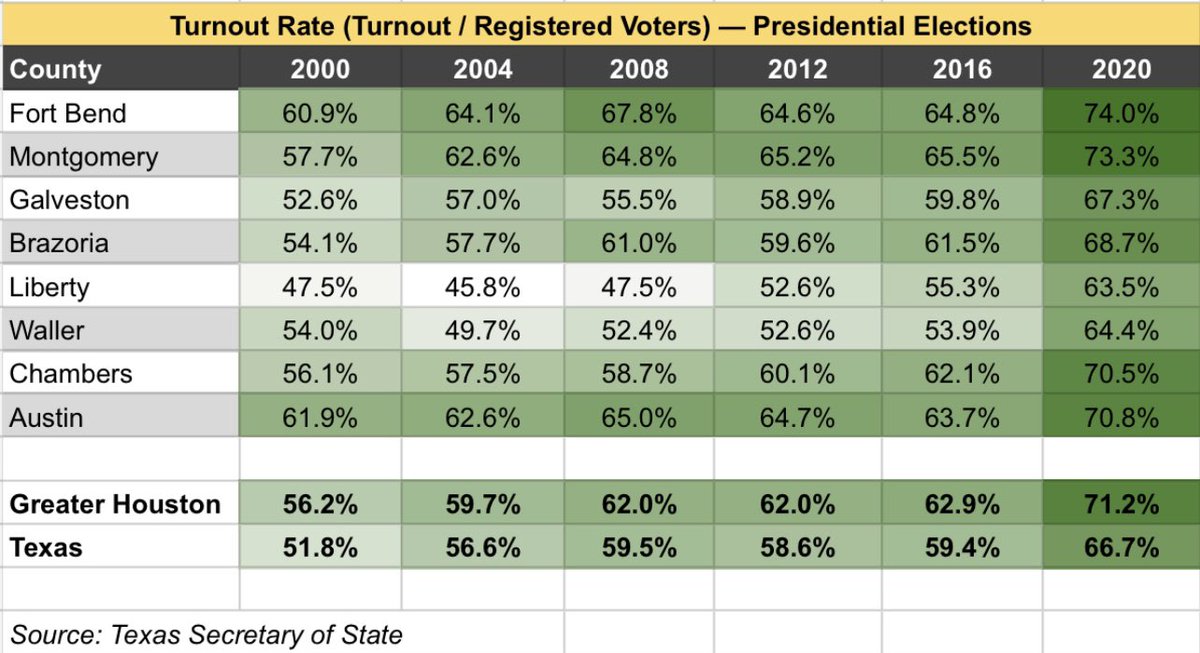
*Turnout*
Greater Houston’s turnout rate has consistently been a few points higher than TX as a whole, driven by high turnout in Fort Bend & Montgomery Counties.
Like most of the state, its turnout rate spiked in 2020 (from 63% to 71%) as TX entered pseudo-swing state status.
Greater Houston’s turnout rate has consistently been a few points higher than TX as a whole, driven by high turnout in Fort Bend & Montgomery Counties.
Like most of the state, its turnout rate spiked in 2020 (from 63% to 71%) as TX entered pseudo-swing state status.
*What It Means for 2024 & 2028*
Ds likely need to keep up their momentum in Greater Houston to have a chance at flipping TX in the next few cycles
Continued demographic shifts should help them, but they should focus most of their persuasion & turnout efforts on Fort Bend County
Ds likely need to keep up their momentum in Greater Houston to have a chance at flipping TX in the next few cycles
Continued demographic shifts should help them, but they should focus most of their persuasion & turnout efforts on Fort Bend County
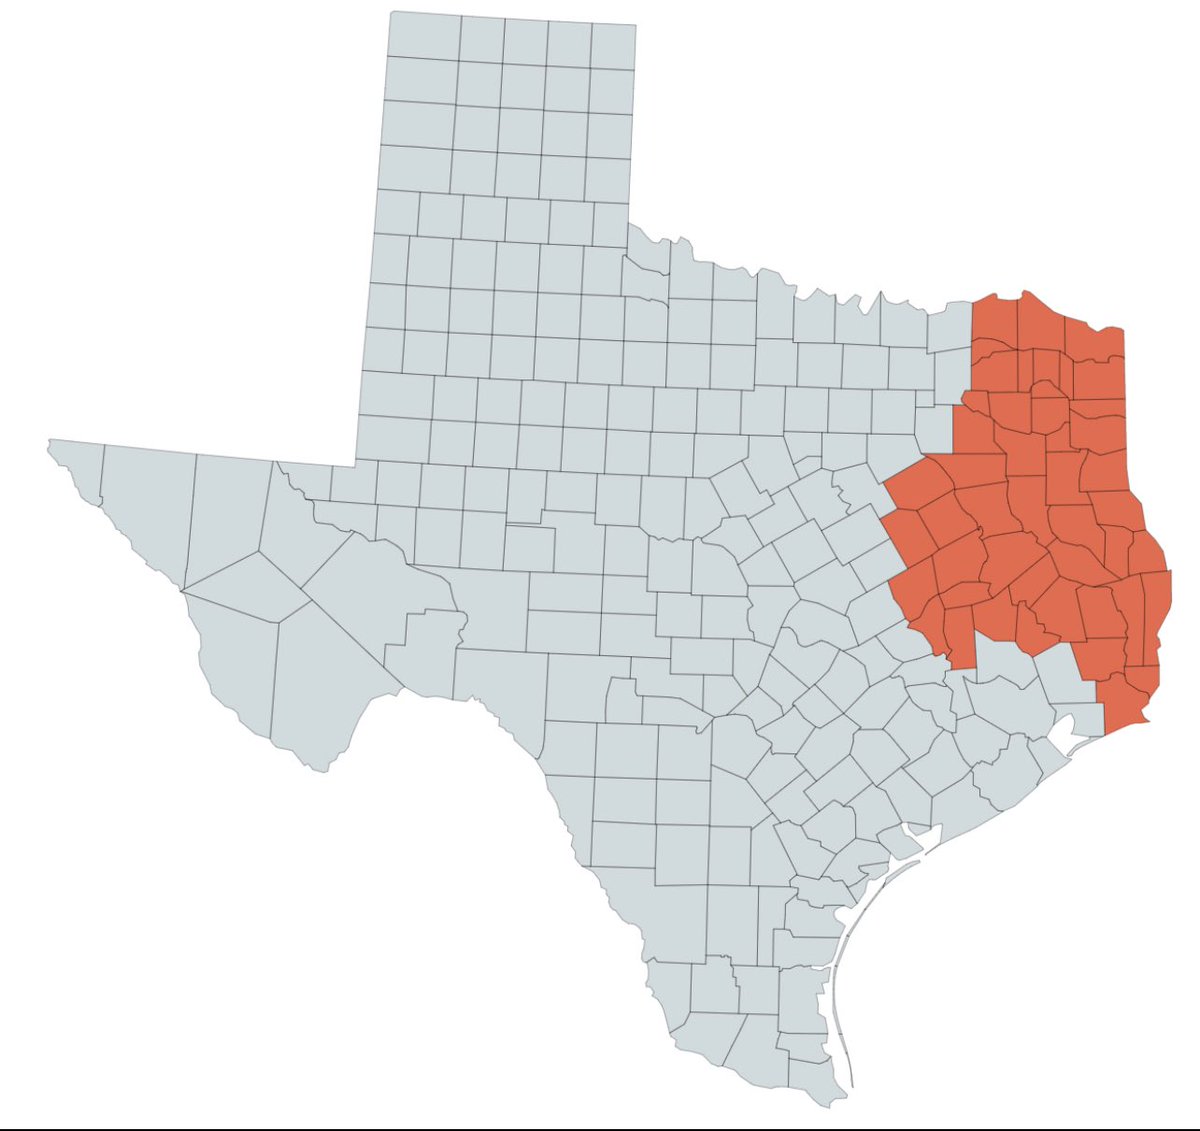
Next up in this 17-part series is East Texas, the largely rural, dark red, third most populous region in the state.
Please let me know if you’d like me to tag you in future posts in this series (or if you’d like me to remove your tag, I promise I won’t be offended).
Please let me know if you’d like me to tag you in future posts in this series (or if you’d like me to remove your tag, I promise I won’t be offended).
@schlagteslinks @SpecialPuppy1 @GarrettHerrin @eli_wilson04 @dannybarefoot @DrewSav @AlexODiazNV @JakeRugh @jyazman2012 @_fat_ugly_rat_ @lapinchedarcy @mcpli @LoneStarPop @Thorongil16 @lxeagle17 @HWLavelleMaps @SDS_Sunlight @seperez @LoganR2WH @JeffLindemyer @xroblockx
@VanceUlrich @vinnyeng @alaskakatyalove @AnthonyClose @eli_wilson04 @wisconsinmapper @KawhiStan220 @chrisbquin @Dem_Soc_Dem_S @nagy_minaj @WinWithJMC @JMilesColeman @LPDonovan @davidshor @Nate_Cohn @gelliottmorris
#ElectionTwitter #txpoli #txpolitics
#ElectionTwitter #txpoli #txpolitics
@schlagteslinks @SpecialPuppy1 @GarrettHerrin @eli_wilson04 @dannybarefoot @DrewSav @AlexODiazNV @JakeRugh @jyazman2012 @_fat_ugly_rat_ @lapinchedarcy @mcpli @LoneStarPop @Thorongil16 @lxeagle17 @HWLavelleMaps @SDS_Sunlight @seperez @LoganR2WH @JeffLindemyer @xroblockx And here’s my zoomed out view of where things are at/going statewide
https://twitter.com/admcrlsn/status/1684894012254142464
@schlagteslinks @SpecialPuppy1 @GarrettHerrin @eli_wilson04 @dannybarefoot @DrewSav @AlexODiazNV @JakeRugh @jyazman2012 @_fat_ugly_rat_ @lapinchedarcy @mcpli @LoneStarPop @Thorongil16 @lxeagle17 @HWLavelleMaps @SDS_Sunlight @seperez @LoganR2WH @JeffLindemyer @xroblockx And finally, here’s Part 1 in the series (Harris County)
https://twitter.com/admcrlsn/status/1685360231381901312
@ab2788 @TylerDinucci
• • •
Missing some Tweet in this thread? You can try to
force a refresh