Make a habit of following the system, & not take idiosyncratic decisions; the 'let’s-do-this-&-see-what-happens' trades.
Every loss must teach you something, & should not disappear in the ocean of random things that happen in your trading life.
Here are 4 of my worst mistakes… https://t.co/jVpP11eg4ftwitter.com/i/web/status/1…

Every loss must teach you something, & should not disappear in the ocean of random things that happen in your trading life.
Here are 4 of my worst mistakes… https://t.co/jVpP11eg4ftwitter.com/i/web/status/1…

Mistake 1: Impatience
Trade exhibit: BSE
Entry (23-May-23): First pullback to the 20-day MA.
Exit (24-May-23): Exited in the backdrop of Nifty making something like an evening star, & the trade having no cushion.
Return: 0.28%
Potential: 180% upmove.
Learning: Impatience is… https://t.co/5pBUzHNZYStwitter.com/i/web/status/1…

Mistake 2: Ego
Trade exhibit: ABB
Entry (06-Apr-23): Entered as price seemed to breakout of a multi-touch descending trendline.
Exit (11-Apr-23): Exited as SL got hit. Within a week, the price recovered & was back at the same levels, giving another opportunity that was not… https://t.co/s952z71rJKtwitter.com/i/web/status/1…

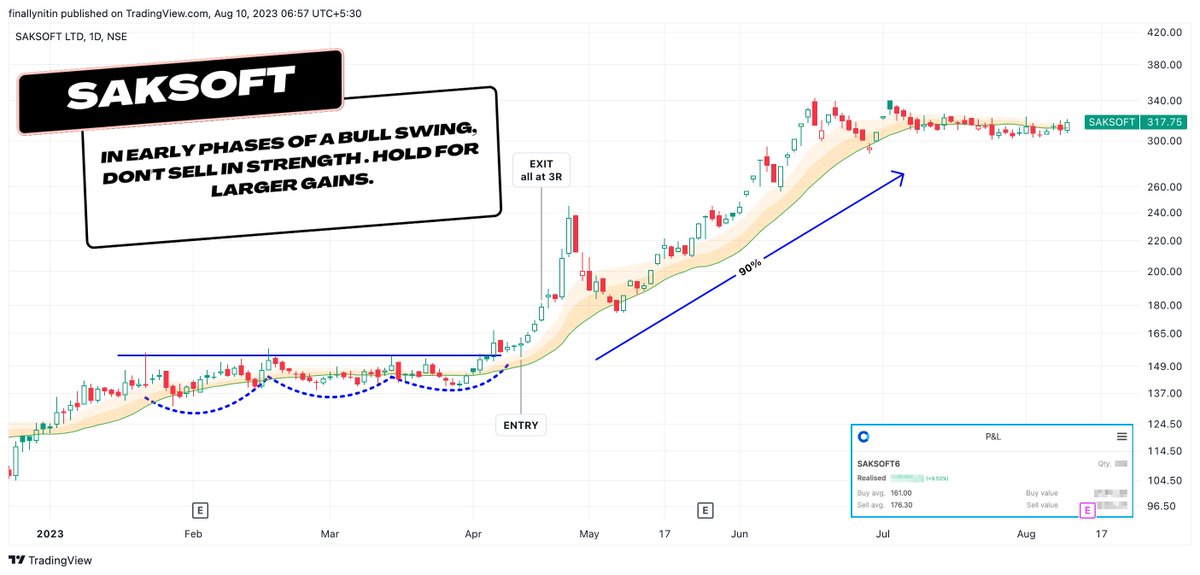
Mistake 3: Fear
Trade exhibit: SAKSOFT
Entry (17-Apr-23): Entered as a breakout from a triple inside bar.
Exit (20-Apr-23): Exited all at 3R (pre-determined exit).
Return: 9.5%
Potential: 90% upmove.
Learning: In early phases of a bull swing, don't sell in strength, because… https://t.co/XYKDGmmNb4twitter.com/i/web/status/1…
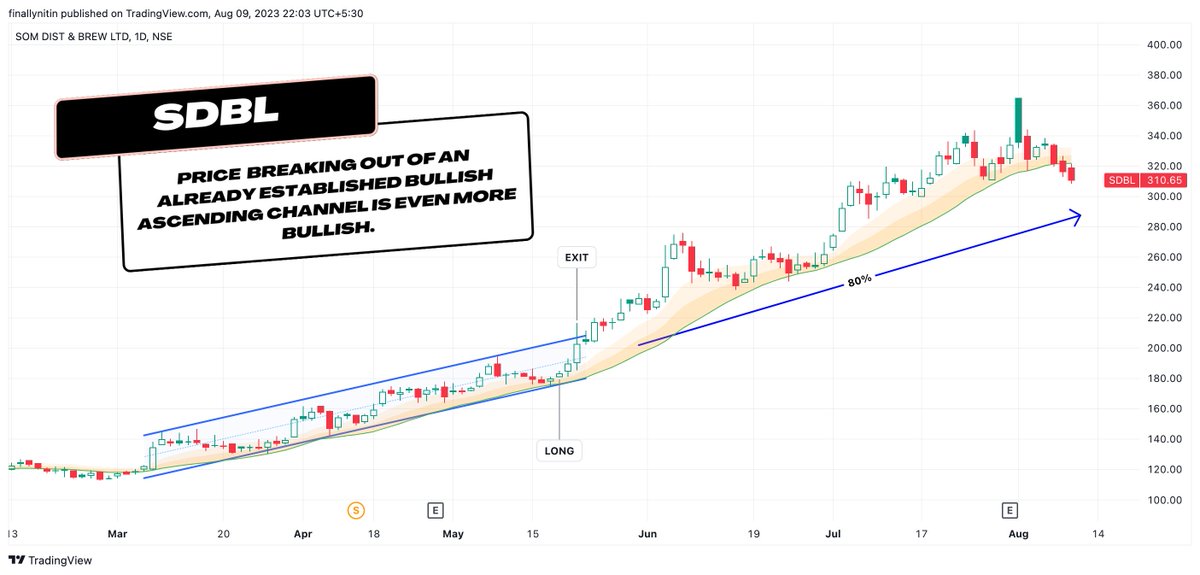
Mistake 4: Micro-management
Trade exhibit: SDBL
Entry (18-May-23): Entered as a pullback entry from the lower line of the ascending channel.
Exit (22-May-23) :Exited as the trade achieved 3R & got rejected from the upper channel line.
Return: 10.8%
Potential: 80% upmove.… https://t.co/6AUrUqqWZOtwitter.com/i/web/status/1…
Trade exhibit: SDBL
Entry (18-May-23): Entered as a pullback entry from the lower line of the ascending channel.
Exit (22-May-23) :Exited as the trade achieved 3R & got rejected from the upper channel line.
Return: 10.8%
Potential: 80% upmove.… https://t.co/6AUrUqqWZOtwitter.com/i/web/status/1…
Document every trade, with the reasons why you took it, & what mistake you did commit.
These flashcards serve as a reminder to me not to repeat them in the next swing.
And every time I'm close to repeating them, Naseer sahab is always there to yell at me: 😅
These flashcards serve as a reminder to me not to repeat them in the next swing.
And every time I'm close to repeating them, Naseer sahab is always there to yell at me: 😅

• • •
Missing some Tweet in this thread? You can try to
force a refresh