There's a lot of fairly ill-tempered debate among economists about news that should make everyone happy — disinflation without recession. My thought: we should apply Occam's extended razor. When in doubt, go for the simpler story, and rely on standard models 1/
Most econ textbooks offer some version of an aggregate demand-aggregate supply framework that looks like this 2/
For much of 2022 and some way into 2023 many economists were arguing that reducing inflation would require a big reduction in aggregate demand (via Fed hikes) that would lead to large job losses 3/
But what we actually got was a lot of disinflation, even in measures that tried to extract "underlying" inflation excluding volatile components ... 4/
... with the employment situation improving rather than worsening 5/
The simplest explanation consistent with the standard model — Occam's extended razor — was and is a rightward shift in aggregate supply 6/
Where might such a shift come from? The obvious answer is the end of Long Transitory, ie recombobulation — the economy sorting out lingering pandemic-related disruptions 7/
We don't know for sure that this is true; when do we ever know that anything in economics is true? But alternative explanations, especially claims that the Fed somehow did this with its mystical power of credibility, feel like attempts to explain away a big forecasting miss 8/
• • •
Missing some Tweet in this thread? You can try to
force a refresh
Imports are about 14 percent of US GDP. Federal income tax revenue (not including payroll taxes) is about 8 %. So you might think replacing it would require a tariff rate of 8/14 or around 57 percent. But ... 2/
Tariffs would raise the cost of imports to consumers, so we'd import less, which would mean you need a higher tariff rate. But this reduces imports further, meaning a still higher tariff, and so on 3/
The Fed survey of economic well-being is out; some changes at the margin, but the basic story remains that Americans say they're doing mostly OK, their local economy isn't too bad, but the national economy is terrible 1/
Consistent with polling. Here's Quinnipiac on Wisconsin voters 2/
With the recent rise in consumer sentiment, time to revisit this excellent Briefing Book paper. On reflection, I'd do it a bit differently; same basic conclusion, but I think partisan asymmetry explains even more of the remaining low numbers 1/ briefingbook.info/p/asymmetric-a…
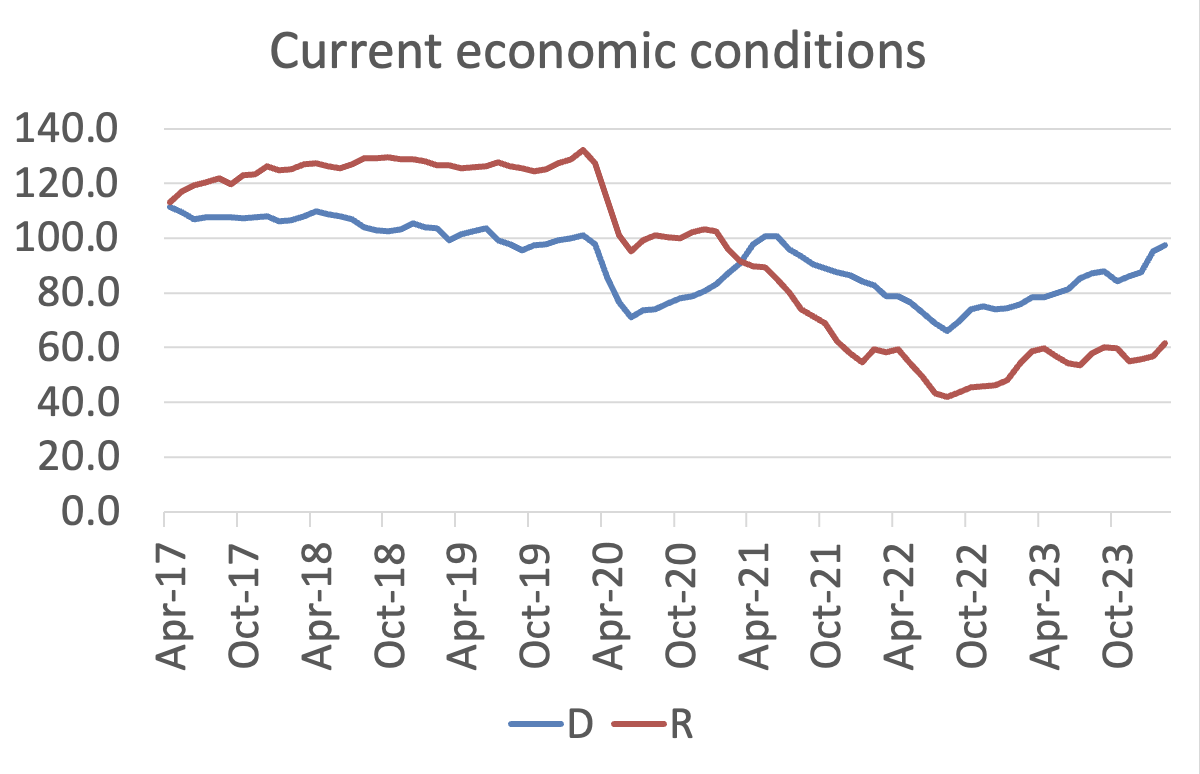
The Michigan sentiment index has two components: current conditions and expectations. It's kind of legitimate to have partisan diffs on expectations, if you think your party has better policies. It's the gap on current conditions that's startling 2/
Michigan doesn't provide partisan breakdowns every month until 2017 (hence the limited range of that chart). A quick and dirty approach is to use annual averages, with whatever months they do provide for each year, which lets us push back to 2006 3/
Recent economic news has been extremely good. But there's a strange meme among some D consultants that Biden shouldn't boast about it, because it seems out of touch — that people aren't feeling the good economy. But they are! 1/
The venerable Michigan survey has rocketed up lately 2/
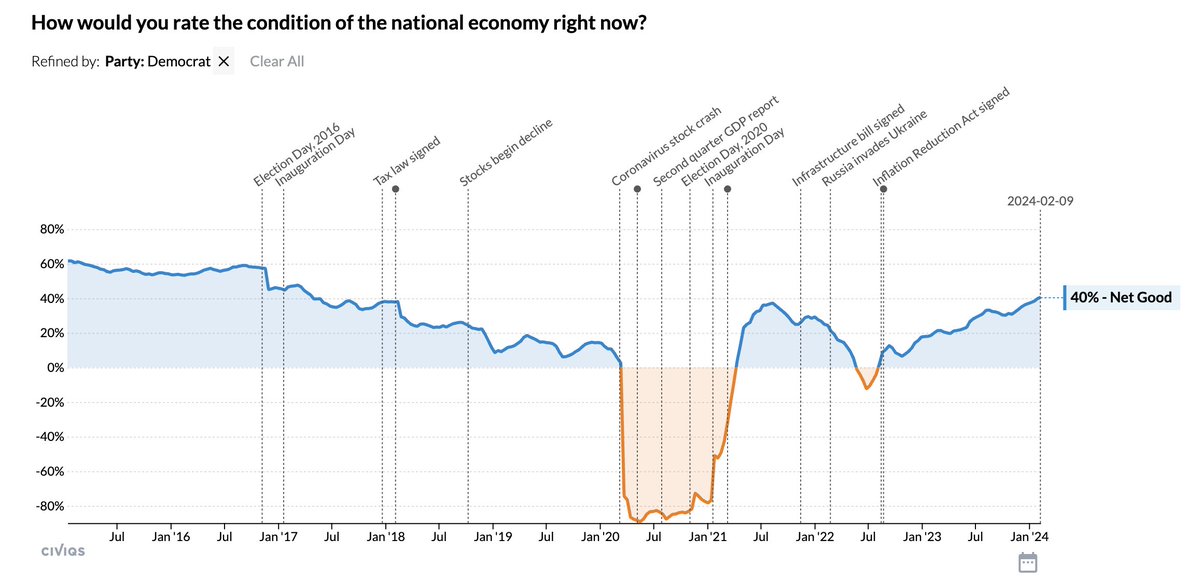
It's true that consumer sentiment is still weaker than you might expect given the economic numbers. But that's largely partisanship. Using Civiqs numbers, Democrats have more or less fully accepted the good news 3/
Immigration is looming larger in the campaign, partly because it's becoming harder for Republicans to run against Biden on the economy. But there's a strong case that immigration has been a key part of Biden's economic success 1/
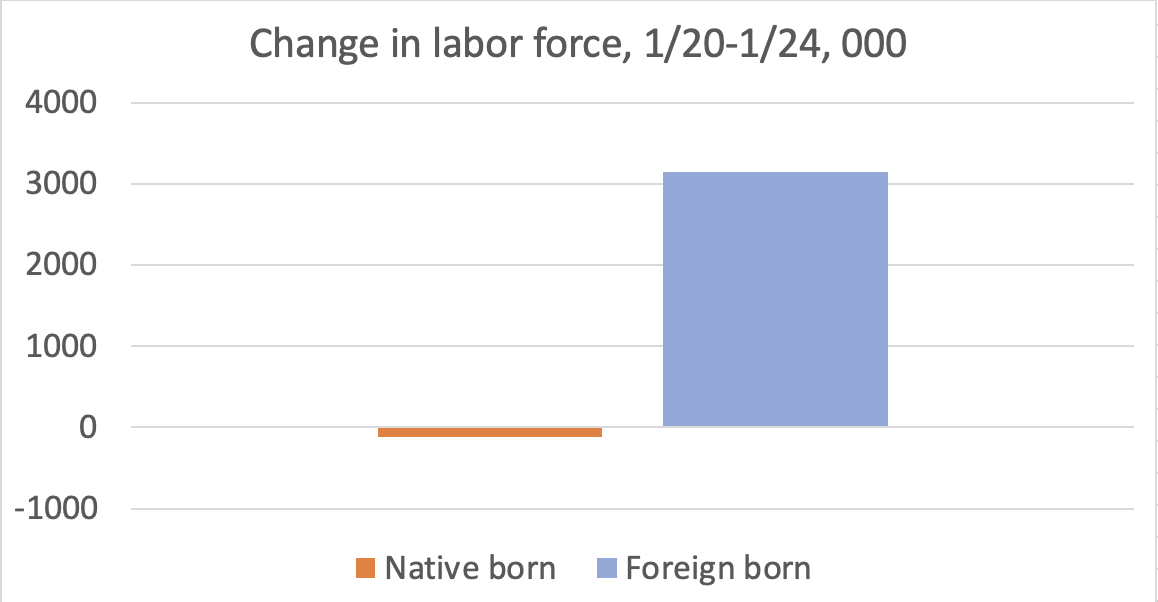
Inflation has come down so easily in part because of strong labor force growth. How much of that growth can be attributed to foreign-born workers? All of it 2/
Some people might look at that and say that foreigners have stolen 3 million jobs from Americans. But we have full employment, indeed a very tight labor market. Look at what the Conference Board survey says 3/
A tale of two inflation measures. Some analysts are still citing the blue line, when they should be citing the red line. This is professional malpractice 1/
Using annual core CPI puts you way behind the curve, for 2 reasons. First, annual: even core CPI was 4.6 in the first half of 2023, 3.2 in the second half. Second, known lags in official shelter prices lagging far behind market rents 2/
So annual CPI creates a spurious impression of stubborn inflation, with a difficult last mile to cover. PCE puts a lower weight on shelter, and on a shorter-term basis tells us that we've already traveled that last mile 3/