China is currently underlying going what @adam_tooze calls "a gearshift in what has been the most dramatic trajectory in economic history" --
And we have to try to understand it with what is by far the worst economic data produced by any of the major global economies.
1/
And we have to try to understand it with what is by far the worst economic data produced by any of the major global economies.
1/
China doesn't produce a lot of basic data (seasonally adjusted levels series for the components of GDP, seasonally adjusted trade data so there would be less need to use the y/y numbers, etc). & its data is hard to interpret because there isn't enough underlying detail.
2/
2/
Take one example from the balance of payments, the data set I know best.
As @jnordvig has highlighted, FDI inflows have collapsed -- that fits a lot of different narratives around China's current weakness.
3/
As @jnordvig has highlighted, FDI inflows have collapsed -- that fits a lot of different narratives around China's current weakness.
3/

@jnordvig But guess what else has collapsed?
Outflows from "errors and omissions" (often called hot money).
That's strange ...
4/
Outflows from "errors and omissions" (often called hot money).
That's strange ...
4/

@jnordvig The last time there was a big downshift in FDI inflows tied to an economic downshift (and CNY weakness) back in 2015, errors and omissions surged ... but not this time. @EtraAlex should look into this!
5/
5/

I noticed this because the gap between the basic balance (current account + net FDI) and errors has been a useful guide to underlying appreciation pressure on the CNY -- and both the basic balance and errors have shifted down ...
6/
6/

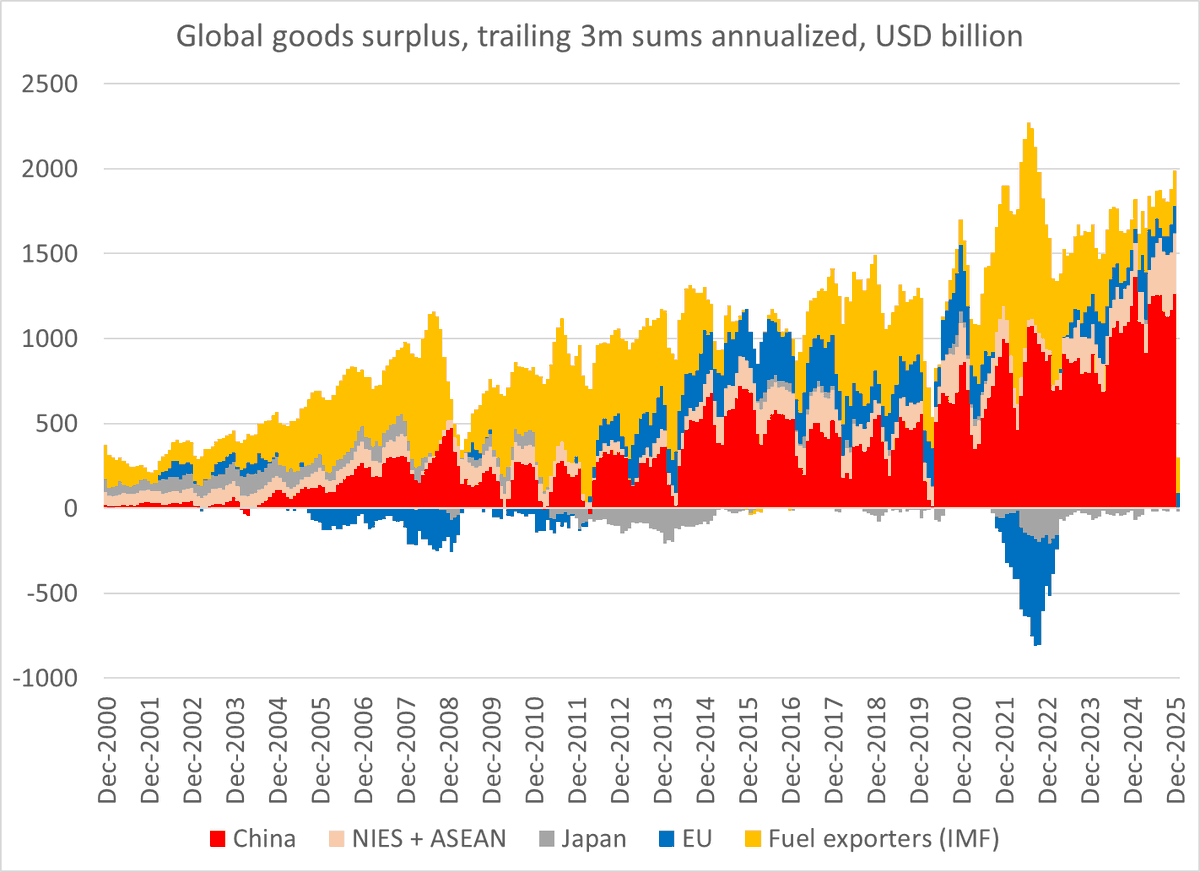
But there is also a question about whether "errors" are now accurate -- errors after all are the gap between China's measured current account balanced and measured capital outflows, and the current account surplus now looks artificially small relative to the goods surplus.
7/
7/

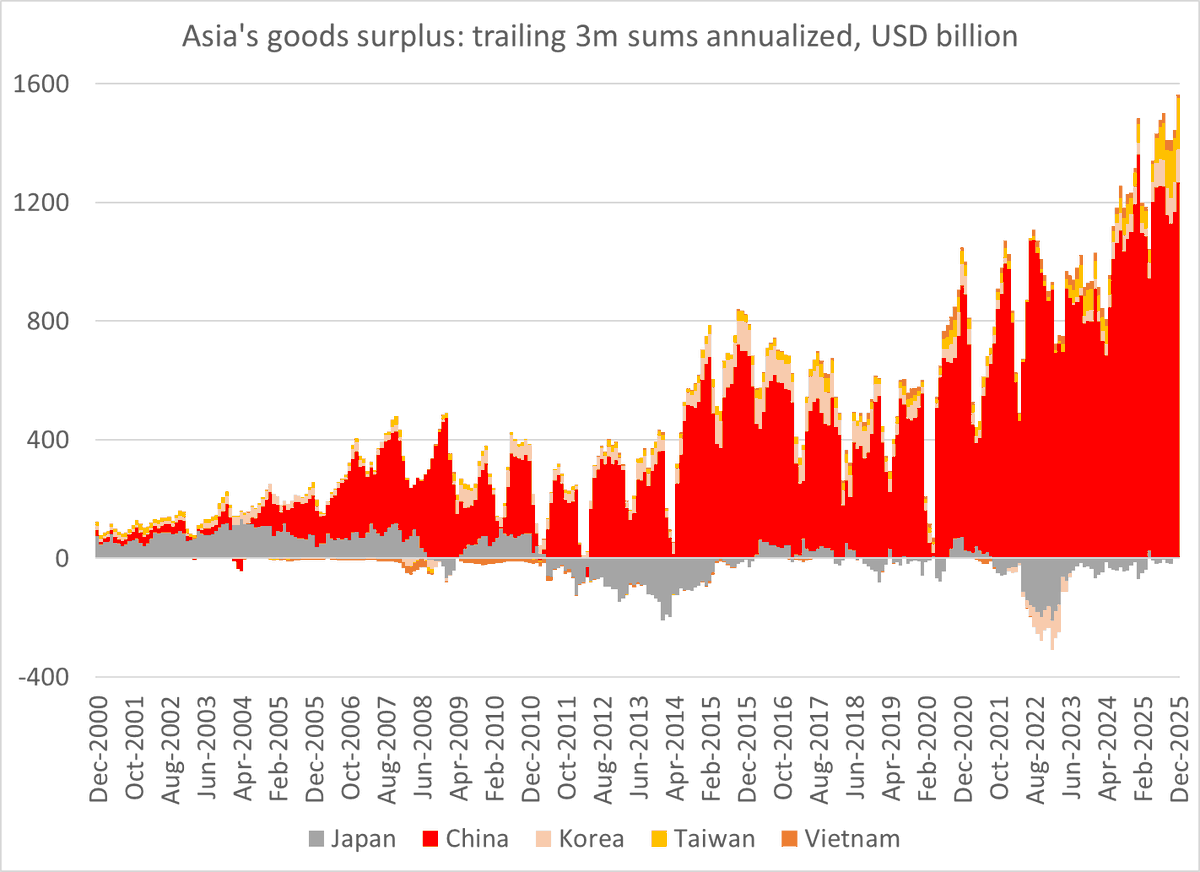
The current account surplus is now $500 billion below China's (large) goods surplus -- and it isn't mostly because of tourism any more. Rather the gap stems from the income deficit and a discrepancy between the BoP goods surplus and the customs good surplus ...
8/
8/

The customs surplus is now $250 billion (1-1.5 pp of GDP) smaller than the BoP goods surplus -- which is strange.
And the gap opened up recently b/c of some strange shifts in SAFE's methodology that make no sense (see @adamkwolfe)
9/
And the gap opened up recently b/c of some strange shifts in SAFE's methodology that make no sense (see @adamkwolfe)
9/

@adamkwolfe Export receipts in the BoP suddenly went from 97% of reported customs receipts to 92%, which meant (mechanically) a big fall in China's reported surplus ...
Funky data for a big economy ...
10/
Funky data for a big economy ...
10/

The income balance also makes little sense.
Most of China's assets are USD bonds and cross border loans,. Higher Treasury and Agency rates plus higher returns on LIBOR linked lending should have led China to get more investment income from the Row. But no ...
11/
Most of China's assets are USD bonds and cross border loans,. Higher Treasury and Agency rates plus higher returns on LIBOR linked lending should have led China to get more investment income from the Row. But no ...
11/

The income balance includes FDI receipts as well as income from bonds, loans and deposits -- but since China doesn't produce any disaggregated data, there is no way to see what explains the rather funky numbers
12/
12/
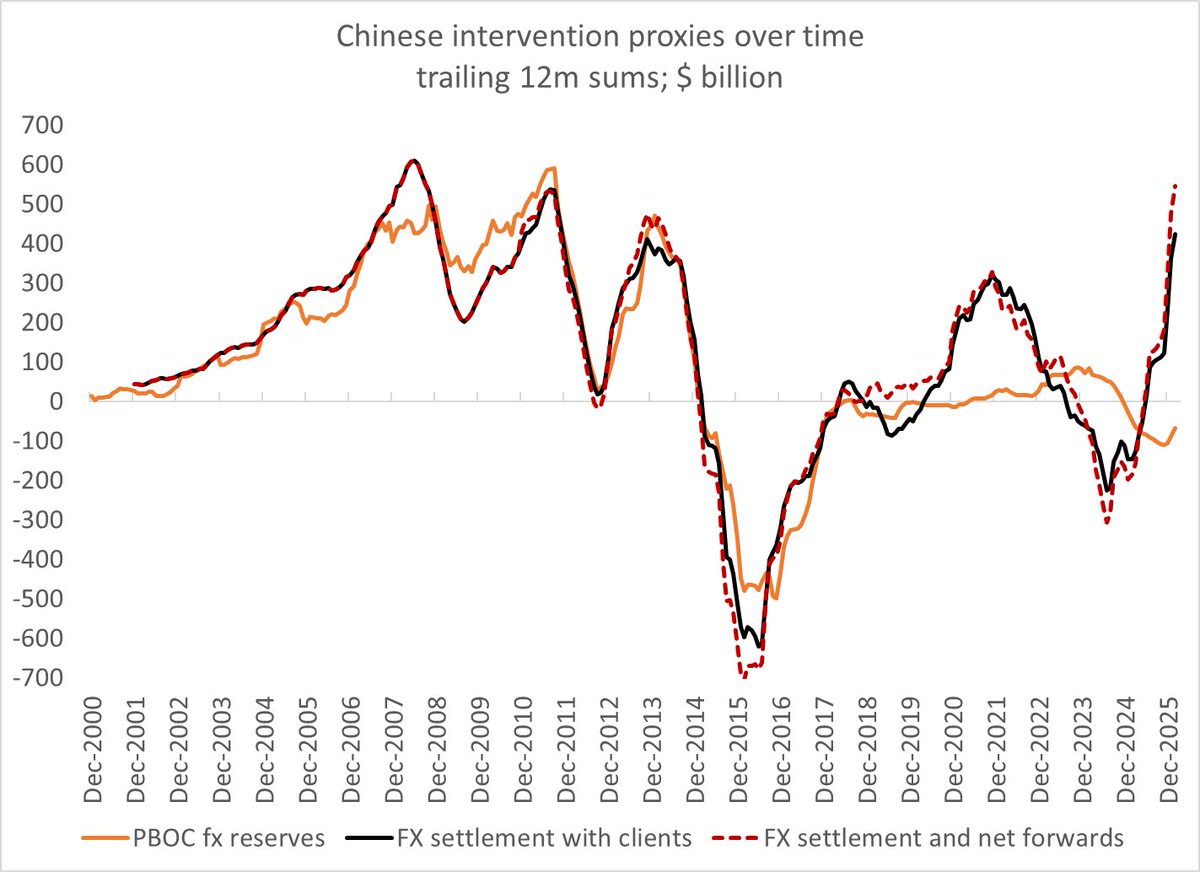
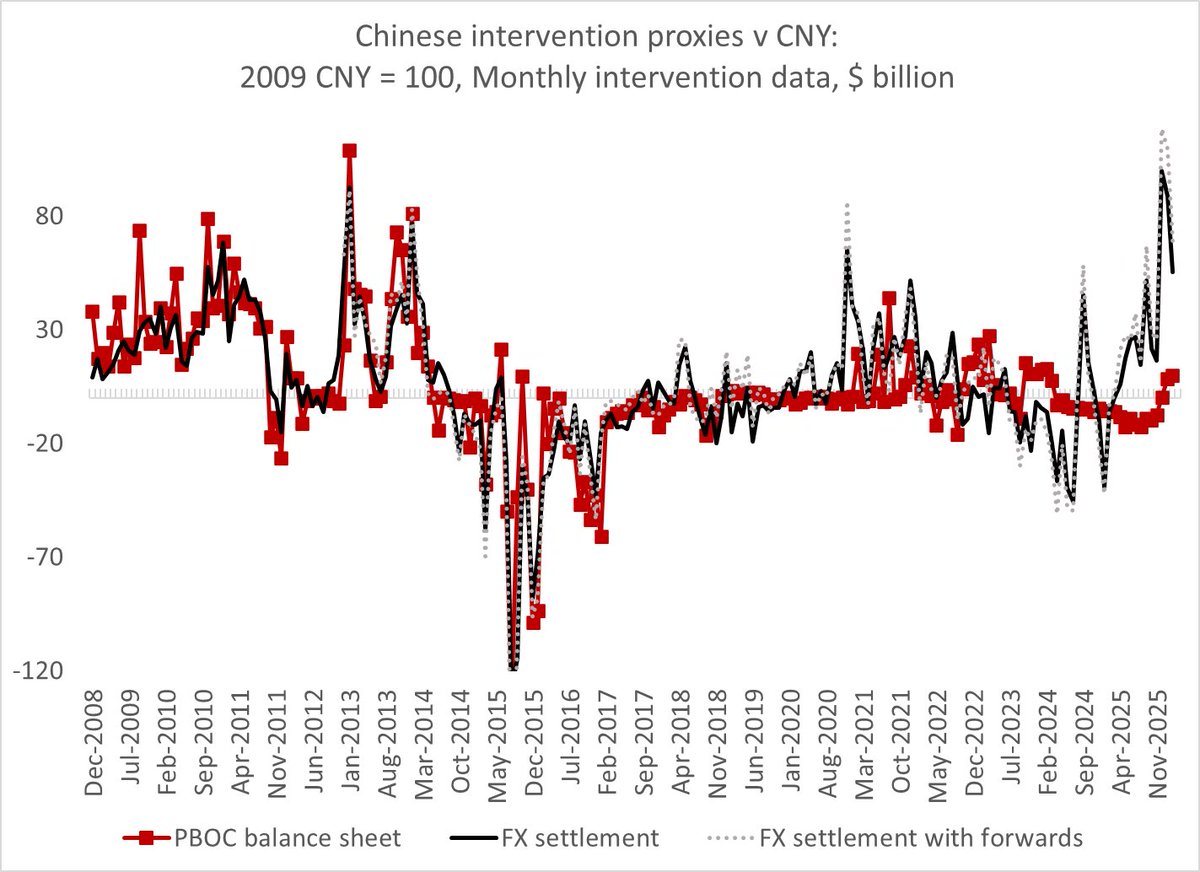
I could go on. For example the BoP shows a $120 billion increase in China's FX reserves over the last 4qs even as the PBOC balance sheet is flat and China says it isn't intervening in the fx market ...
The rise itself of course came even as the CNY has slid. A bit weird.
13/
The rise itself of course came even as the CNY has slid. A bit weird.
13/

But my central point is simple --
There are big questions about the direction of China's economy, & how China impacts the rest of the global economy.
And it doesn't help that there are simultaneously big questions about many basic numbers coming out of China!
14/14
There are big questions about the direction of China's economy, & how China impacts the rest of the global economy.
And it doesn't help that there are simultaneously big questions about many basic numbers coming out of China!
14/14
p.s. it should go without saying that I think the IMF needs to do more than just focus on China's "true" fiscal deficit. This surveillance cycle really should delve into the BoP data -- and the Fund should insist the world's #2 economy put out GDP components in levels.
@schwab_clarence And I share the consensus view that the GDP data has been smoothed for a very long time. hence the lack of level series on components.
• • •
Missing some Tweet in this thread? You can try to
force a refresh