1/ Apologies for the lack of posts recently. My thoughts have not changed from this thread, which is still on track.
For now, here are a few things I am watching and why I am NOT short.
For now, here are a few things I am watching and why I am NOT short.
https://twitter.com/jaredhstocks/status/1678930827445686274
2/ I have gotten countless messages and mentions asking if "this is it," "what's next?" Remember PAYtience! I started writing that thread the day after June OPEX ended. Nothing has changed, we are still on track per expectations.
https://twitter.com/jaredhstocks/status/1678938683360129024?s=20
3/ While I certainly did not foresee a US credit downgrade, It looks like that was the catalyst to give us the initial pullback. Funny how that worked out. The credit downgrade has zero immediate day-day impact on the equity market.
https://twitter.com/jaredhstocks/status/1678941226450419714?s=20
4/ Hopefully you guys can understand now why I chose to add Sept $VIX calls as my protection. While this is NFA, I still believe that until we see a clear trend change, $VIX calls are one of the best ways to protect against an unforeseen event.
https://twitter.com/jaredhstocks/status/1678938665672908800?s=20
5/ Here are a few reasons why I am not short (SPX puts) yet and what I believe is the best way to play the final leg.
I see the market extremely well hedged for any further downside. This adds a suppressive floor that inevitably caps the downside until these hedges are monetized
I see the market extremely well hedged for any further downside. This adds a suppressive floor that inevitably caps the downside until these hedges are monetized
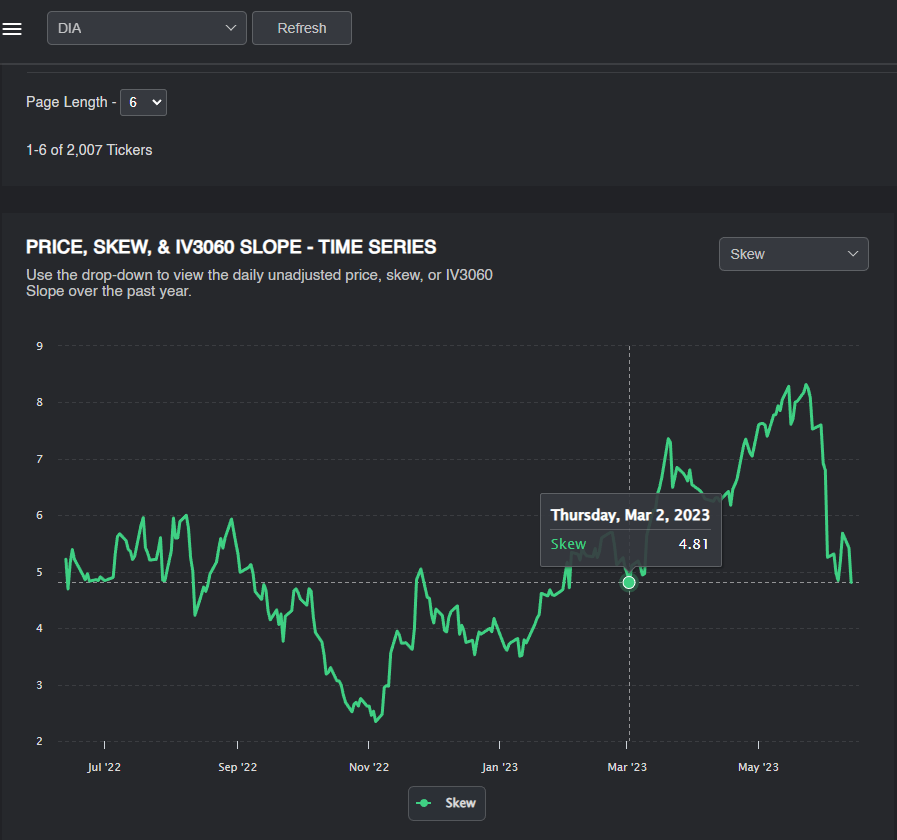
6/ Here is my message before CPI day. The vol risk premium as measured with FWDVOL instead of RealizedVol is wider than the SVB blowup in March. SPX needs to be consistently making -1%+ moves to support what this is pricing. Clearly that's not happening. 

7/ @Ksidiii Tweet summarizes exactly my point. By the way, he is a fantastic follow and I highly recommend checking out his work. TL;DR there needs to be a serious catalyst and reaction or else this "extra" vol gets sold off which can support markets.
https://twitter.com/Ksidiii/status/1689966234782031872?s=20
8/ Another reason why I'm not short yet: Dealers are well supplied. Look at the IV on the Sept 4400p. Imaging buying those? Participants are hedged/quick to monetize. Dealers then release the deltas on these puts which adds upward pressure on the index.
https://twitter.com/danny_kirsch/status/1690067142618599424?s=20
9/ Think about all the folks who have now been holding WORTHLESS shorts/protection since May because they thought the index would breakdown from that consolidation phase. The MOMENT they see green they will monetize their positions. Again, adding a "floor" on the downside.
10/ I expect a bounce here but where we end up will be extremely critical. If $SPY can't manage to get above the 456 gap, let alone 453 and retake the 20SMA, sound the alarm. Here is why I still expect 464 to be seen and one more move higher.
11/ The final stretch should be painful, unjustified, and completely irrational. I laid this out in my longer thesis.
https://twitter.com/jaredhstocks/status/1678938670404083713?s=20
12/ Think of Jan-Feb 2020 before the Covid crash. Pullback, one more leg higher even though everyone knew what was going on, and then boom. Something like this is my expectations from @ka1n0s which by the way is another great follow.
https://twitter.com/ka1n0s/status/1689145783822774272?s=20
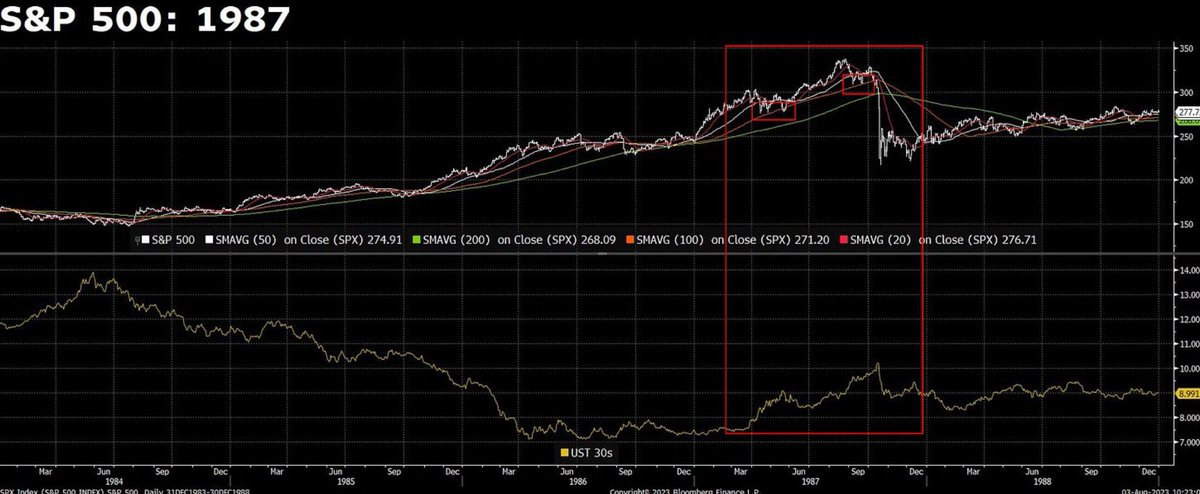
13/ I already pointed out the 2000 bubble. This 1987 chart from @TheCarter758 (great follow as well) shows exactly our environment. Rates breaking out but somehow $SPX managed to make another push higher. All of these examples have one thing in common, a last painful push higher.
14/ This is why I don't like puts YET. When I see that the floor is removed, I will join. For now I will remain in my VIX calls in the event that I am wrong. Here is how I believe this final leg should be played.
Long dated calls with convexity. Think Oct-Nov.
Long dated calls with convexity. Think Oct-Nov.

15/ If your style is more tactical and short term, 2-4 day moves, then something like two week out calls can work. This order flow is from Friday 8/11. Yes I know this isn't much premium, It's just for an example.


16/ Here is another must read thread that will explain the mechanical unwind from dealers this week which adds to my thoughts in this thread. Once again, @Trade_The_Swing is a fantastic follow.
https://twitter.com/Trade_The_Swing/status/1689716474728861696?s=20
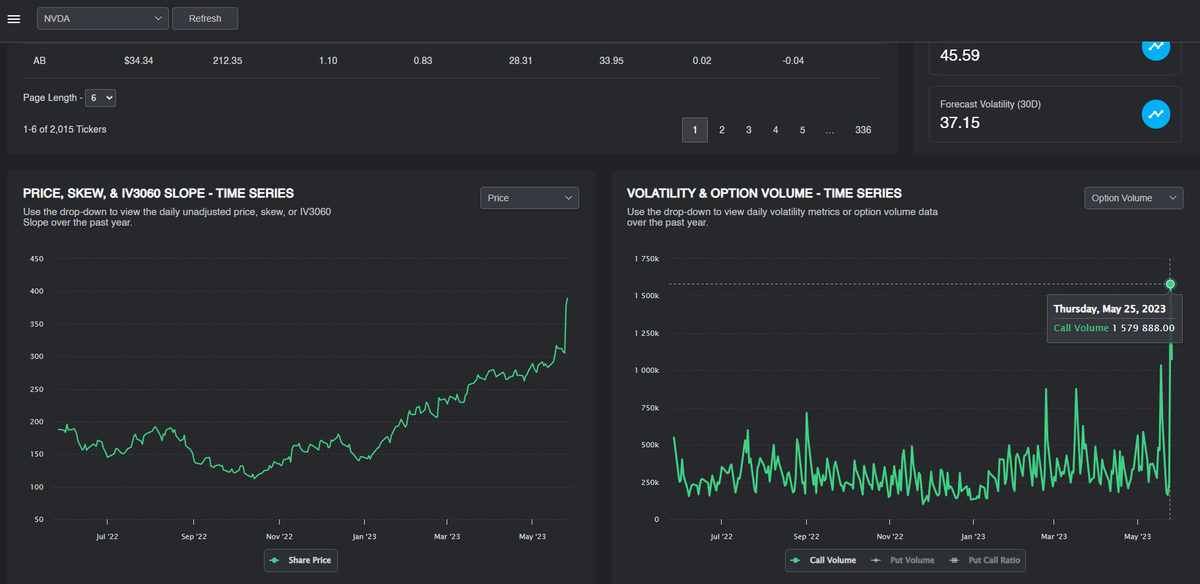
17/ Look at the put volume and how quick participants are to short. This is the 3rd highest reading of the year. Sure it's a double edged sword but is it justifiable?
https://twitter.com/zerohedge/status/1689829536387547136?s=20
18/ Retail vs Non-Retail flows this past week👀


19/ While this could be the leg to $SPY 430 as outlined in the linked thread, I don't want to see price loose the 50SMA. In the case that I am wrong here, plan B is 430>464. To play it safe use the 20SMA as confirmation. Monthly close under 430=top is in.
https://twitter.com/jaredhstocks/status/1684705918280491008?s=20
20/ Now more than ever it's extremely important to remember to hedge your trades and follow strict risk management practices. The Marine Corps will teach you to always have a plan B/exit strategy. The same rules are applied to the markets.
21/ I am working on a detailed thread outlining dispersion trading, correlation, why the index vol is pinned, and what the outcome can be. Hint: 2018. Be on the lookout for that and the thread re-affirming my long term $SPX price target (2750).

22/ Whether you agree or disagree with what I have outlined in this thread, I would love to hear your guys thoughts. I welcome all feedback including constructive criticism. Trade safe & stay diligent, cheers!
• • •
Missing some Tweet in this thread? You can try to
force a refresh