Jared Profile picture
Volatility/Flows/Convexity
6 subscribers
Jan 12 10 tweets 9 min read
The case for long dated upside volatility?

This week JPM put out a report that I thought was interesting, so I wanted to look at it a bit more in-depth. In a long story short, they said to buy 3-5 year ATM UpVar (or an at the money upside variance swap). I know that 99% of people reading this aren’t quants or vol guys, so the 1% that are, please bear with me.

A vanilla variance swap in the most simplistic form allows a participant to hedge/speculate on the difference (variance) between Implied Volatility and Realized Volatility over the time period agreed on in $SPX for example. Basically if the realized variance is higher than the agreed upon strike variance then you will profit.

So here’s an example: Let’s say that JPM sells me a 1 year $SPX VarSwap with a strike Var of 484 (22% squared). You believe that Trump coming into office will bring significant market fluctuations and what’s currently expected, 22%, is low. You think it’s more like the market realizes 28% (784 squared). So you go and buy that 484 strike swap. If after let’s say 3 months of holding the swap the market realizes higher than the 22%, you will profit. There’s still factors like implied variance left etc that will affect the contract but for simplicity sake, I’m leaving that out.

An UpVar (upside variance) version is just a tweaked condition of this vanilla swap. It specifically uses OTM calls in the calculation to speculate/hedge on the upside realized variance only when the underlying is above a fixed spot level. The most simple way to think about this is like buying a call on SPX with the expectation that skew will flatten. Or in other terms, puts become cheaper and calls become more expensive on a vol basis.

Now that you understand this, the report will become much easier to understand.

Thread🧵Image JPM believes that the UpVar in the SPX complex is too cheap historically and that you should buy those swaps. More specifically the 3-5 year ones.

They say that 1) The term structure is flat for long-dated tenors, especially from 3Y onward. Led by equity markets’ strong returns coupled with low realized correlation while structured product issuance keeps longer tenor volatility even more suppressed. 2) Historical data shows an increasing probability of spot remaining in the range for longer tenors. 3) Mark-to-market for longer dated tenors offers a safer range as upside implied volatility is floored. 4) Backtests indicate limited downside risk from current entry levels, with the worst loss for 3Y trades over the past 30 years at around 1.5 vol. 5) Build Vega inventory.Image
Apr 2, 2024 10 tweets 12 min read
1/ Selling “penny puts” in the $SPX complex has become commonplace in today’s markets, it’s essentially now a socially acceptable practice amongst portfolio managers. This is the story of James Cordier from Optionsellers, a fund that blew up and the infamous $150M margin call.Image 2/ Before we dive into how selling $SPX penny puts and Optionsellers is connected, it’s important to begin with the story of Cordier’s fund and career.

James began his career at Heinold Commodities in Milwaukee as a broker in 1984. After establishing a good reputation in the industry, he took his expertise and founded Liberty Trading Group in 1999. The futures/options brokerage would use options to bet on the prices of wheat, natural gas, and corn. From there, the group would eventually morph into what we know as the infamous Optionsellers fund. The fund managed about 300 high net worth clients who ranged from the owner of the Tampa Bay Lighting to elderly folks in their 90s.

In 2005, James wrote the book, “The Complete Guide to Option Selling: How Selling Options Can Lead to Stellar Returns in Bull and Bear Markets.” The book went on to be published by McGraw Hill in 2015. He also was a regular guest analyst on CNBC, Bloomberg Television, Fox Business News, and had publications on major news outlets like the Wall Street Journal. It’s safe to say that people trusted James with their money and his fund quickly grew in AUM.Image
Image
Mar 18, 2024 9 tweets 10 min read
$SPX Is it finally time for a deeper pullback?

Essentially since November, I’ve had zero interest in playing any sort of SPX downside. I've discussed the possibility in this quoted tweet but have refrained from an entry, until now. I’ve mainly been sitting long VX to play the spot/vol correlation breaks and continue to do so.

The market is in my opinion, gearing up for a larger pullback into the $SPX 4780-4820 range that I've discussed extensively before, and a likely pause at 4980. With QOPEX rebal on deck, I imagine that participants take this generational buying opportunity to long what they missed out on. Assuming I'm correct here in the target of 4780-4820, my plan from there is to flip back long at least for a bounce if not new highs into summer when AMs take their yachts on vacation.

This market has been incredibly resilient over the last year and it's important to not marry any one side. I will continue to trust what the data is telling me, not narratives, and position accordingly. Remember this message now (SPX 5165) and the current euphoric sentiment around the markets. Over the last few months, everyone wished that they bought at 4800 and begged for a pullback but was forced higher as to not underperform their benchmarks. When we get there, I imagine the sentiment will be so negative that nobody will want to step in front of it when in reality, it was just a shakeout of the froth. This is similar to May 2023 when everyone begged for a test of 4200 to buy, but when the Oct 2023 lows occurred at 4100, nobody wanted to buy it, but me. While my conservative target stands at 4780-4820, I wouldn't be surprised if we undercut a bit like in the Oct bottom around 4650 which I'd consider that a blessing.

Listen, I sit long VX and would make out like a bandit during a tail event but it's going to take some seriously systematic shocking news for that to happen. The second VIX cracks 20s, the systematics will try to hammer the VRP back down and party like it's 1999. With that, all the events upcoming are well telegraphed. I believe this will be similar to June 2023 when $VIX went from 13 to 18 and SPX pulled back a few hundred points but we saw fixed vol get hammered with supply. This is because there is ZERO secret we are extended and "due" for a pullback where market participants are hedged/prepared and will monetize when we reach those lower spots.

When I started taking the markets seriously as a profession, my mentor told me one thing that sticks with me to this day. “Skinny pigs get fat, fat pigs get slaughtered.” This has kept me getting my ass handed to me countless times. For that I will not hesitate in closing out my position the second if the market tells me I’m wrong which will be closes over 5165 (rounding by a few points for simplicity). In conjunction, I’d need to see vol and positioning confirm.

Although most could care less for my reasoning, I’ve already stated a few in my quoted tweet, but here’s a couple; FSV/vol structure, Hawkish Powell, tax season, QOPEX rebal, BOJ, blackout period for buybacks, autocallables + more. I'd be happy to dive more into this. Structure-wise I believe this is a delta play and I like spreads to mitigate carry costs. There is also a lot of event risk with BOJ, NVDA, and FOMC where a synthetic put might help to alleviate this risk. You can hedge any structure straight short-term convex calls if need be, but there is some event vol baked into this week (which is a trade in itself). Again, this is a strong upward trend and I understand that I’m fighting it, but I’m willing to take risk-defined bets when I see dislocations. I don’t expect anything to majorly start until 3/21 and the bulk of the move taking place next week. I welcome any constructive criticism. Cheers! 🍻

Who do you want to be Powell? Miss your shot here and the legacy is set...Image Happy Monday, I hope everyone has a fantastic week!
For those wondering, yes, I still see this playing out. Holiday shortened week with less liquidity as most firms are either on Spring break or early Easter. This simply means that the path of least resistance is flat to up but any significant news or flow can cause some extensive volatility as it takes less volume to move markets as opposed to a "normal" week. There is also less time-weighted opportunity to hedge when the market is pricing nothing for this week, keep this in mind. Diamonds have already given back the majority of it's FOMC gains and I expect SPX will follow suit. I'd still need to see 5180 be lost and further at 5146 with a clear reach for downside to remain confident. If by Tuesday 4/2 and Wednesday 4/3 this does not happen, I'll happily admit defeat but obviously this trade wouldn't be easy, it never is. I'm no market technician but the price action from 3/4-3/20 looks like distribution with the post-FOMC pop acting as a failed "look above" and back to the range, this is a common pattern. Institutions take time to move large positions and I don't believe they are getting silly up here in FOMO.

In terms of flows: We have a very large QOPEX on deck this week. Most sell-side desks have net selling for EOQ rebal with pensions due for the largest reduction (anywhere from $35-50 billion) which adds to my thesis. The $JHEQX roll is upcoming and dealers are already preparing for the roll. We are well above the upper-end sold call of 5015 so as of this writing I'd assume a non-event. Let's say we close the week at 5200 then the new strikes will be in the ballpark of short 4250p, long 4950p, and short 5450c (obviously not exact). Another large flow is in structured products where billions in index autocallables sit. We also get all of your exotics/delta one flows from correlation traders (dispersion trades) to swaps. Coming very soon is the impact of tax season on equities. Overall these are well telegraphed flows and participants know it’s coming, albeit large enough to have an impact.

I'll update the vol structure in the next tweet with fixed strike, floating vol, skew, FWDVOL, FWDFactor, etc etc. To note: I am seeing a decent bid in downside skew for May while April remains intact. Cheers 🍻
Jan 18, 2024 8 tweets 4 min read
1/ A recent study showed a whopping 41% of users say X can impact investment decisions.
You would think the world is ending with the mass influx of recently negative sentiment & IV at 3 month highs, yet $SPX realized volatility continues lower and is -1.5% from all time highs. Image 
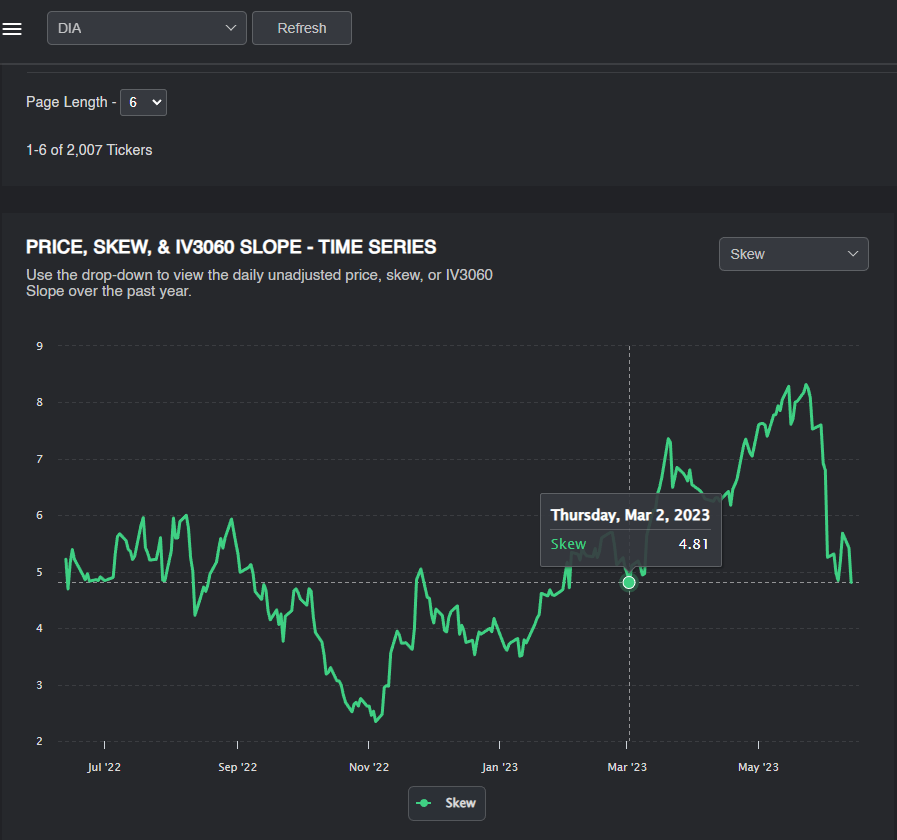
2/ Today saw the entire vol surface be re-priced higher, aka Fixed strike vol up about half a point. This is in part due to the recently large $VIX trades I have covered and some large put spreads opened. Skew and IV have reached 3 month highs, dating back to November.
Image
Image
Jan 13, 2024 10 tweets 3 min read
1/ As someone who trades index vol on a daily basis, every time a large $VIX call order comes in, it draws a lot of attention from less sophisticated investors who believe Volmaggedon 2.0 is here.

TL;DR ignore the noise… For now. 2/ To clear up some misconceptions about this trade, there is zero immediate impact unless vol actually starts to get going here. This can be a large portfolio hedge as $VVIX and the $VIX sit near all time lows while the cost to hedge is nearly the “cheapest” on record.
Jan 9, 2024 8 tweets 3 min read
1/ I think this is an extremely important issue/example that needs to be drilled home, and what I believe sparks the next major tail event. While it’s “funny” to us, it shows the lengths as to what current PMs go through to try and generate a fraction of Alpha in today’s markets. 2/ When I started out in vol trading “sell a cab, drive a cab” was one of the first lessons I was taught. This simply means if you sell the "dogshit" options then expect "dogshit" results. For example, if you buy 1 month $TSLA 1000c for 0.01, IT'S PRICED 0.01 FOR A REASON.
Nov 13, 2023 25 tweets 10 min read
1/ $SPX This past week saw the most extreme retail gamma imbalance (-$14B) in history.
$IWM recorded the highest ever call OI on record.
With OPEX this week, participants will look to monetize delta-positive positions.
Is Santa at risk of bringing coal with CPI/PPI?
Image
Image
2/ Let’s kick things off by looking at our current vol profile. As you can see, IV has crashed lower since the recent peak on 10/27. 30d IV has moved down about 7%. This is similar to the same decline in IV after the SVB crisis in March. Even 180d IV is down substantially.
Image
Image
Oct 2, 2023 12 tweets 5 min read
1/ The lackluster reaction from vol markets while $SPX has sold off 250 points in 2 weeks is rather concerning for a bear case.
Skew and fixed strike vol are both either flat or down. 1M RVol sits at 11 with $VIX at 18.
These speak to the monetization of hedges on the way down.
Image
Image
2/ This is a PnL chart of the $SPY 10/20 420p. The purple boxes highlight the June selloff, August, and now September. Do you notice any similarities? Sure there's a buck to be made overnight but the suppression is quite clear for $25 lower in 2 weeks. Image
Aug 13, 2023 22 tweets 8 min read
1/ Apologies for the lack of posts recently. My thoughts have not changed from this thread, which is still on track.

For now, here are a few things I am watching and why I am NOT short. 2/ I have gotten countless messages and mentions asking if "this is it," "what's next?" Remember PAYtience! I started writing that thread the day after June OPEX ended. Nothing has changed, we are still on track per expectations.
Jul 12, 2023 58 tweets 20 min read
1/ Capitulation.

$SPX 4543 2/ Before we get into new information, it’s important to understand what happened as it lays the foundation behind this thread. I have covered April and May extensively so I am focusing on June/July here.
Buckle up, this is a long one. You'll understand why at the end.
Jul 6, 2023 8 tweets 4 min read
1/ Clear warning was given yesterday as vol markets did not agree with the price action. That move is being realized today. With NFP tomorrow, the only point that matters is the 20SMA. Time may catch up to price once again like on 6/26. If this happens... a massive Vanna squeeze. 2/ $SPY Today, skew has gone vertical and back to June 1st levels. We now have about a 4% Vol risk premium between IV and RV. Clearly some fear is in the air which is also evident in the +13% increase in 1 month $VIX futures.
Image
Image
Jun 16, 2023 16 tweets 5 min read
1/ It's June Opex. Time for a small update on the markets & my own account. 2/ I have already highlighted the lowest $COR90D reading since October 2008 in my recent post.
Now $QQQ just recorded the 2nd lowest skew reading of the entire year.
$SPY Skew dates back to December 2022.
$IWM Skew just recorded a record low. ImageImageImage
Jun 13, 2023 8 tweets 4 min read
1/ $SPY Skew has now flushed out March banking crisis levels.
$QQQ Skew back to Jan 9th.
$IWM Skew now at Nov 2022 and a massive vol risk premium present.
$DIA Skew also has flushed out to March levels.
The market is pricing perfection for FOMC. Trust data not narratives🎯 ImageImageImageImage 2/ $COR3M Currently, this is the most uncorrelated market since Volmageddon. Levels this low occur during market tops, not bottoms.
$COR90D (Crash risk) has bottomed. The narrative that hedges need to be flushed out from the March banking crisis are wrong. Its already happened. ImageImageImage
May 28, 2023 25 tweets 10 min read
1/ $NVDA The next "meme" stock?

Up 247% from it's October bottom. 1.6 Million calls traded on May 25th, the highest call volume in 2 years.

How does it compare to the peak of GameStop's gamma squeeze?

How can we use the $GME saga to form a trade on $NVDA?

Lets dive in! Image 
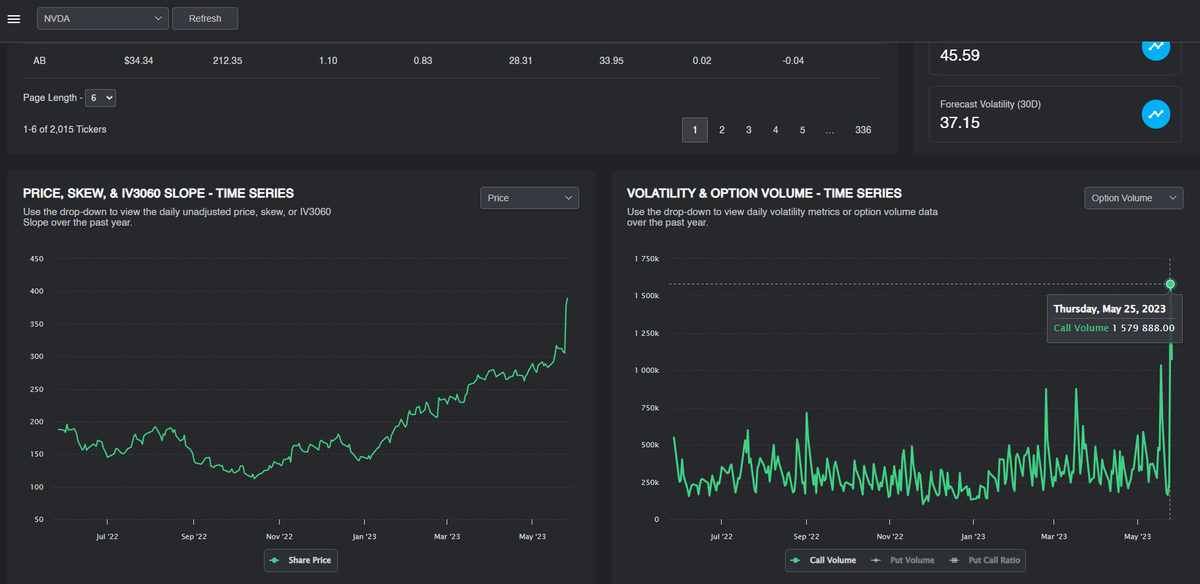
2/ In case you are new or need a refresher, here is a split-adjusted chart of $GME at it's peak. A near 10,000% increase with 370 Million shares traded. $NVDA reached it's all time high on 5/25, the day after the earnings report. ImageImage
May 2, 2023 25 tweets 10 min read
1/ With $SPY skew at new 1YR highs today and the $VIX up 15%, volatility is finally back into the markets. But with a 24% IV for an ATM straddle, are the current risks being underpriced, or will the bulls finally reach 4200?

Here is how to prepare for FOMC/ $AAPL and beyond. Image 2/ The vol cone illustrates IV across different expirations, currently and historically. Options are still not even past the first quartile mark or near the median IV. This signals that there is no fear in the short term. Image
Apr 9, 2023 22 tweets 7 min read
1/ Roulette, "an unbeatable game unless someone steals money from the table when the croupier isn't looking." -Albert Einstein.

That is until Niko Tosa, a gambler who did the impossible.

How we can use the story of Tosa to beat the Stock Market?

bloomberg.com/features/2023-… 2/ Niko Tosa and his friend walked into the Ritz casino in London with £90,000 and left with £1.3 million in one night. An unheard of victory at the roulette table. The story still shocks industry executives 20 years later to this day.

How did he manage to do this?
Mar 6, 2023 34 tweets 12 min read
$SPY Welcome to the lowest realized volatility since January 28th, 2022. Is the market discounting current risks? Let's dive in.

1/ Since the start of last week, you can see from the two charts below that options have moved back towards contango, and IV/RV just get crushed. The VRP gap is being closed.

2/
Feb 5, 2023 37 tweets 13 min read
$AAPL and $QQQ had the highest ever call volume on record last week. The market internals are flashing warning signs. ImageImage Before adding new information, it's important to understand what happened last week as it paints the full picture of my analysis. I will review some options flow, volatility insights, FOMC, earnings, economic data, and a few other data points to expand upon my previous thread.