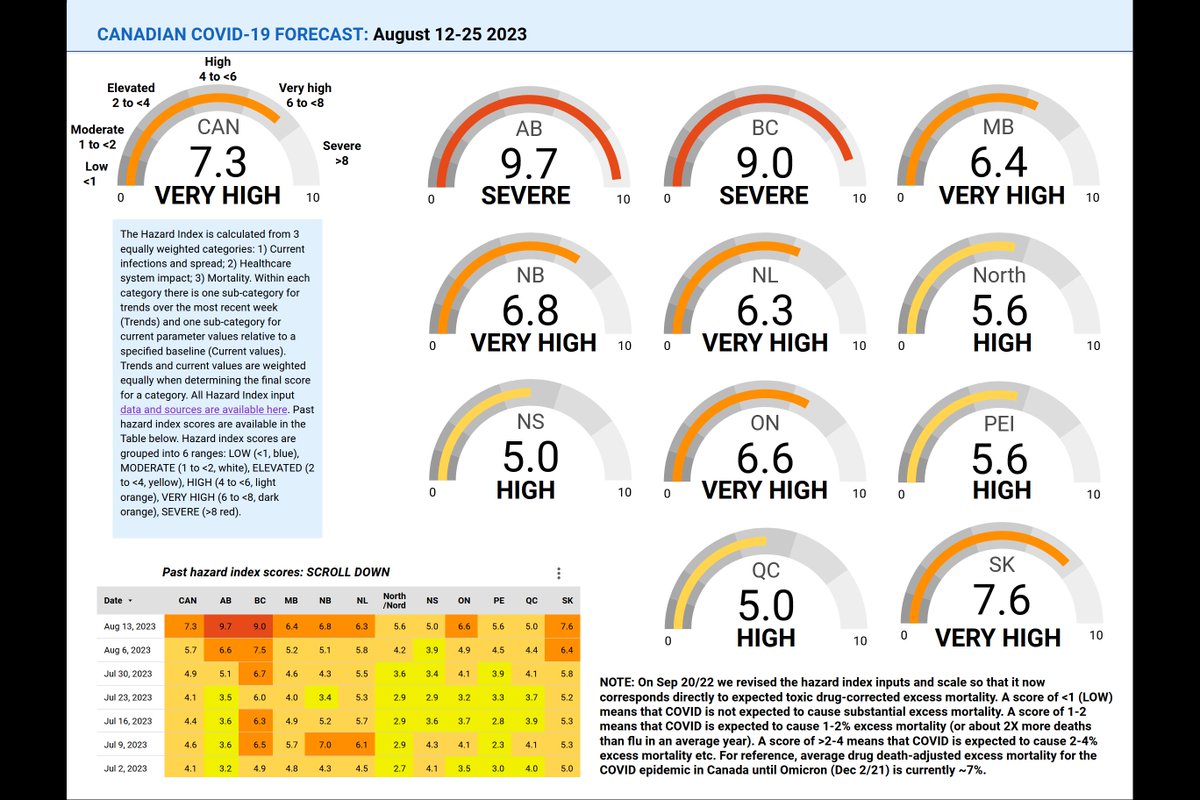
Canadian COVID Forecast: Aug 12-25, 2023
SEVERE: AB, BC
VERY HIGH: CAN,MB, NB, NL, ON, SK
HIGH: North, NS, PEI, QC
ELEVATED: none
MODERATE: none
LOW: none
About 1 in 46 people in Canada are CURRENTLY infected.
A new surge/wave has started in most provinces.
/1
SEVERE: AB, BC
VERY HIGH: CAN,MB, NB, NL, ON, SK
HIGH: North, NS, PEI, QC
ELEVATED: none
MODERATE: none
LOW: none
About 1 in 46 people in Canada are CURRENTLY infected.
A new surge/wave has started in most provinces.
/1
Studies show even Mild Covid can have long term effects. #MasksKeepUsSafe.
Graphic is courtesy of BIRCH, @BIRcovidhealth, used with permission.
/2
Graphic is courtesy of BIRCH, @BIRcovidhealth, used with permission.
/2

@BIRcovidhealth THREAD OUTLINE:
-Tweets 4-6: Links to data sources, resources
-7-10: Current Canadian COVID situation compared to previous years
-11-17: Estimated under-detection/under-reporting rates by province
-18-47: Current COVID Forecasts and excess mortality by province
/3
-Tweets 4-6: Links to data sources, resources
-7-10: Current Canadian COVID situation compared to previous years
-11-17: Estimated under-detection/under-reporting rates by province
-18-47: Current COVID Forecasts and excess mortality by province
/3
@BIRcovidhealth Information about methods, forecast inputs, estimated infections, long COVID cases, hospital and ICU admissions and deaths is available in our biweekly report at link here:
/4covid19resources.ca/covid-hazard-i…
/4covid19resources.ca/covid-hazard-i…
@BIRcovidhealth Information about excess mortality in every Canadian province is available in our monthly report at link here:
/5covid19resources.ca/public/excess-…
/5covid19resources.ca/public/excess-…
@BIRcovidhealth Do you have questions about:
-this week’s forecast
-COVID
-vaccines
-masks
-risks of specific activities
We can help!
You can join one of our free evening Zoom sessions by signing up at the link here:
/6covid19resources.ca/discussions/
-this week’s forecast
-COVID
-vaccines
-masks
-risks of specific activities
We can help!
You can join one of our free evening Zoom sessions by signing up at the link here:
/6covid19resources.ca/discussions/
@BIRcovidhealth Average weekly severe COVID outcomes in Canada in 2023 compared to weekly average for 2020-2022:
-Reported hospitalizations: 16% higher
-Reported ICU admissions: 45% lower
-Reported deaths: 56% lower
-Excess deaths: 3% lower
/7
-Reported hospitalizations: 16% higher
-Reported ICU admissions: 45% lower
-Reported deaths: 56% lower
-Excess deaths: 3% lower
/7
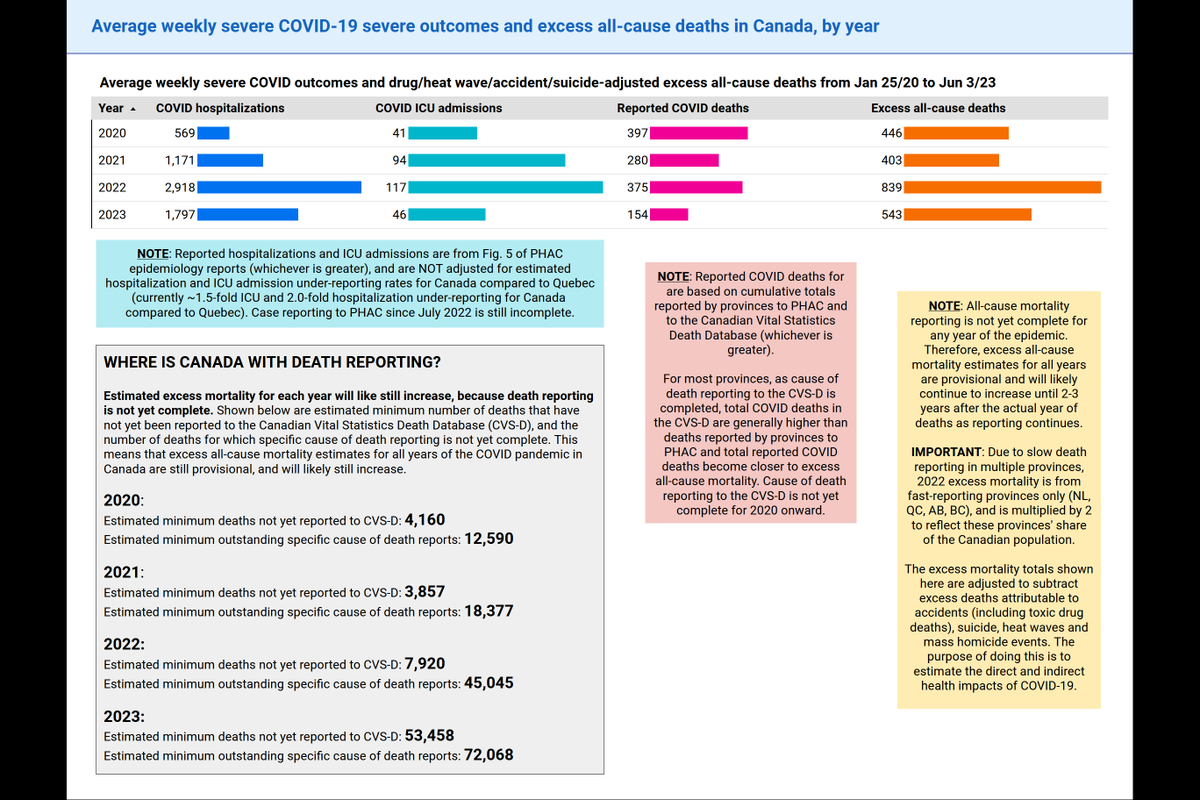
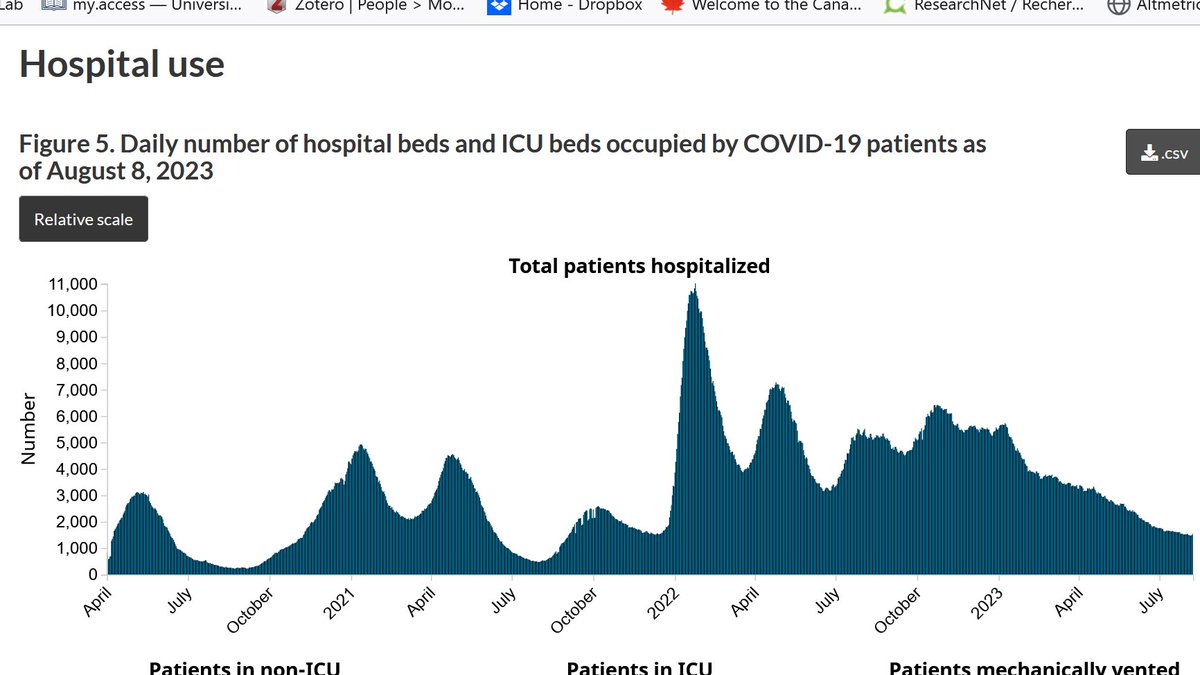
@BIRcovidhealth COVID hospitalizations in Canada: epidemic to date
This is a screenshot from Fig. 5 of the @GovCanHealth weekly COVID-19 epidemiology report found at the link here:
/8 https://t.co/mVw09TbhGVhealth-infobase.canada.ca/covid-19/curre…
This is a screenshot from Fig. 5 of the @GovCanHealth weekly COVID-19 epidemiology report found at the link here:
/8 https://t.co/mVw09TbhGVhealth-infobase.canada.ca/covid-19/curre…
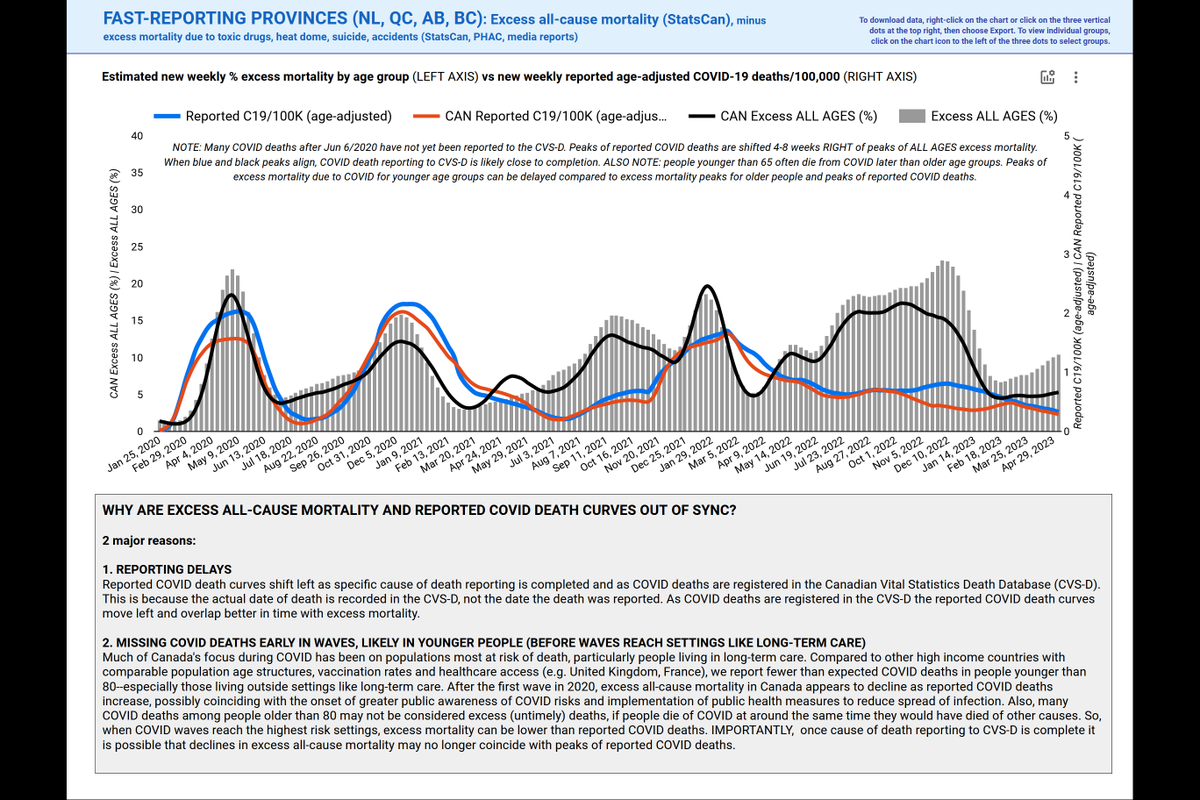
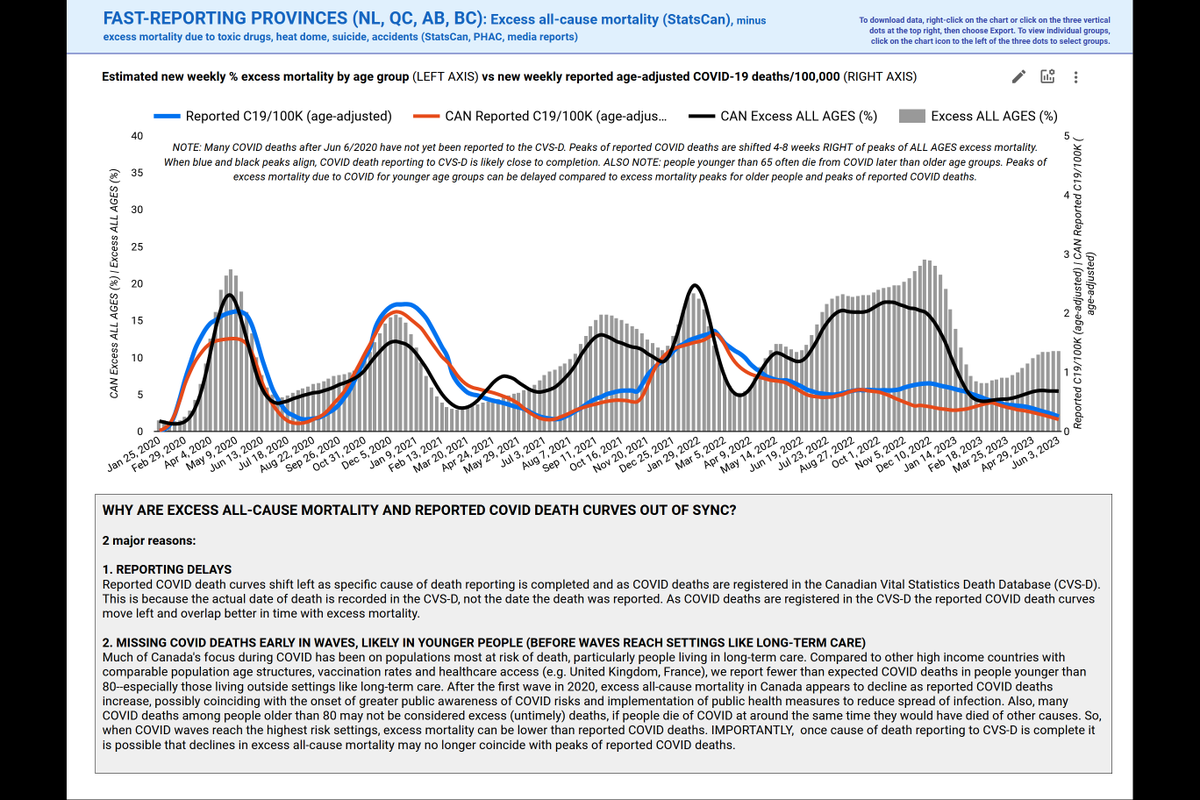
@BIRcovidhealth @GovCanHealth Reported COVID and excess deaths in fast-reporting provinces: epidemic to June 3, 2023
Excess deaths EXCLUDE deaths attributable to drugs, heat waves, accidents, suicide, mass homicide.
Source:
/9 https://t.co/8cBy5x81o2covid19resources.ca/public/excess-…
Excess deaths EXCLUDE deaths attributable to drugs, heat waves, accidents, suicide, mass homicide.
Source:
/9 https://t.co/8cBy5x81o2covid19resources.ca/public/excess-…
@BIRcovidhealth @GovCanHealth Thread about the proportion of Canada’s excess deaths that have been reported as COVID deaths:
Canadian COVID death reporting has declined since the start of the COVID pandemic, compared to medium-large high income democratic peer countries.
/10
Canadian COVID death reporting has declined since the start of the COVID pandemic, compared to medium-large high income democratic peer countries.
/10
https://twitter.com/MoriartyLab/status/1684014743629996033?s=20
@BIRcovidhealth @GovCanHealth Estimated % of COVID INFECTIONS that have been detected and/or reported, Dec 4/21 to present:
CAN 2.3%
NL 4.2%
PEI 13.6%
NS 5.5%
NB 3.7%
QC 3.6%
ON 2.1%
MB 1.4%
SK 1.2%
AB 1.9%
BC 1.3%
/11
CAN 2.3%
NL 4.2%
PEI 13.6%
NS 5.5%
NB 3.7%
QC 3.6%
ON 2.1%
MB 1.4%
SK 1.2%
AB 1.9%
BC 1.3%
/11
@BIRcovidhealth @GovCanHealth Estimated % of COVID HOSPITAL ADMISSIONS that have been publicly reported, Dec 4/21 to present:
CAN 55%
NL 37%
PEI 42%
NS 56%
NB 39%
QC 87%
ON 30%
MB 60%
SK 79%
AB 49%
BC 55%
/12
CAN 55%
NL 37%
PEI 42%
NS 56%
NB 39%
QC 87%
ON 30%
MB 60%
SK 79%
AB 49%
BC 55%
/12
@BIRcovidhealth @GovCanHealth Estimated % of COVID ICU ADMISSIONS that have been publicly reported, Dec 4/21 to present:
CAN 68%
NL 30%
PEI 45%
NS 48%
NB 61%
QC 94%
ON 43%
MB 71%
SK 75%
AB 58%
BC 100%
/13
CAN 68%
NL 30%
PEI 45%
NS 48%
NB 61%
QC 94%
ON 43%
MB 71%
SK 75%
AB 58%
BC 100%
/13
@BIRcovidhealth @GovCanHealth Estimated % of excess ("from") COVID DEATHS that have been publicly reported, Dec 4/21 to present:
CAN 38%
NL 24%
PEI 29%
NS 45%
NB 38%
QC 55%
ON 32%
MB 62%
SK 37%
AB 38%
BC 30%
/14
CAN 38%
NL 24%
PEI 29%
NS 45%
NB 38%
QC 55%
ON 32%
MB 62%
SK 37%
AB 38%
BC 30%
/14
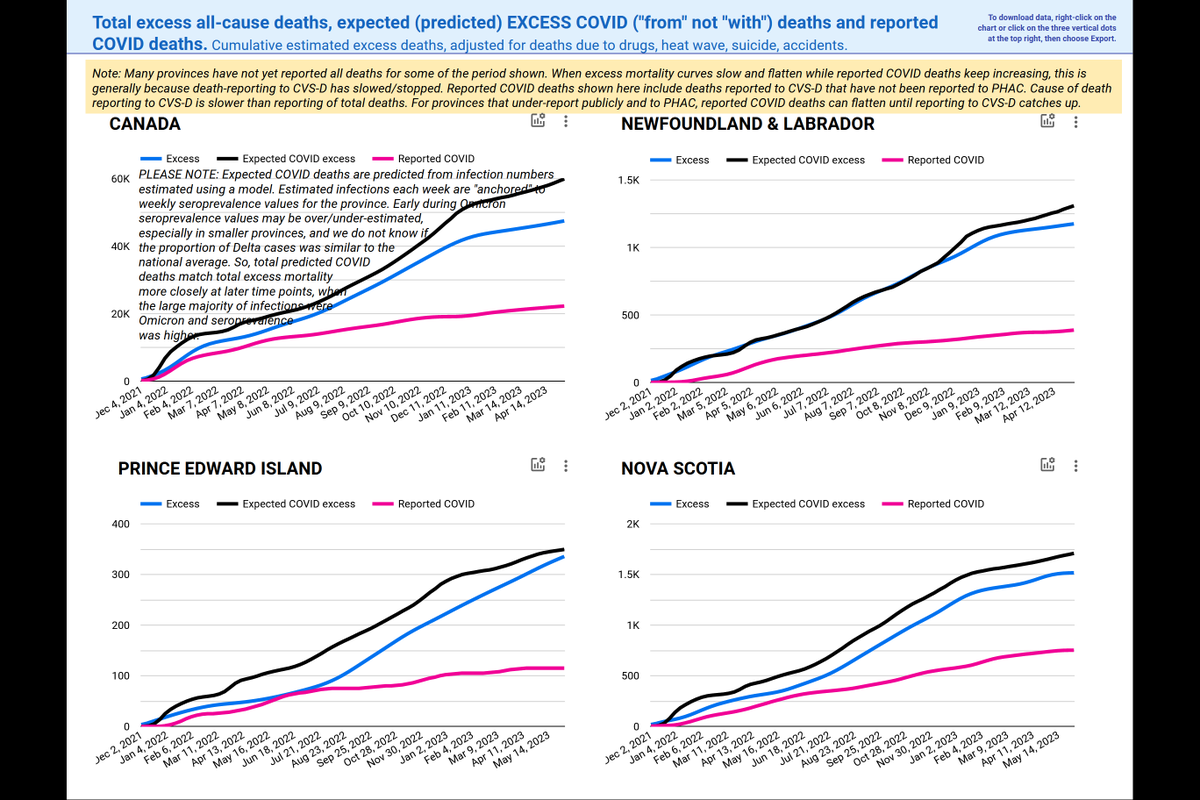
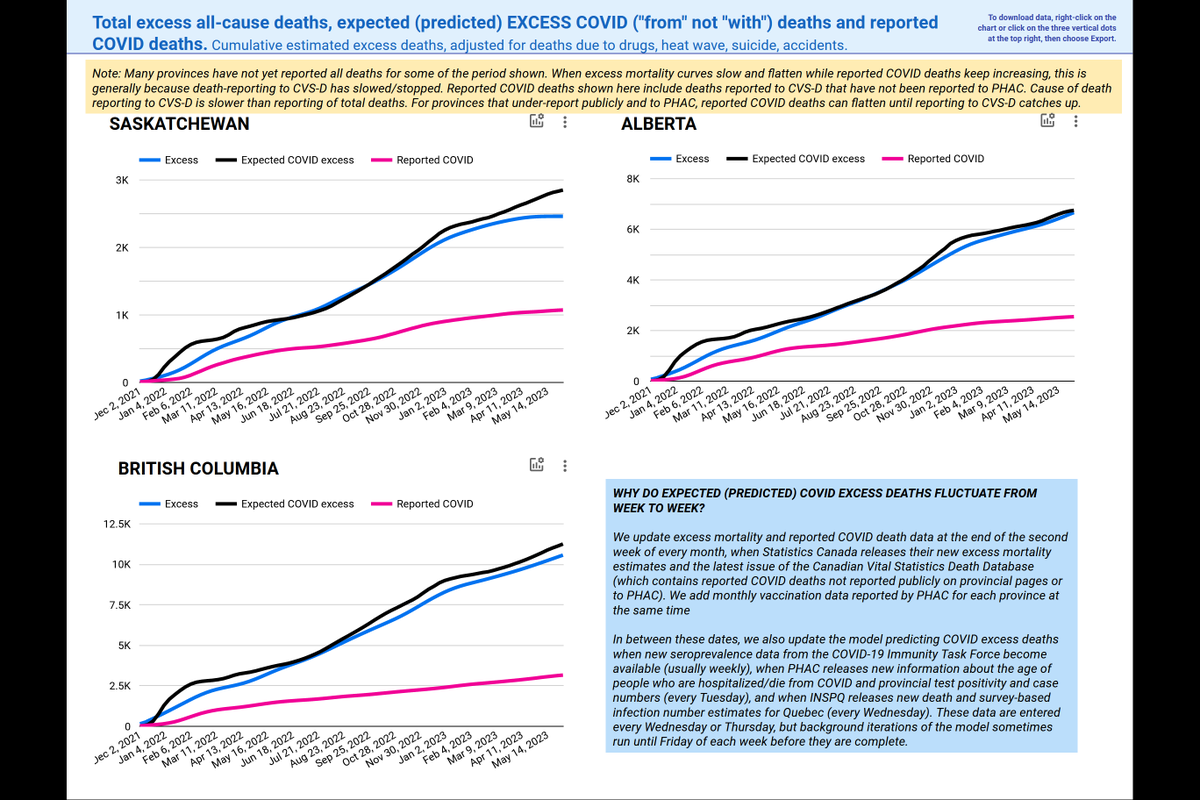
@BIRcovidhealth @GovCanHealth Total expected excess deaths directly attributable to Omicron (black), compared to:
-reported excess all-cause deaths (blue)
-reported COVID-19 deaths (pink)
Shown: Canada, NL, PEI, NS
Source:
/15 https://t.co/0Dui9TPnhLcovid19resources.ca/public/excess-…
-reported excess all-cause deaths (blue)
-reported COVID-19 deaths (pink)
Shown: Canada, NL, PEI, NS
Source:
/15 https://t.co/0Dui9TPnhLcovid19resources.ca/public/excess-…
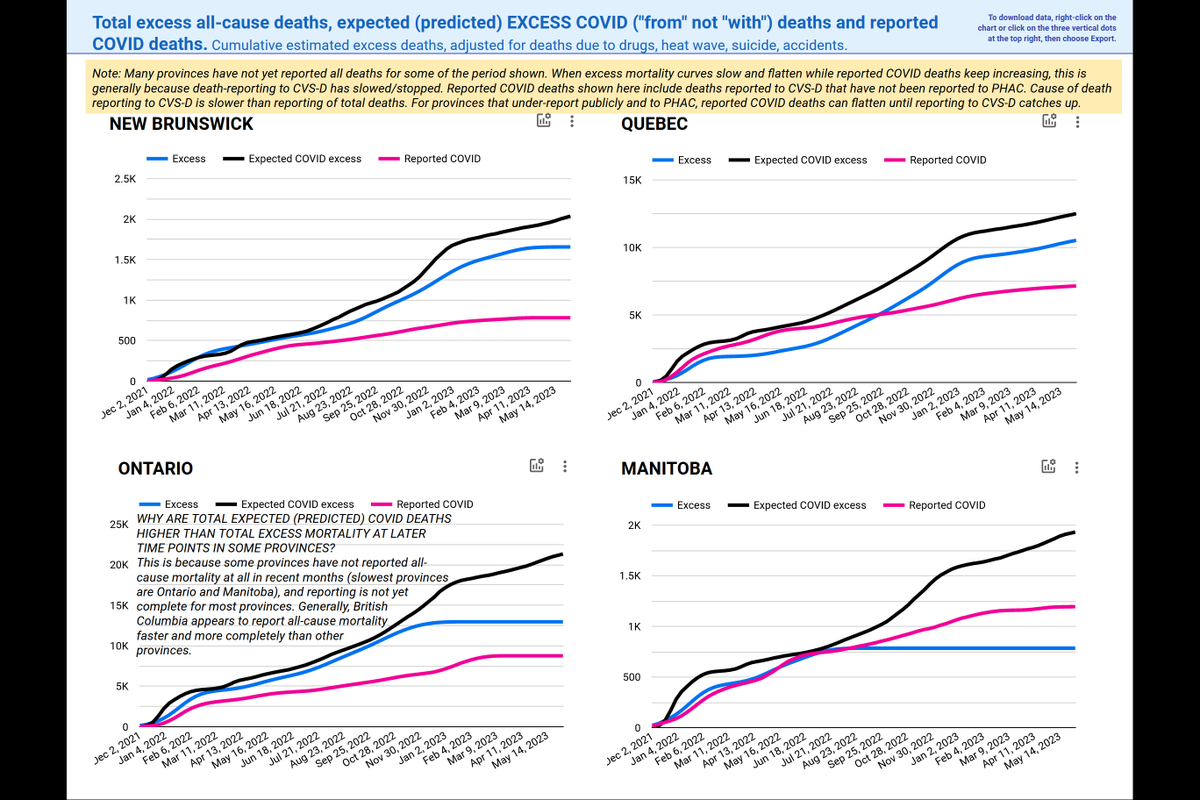
@BIRcovidhealth @GovCanHealth Total expected excess deaths directly attributable to Omicron (black), compared to:
-reported excess all-cause deaths (blue)
-reported COVID-19 deaths (pink)
Shown: NB, QC, ON, MB
Source:
/16 https://t.co/pN32u6so6scovid19resources.ca/public/excess-…
-reported excess all-cause deaths (blue)
-reported COVID-19 deaths (pink)
Shown: NB, QC, ON, MB
Source:
/16 https://t.co/pN32u6so6scovid19resources.ca/public/excess-…
@BIRcovidhealth @GovCanHealth Total expected excess deaths directly attributable to Omicron (black), compared to:
-reported excess all-cause deaths (blue)
-reported COVID-19 deaths (pink)
Shown: SK, AB, BC
Source:
/17 https://t.co/kho7GhYqLScovid19resources.ca/public/excess-…
-reported excess all-cause deaths (blue)
-reported COVID-19 deaths (pink)
Shown: SK, AB, BC
Source:
/17 https://t.co/kho7GhYqLScovid19resources.ca/public/excess-…
@BIRcovidhealth @GovCanHealth Canadian COVID Forecast and excess mortality graphs/info shown in following tweets:
Sources:
https://t.co/6LOstRan9u
/18covid19resources.ca/covid-hazard-i…
covid19resources.ca/public/excess-…
Sources:
https://t.co/6LOstRan9u
/18covid19resources.ca/covid-hazard-i…
covid19resources.ca/public/excess-…
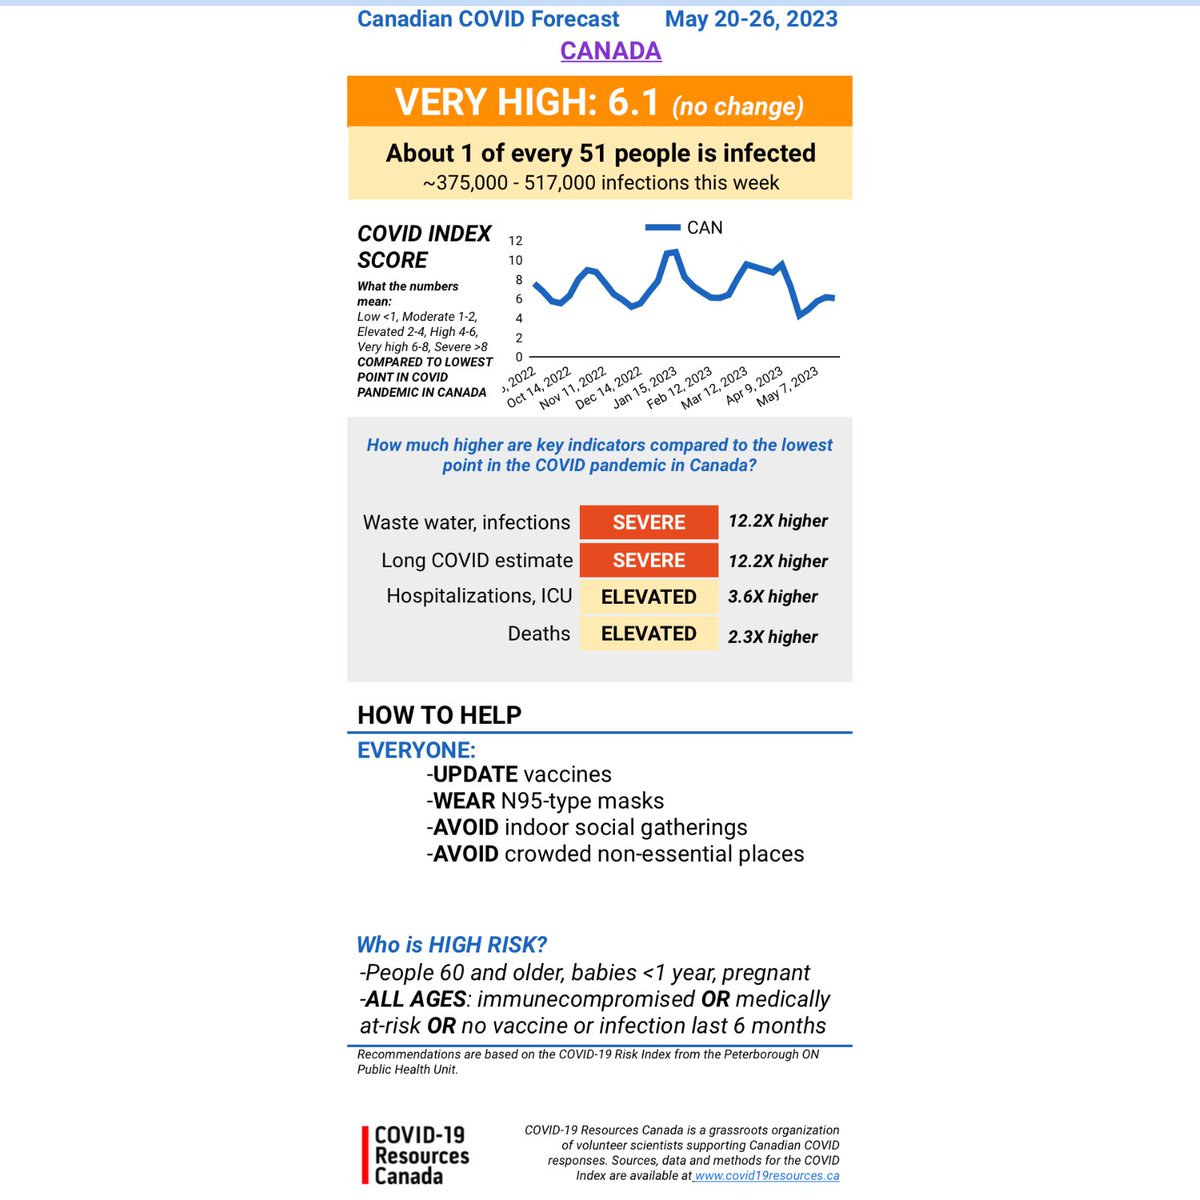
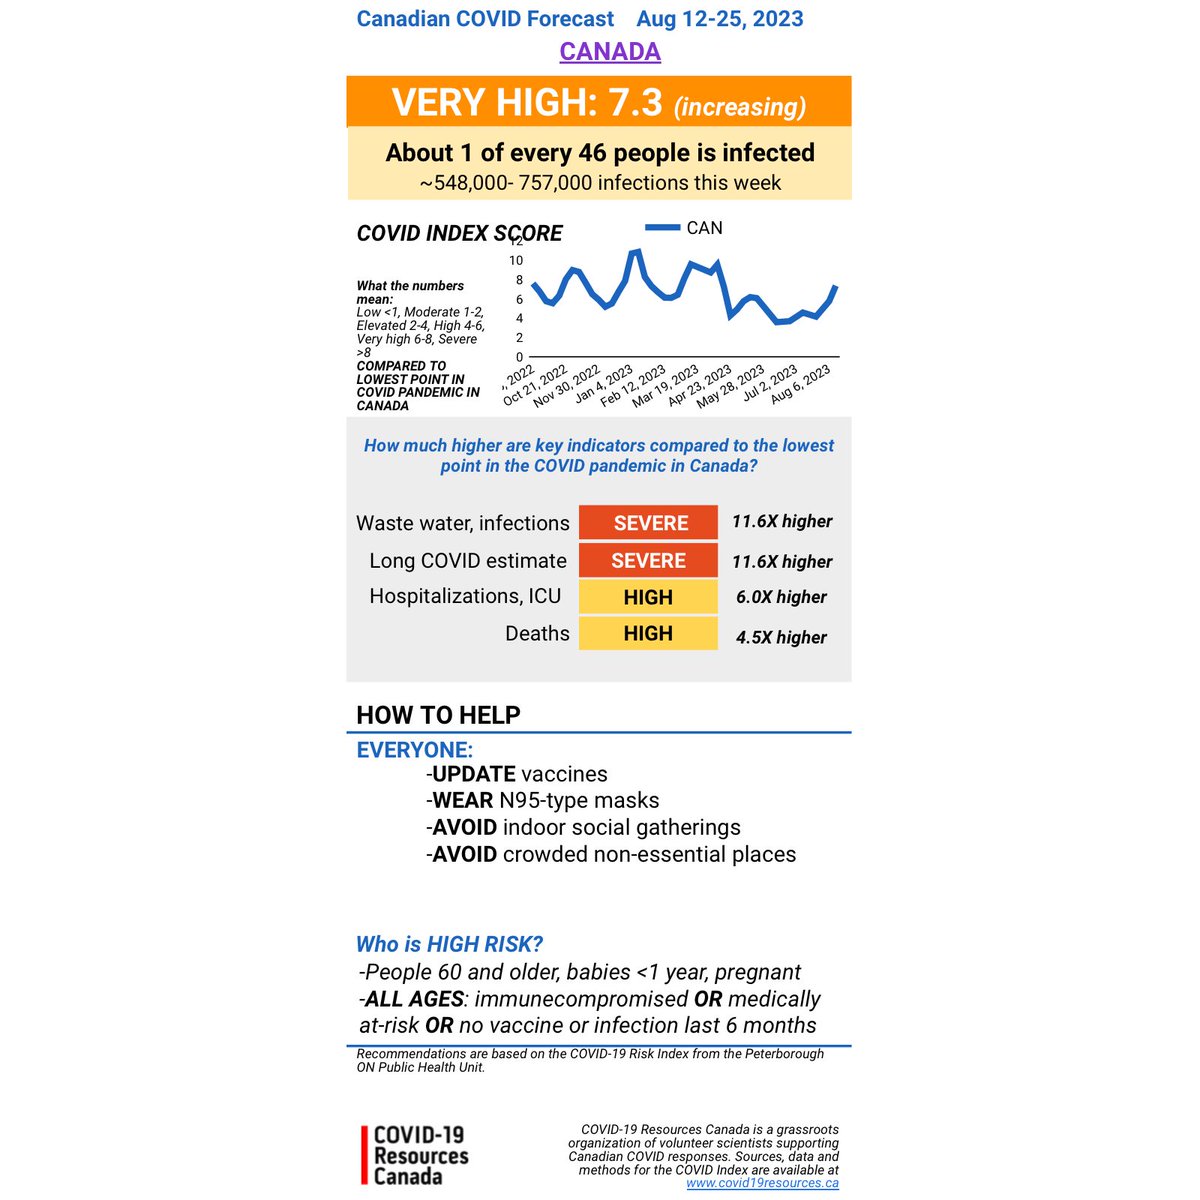
@BIRcovidhealth @GovCanHealth Canadian COVID Forecast Aug 12-25, 2023
CANADA
VERY HIGH (increasing)
About 1 in every 46 people infected
Compared to lowest point of pandemic in Canada:
-Infections, long COVID ~12X higher
-Hospitalizations ~6X higher
-Deaths ~5X higher
/19
CANADA
VERY HIGH (increasing)
About 1 in every 46 people infected
Compared to lowest point of pandemic in Canada:
-Infections, long COVID ~12X higher
-Hospitalizations ~6X higher
-Deaths ~5X higher
/19
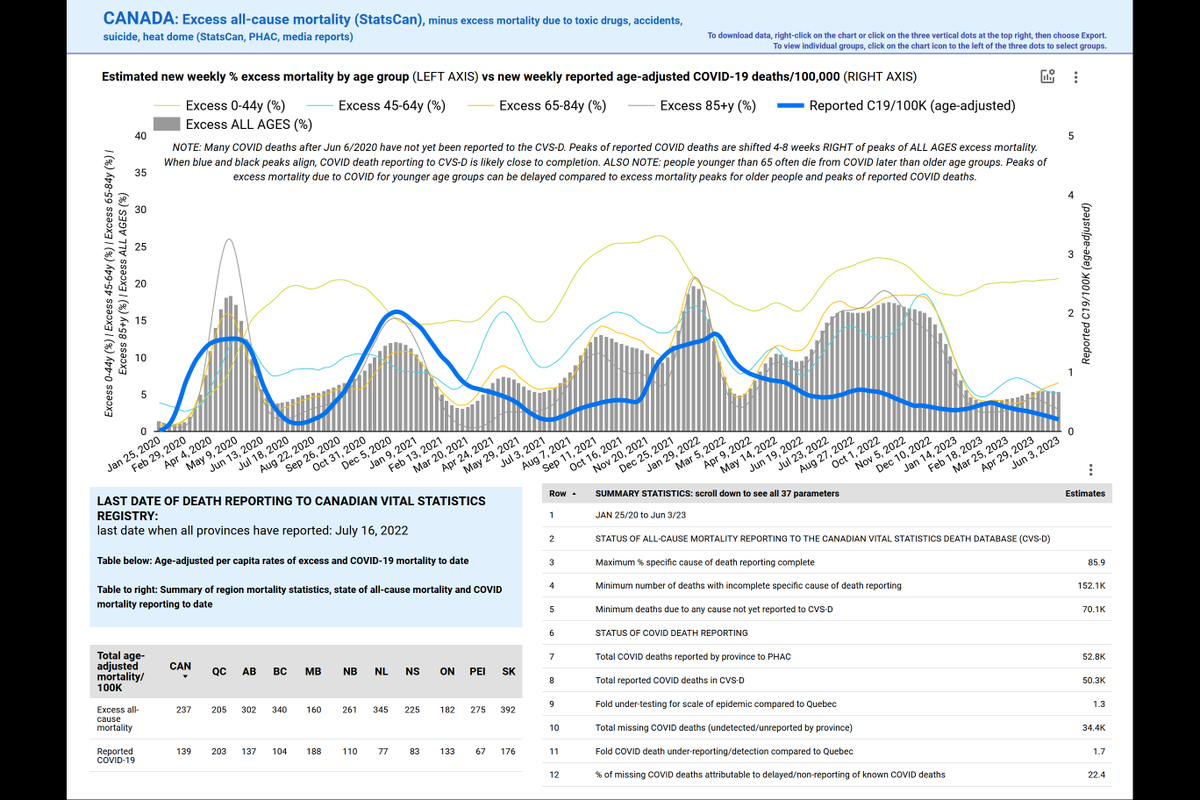
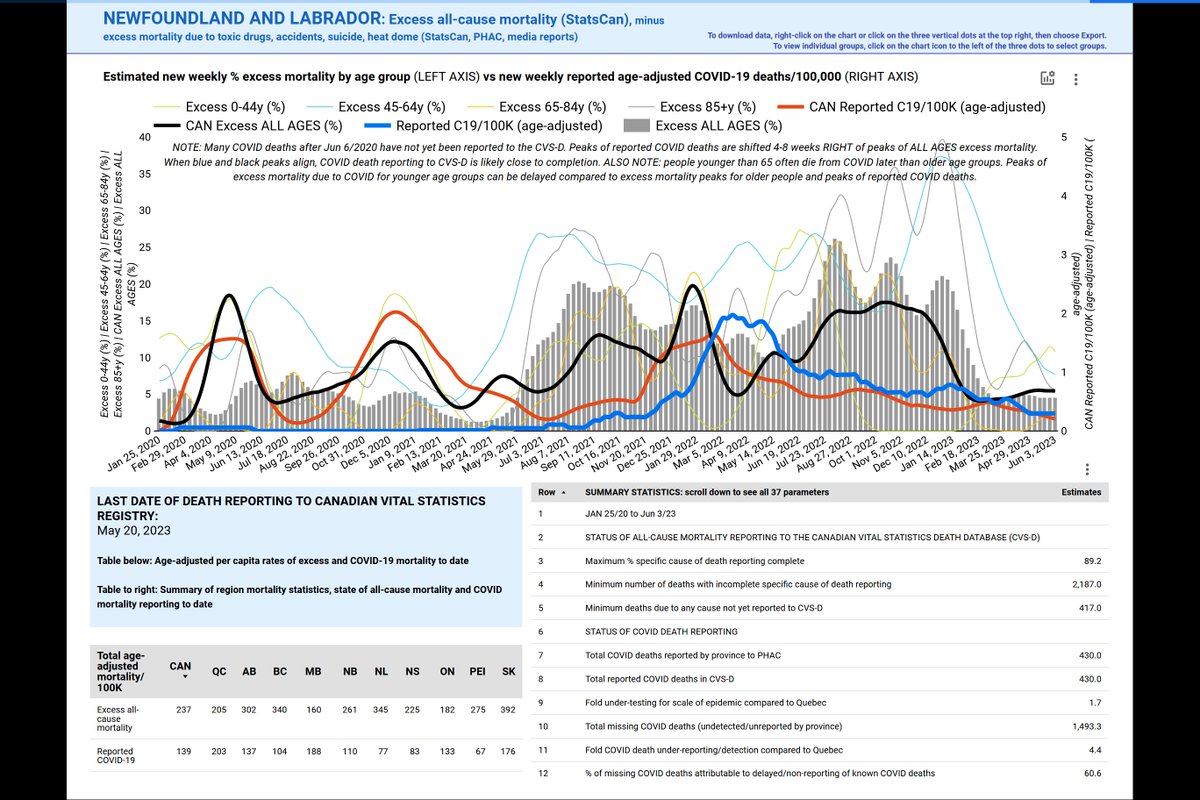
@BIRcovidhealth @GovCanHealth Weekly excess all-cause mortality Jan 25/20 to Jun 3/23
CANADA
Remember: all-cause mortality reporting is delayed in many provinces.
See tweets 15-17 to get a sense of when and where additional excess deaths are likely to be reported over the coming 2-3 years.
/20
CANADA
Remember: all-cause mortality reporting is delayed in many provinces.
See tweets 15-17 to get a sense of when and where additional excess deaths are likely to be reported over the coming 2-3 years.
/20
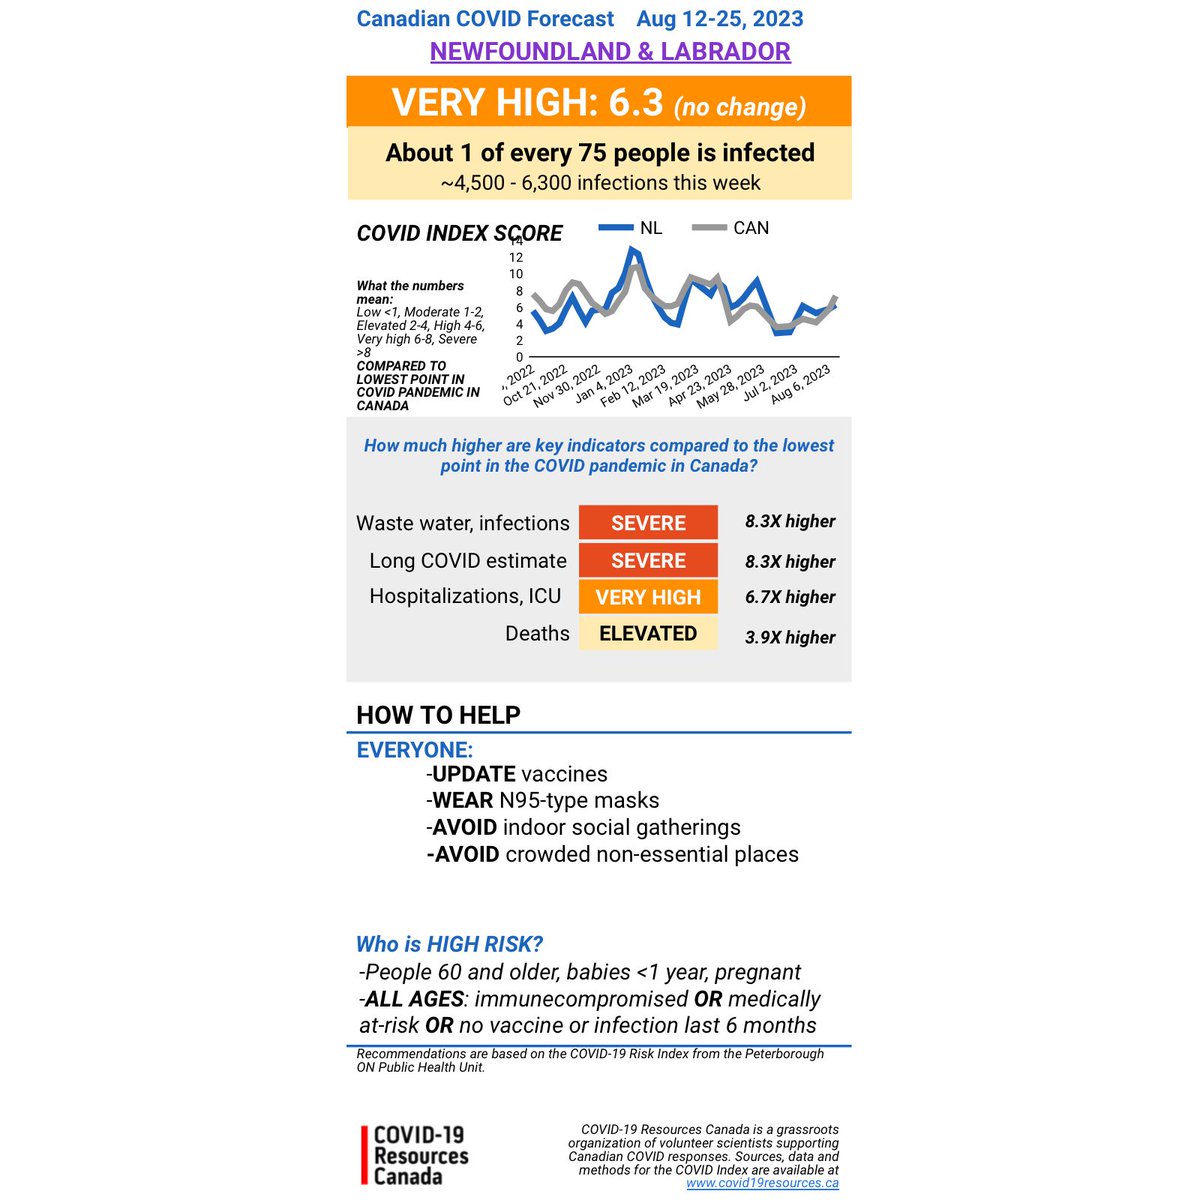
@BIRcovidhealth @GovCanHealth Canadian COVID Forecast Aug 12-25, 2023
NEWFOUNDLAND AND LABRADOR
VERY HIGH (no change)
About 1 in every 75 people infected
Compared to lowest point of pandemic in Canada:
-Infections, long COVID ~8X higher
-Hospitalizations ~7X higher
-Deaths ~4X higher
/21
NEWFOUNDLAND AND LABRADOR
VERY HIGH (no change)
About 1 in every 75 people infected
Compared to lowest point of pandemic in Canada:
-Infections, long COVID ~8X higher
-Hospitalizations ~7X higher
-Deaths ~4X higher
/21
@BIRcovidhealth @GovCanHealth Weekly excess all-cause mortality Jan 25/20 to Jun 3/23
NEWFOUNDLAND AND LABRADOR
Remember: all-cause mortality reporting is slow in many provinces.
See tweets 15-17 to get a sense of when and where additional excess deaths are likely to be reported over the next 2-3 yrs.
/22
NEWFOUNDLAND AND LABRADOR
Remember: all-cause mortality reporting is slow in many provinces.
See tweets 15-17 to get a sense of when and where additional excess deaths are likely to be reported over the next 2-3 yrs.
/22
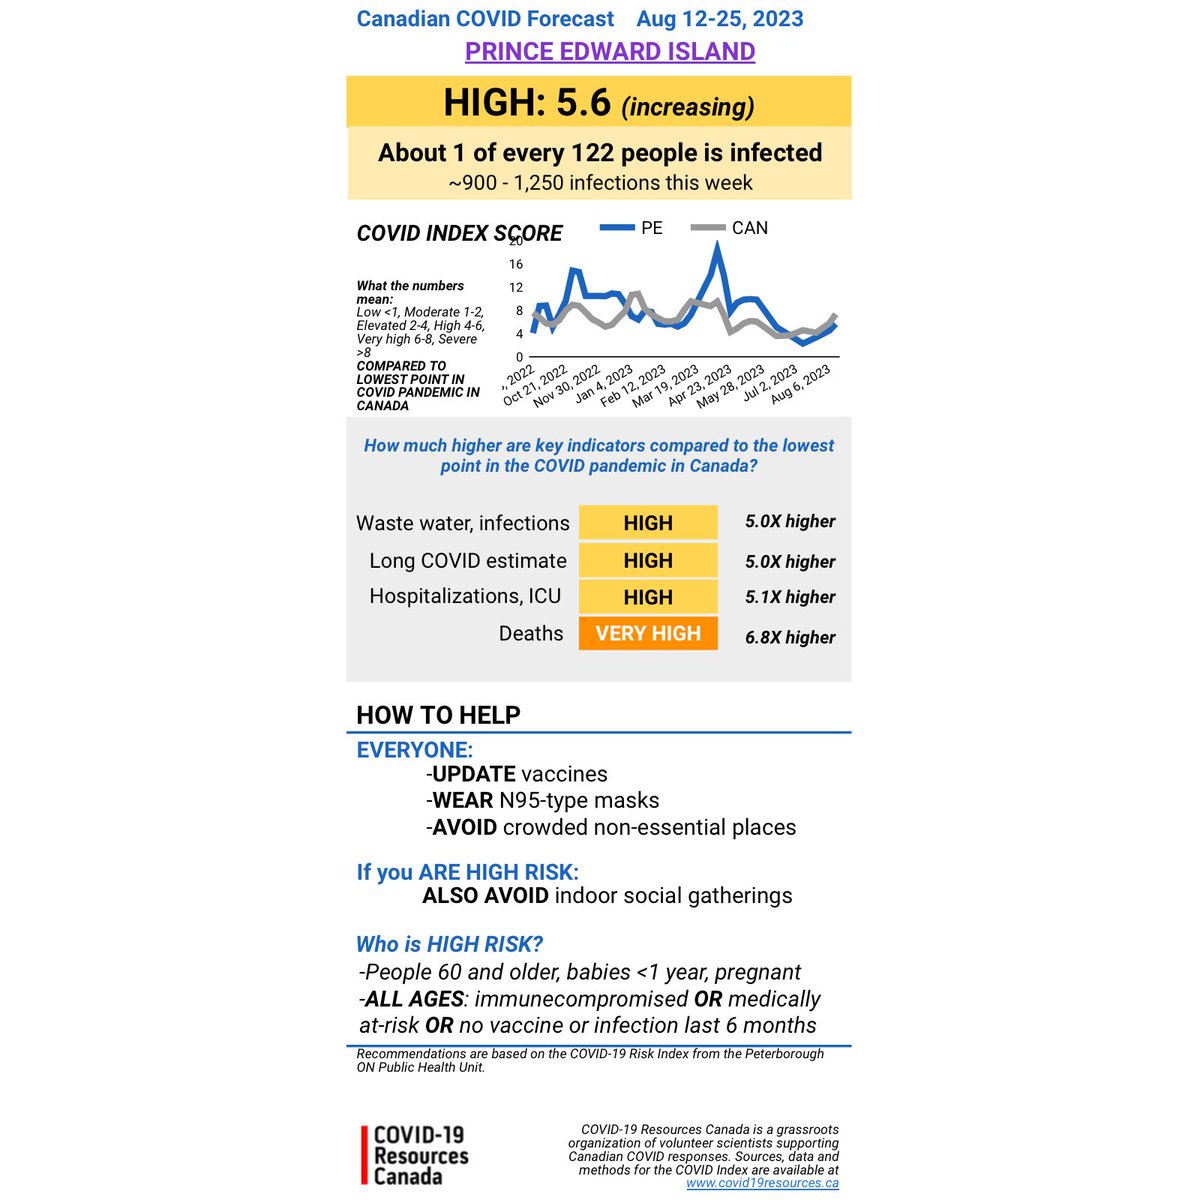
@BIRcovidhealth @GovCanHealth Canadian COVID Forecast Aug 12-25, 2023
PRINCE EDWARD ISLAND
VERY HIGH (increasing)
About 1 in every 122 people infected
Compared to lowest point of pandemic in Canada:
-Infections, long COVID ~5X higher
-Hospitalizations ~5X higher
-Deaths ~7X higher
/23
PRINCE EDWARD ISLAND
VERY HIGH (increasing)
About 1 in every 122 people infected
Compared to lowest point of pandemic in Canada:
-Infections, long COVID ~5X higher
-Hospitalizations ~5X higher
-Deaths ~7X higher
/23
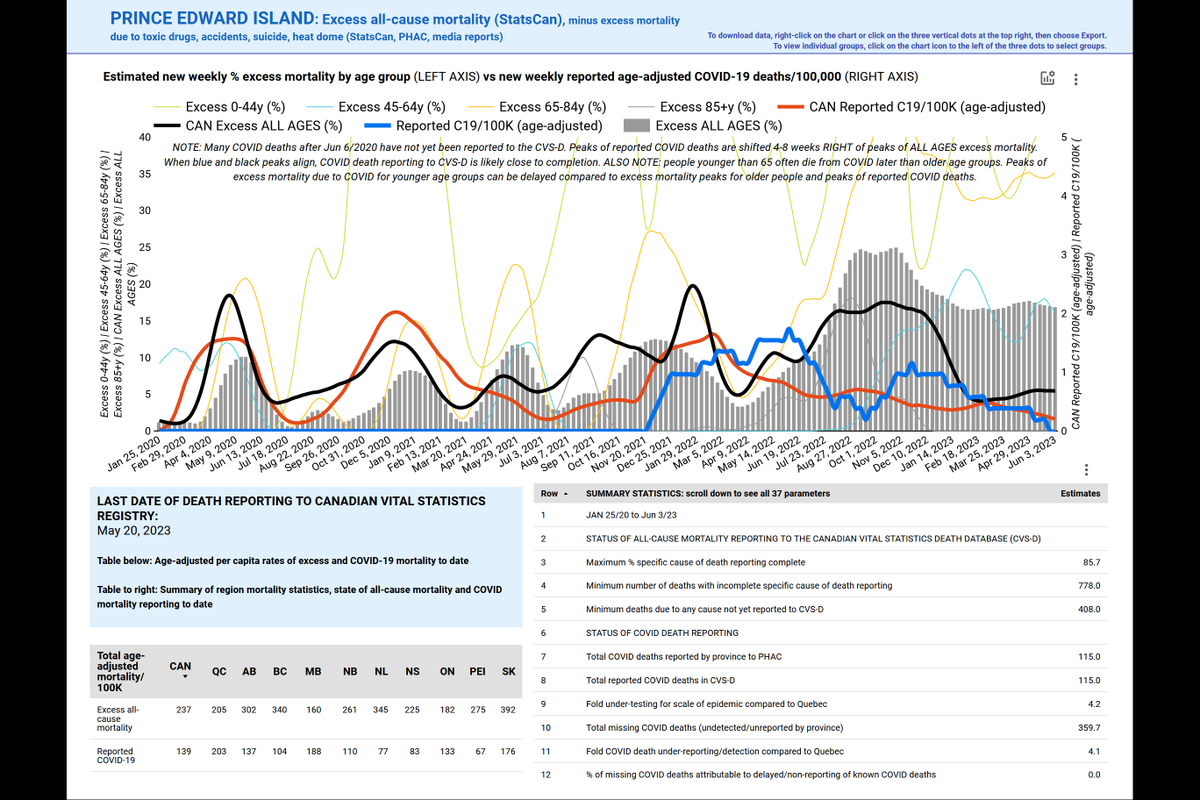
@BIRcovidhealth @GovCanHealth Weekly excess all-cause mortality Jan 25/20 to Jun 3/23
PRINCE EDWARD ISLAND
Remember: all-cause mortality reporting is slow in many provinces.
See tweets 15-17 to get a sense of when and where additional excess deaths are likely to be reported over the next 2-3 yrs.
/24
PRINCE EDWARD ISLAND
Remember: all-cause mortality reporting is slow in many provinces.
See tweets 15-17 to get a sense of when and where additional excess deaths are likely to be reported over the next 2-3 yrs.
/24
@BIRcovidhealth @GovCanHealth Canadian COVID Forecast Aug 12-25, 2023
NOVA SCOTIA
HIGH (increasing)
About 1 in every 151 people infected
Compared to lowest point of pandemic in Canada:
-Infections, long COVID ~4X higher
-Hospitalizations ~8X higher
-Deaths ~3X higher
/25
NOVA SCOTIA
HIGH (increasing)
About 1 in every 151 people infected
Compared to lowest point of pandemic in Canada:
-Infections, long COVID ~4X higher
-Hospitalizations ~8X higher
-Deaths ~3X higher
/25

@BIRcovidhealth @GovCanHealth Weekly excess all-cause mortality Jan 25/20 to Jun 3/23
NOVA SCOTIA
Remember: all-cause mortality reporting is slow in many provinces.
See tweets 15-17 to get a sense of when and where additional excess deaths are likely to be reported over the next 2-3 yrs.
/26
NOVA SCOTIA
Remember: all-cause mortality reporting is slow in many provinces.
See tweets 15-17 to get a sense of when and where additional excess deaths are likely to be reported over the next 2-3 yrs.
/26

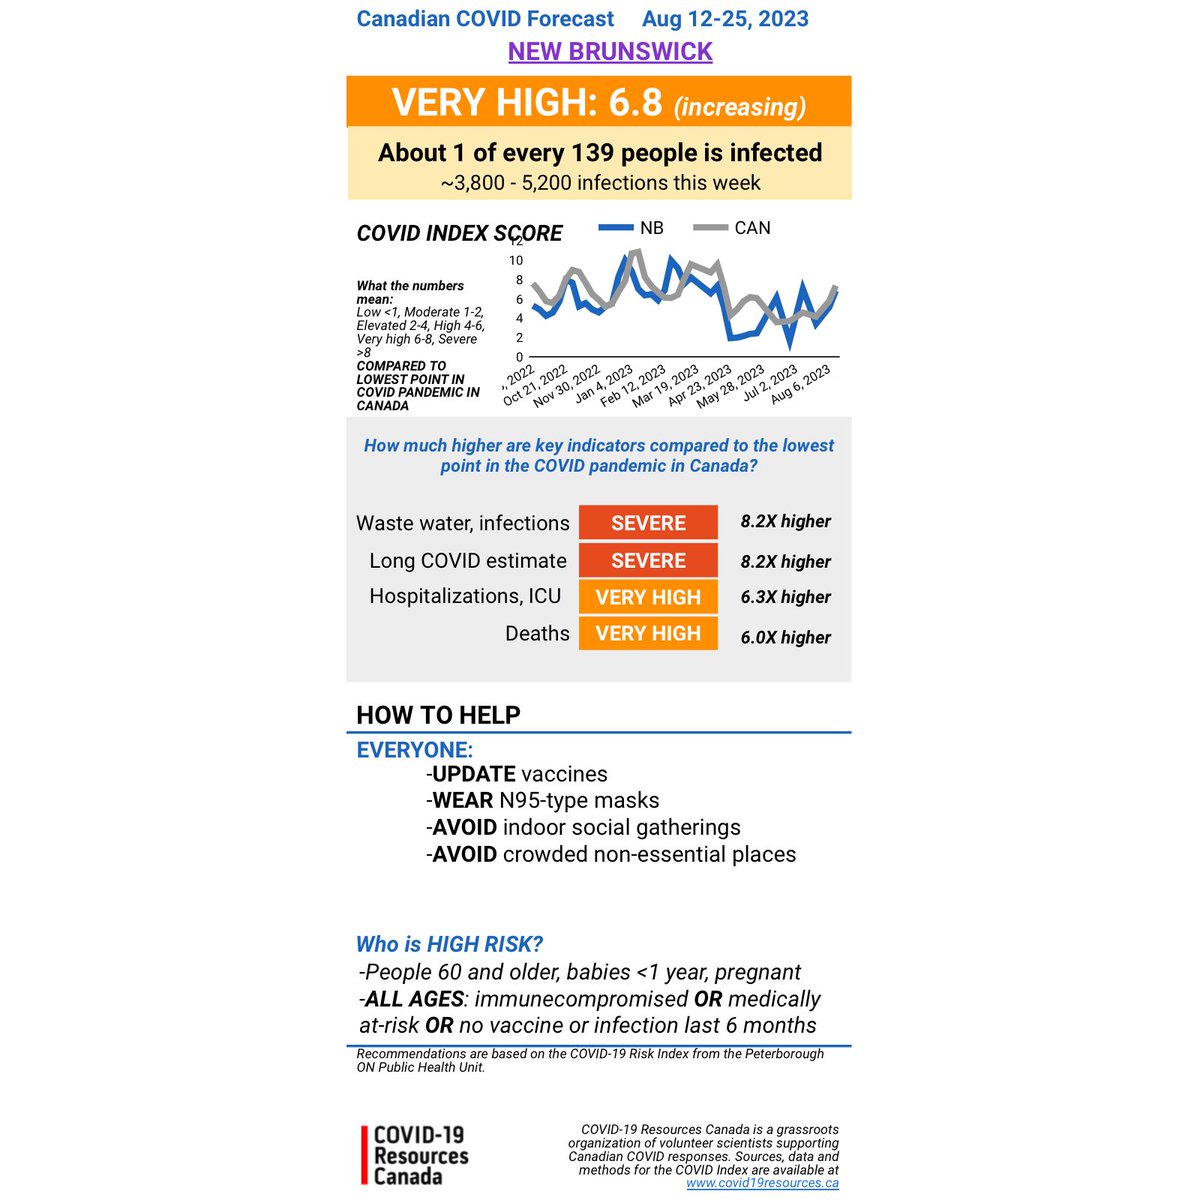
@BIRcovidhealth @GovCanHealth Canadian COVID Forecast Aug 12-25, 2023
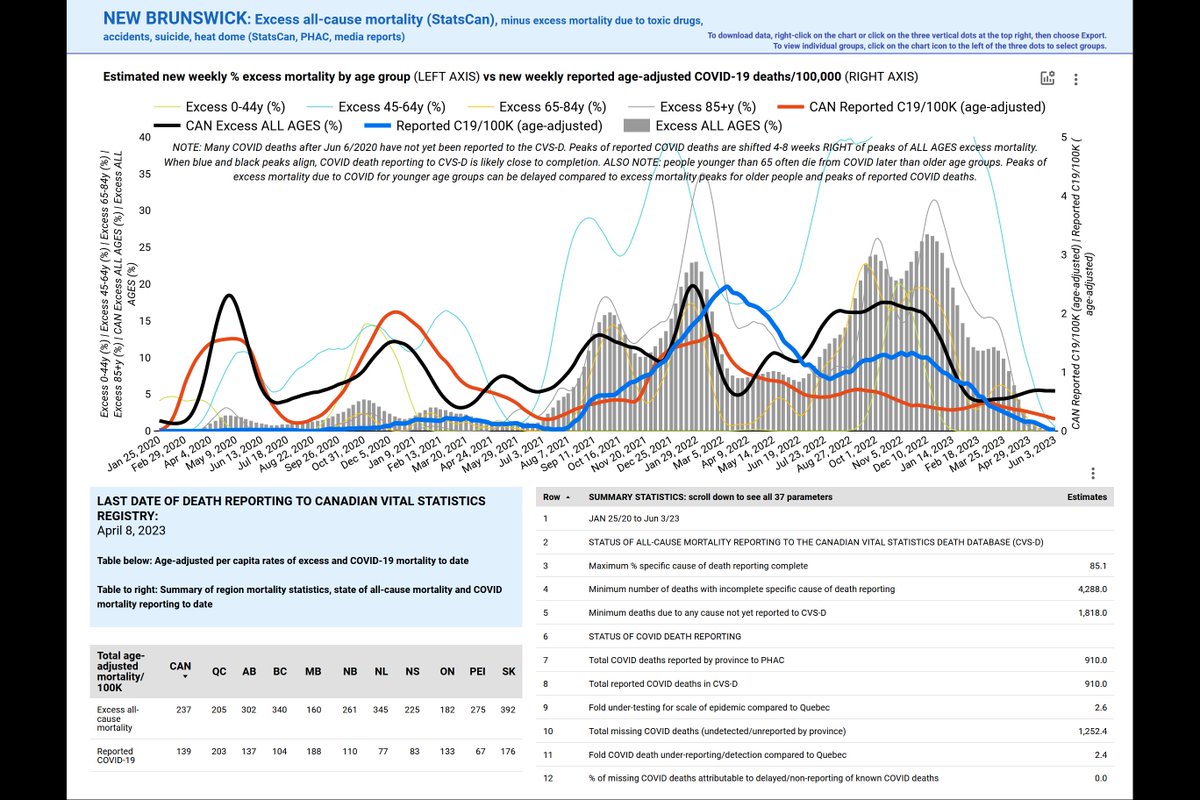
NEW BRUNSWICK
VERY HIGH (increasing)
About 1 in every 139 people infected
Compared to lowest point of pandemic in Canada:
-Infections, long COVID ~8X higher
-Hospitalizations ~6X higher
-Deaths ~6X higher
/27
NEW BRUNSWICK
VERY HIGH (increasing)
About 1 in every 139 people infected
Compared to lowest point of pandemic in Canada:
-Infections, long COVID ~8X higher
-Hospitalizations ~6X higher
-Deaths ~6X higher
/27
@BIRcovidhealth @GovCanHealth Weekly excess all-cause mortality Jan 25/20 to Jun 3/23
NEW BRUNSWICK
Remember: all-cause mortality reporting is slow in many provinces.
See tweets 15-17 to get a sense of when and where additional excess deaths are likely to be reported over the next 2-3 yrs.
/28
NEW BRUNSWICK
Remember: all-cause mortality reporting is slow in many provinces.
See tweets 15-17 to get a sense of when and where additional excess deaths are likely to be reported over the next 2-3 yrs.
/28
@BIRcovidhealth @GovCanHealth Canadian COVID Forecast Aug 12-25, 2023
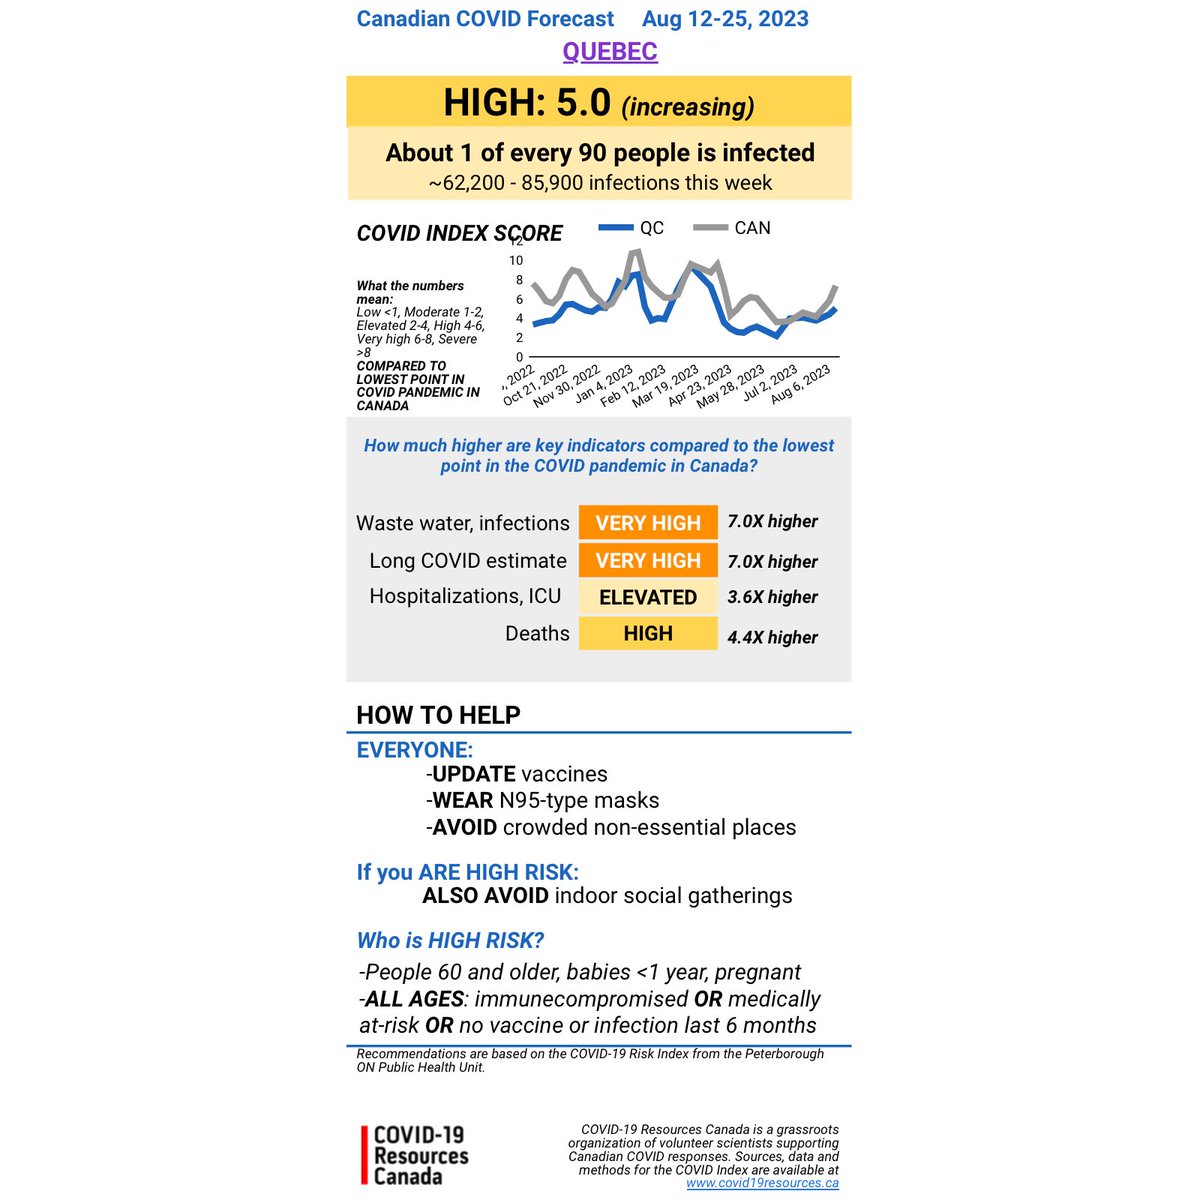
QUÉBEC
HIGH (increasing)
About 1 in every 90 people infected
Compared to lowest point of pandemic in Canada:
-Infections, long COVID ~7X higher
-Hospitalizations ~4X higher
-Deaths ~4X higher
/29
QUÉBEC
HIGH (increasing)
About 1 in every 90 people infected
Compared to lowest point of pandemic in Canada:
-Infections, long COVID ~7X higher
-Hospitalizations ~4X higher
-Deaths ~4X higher
/29
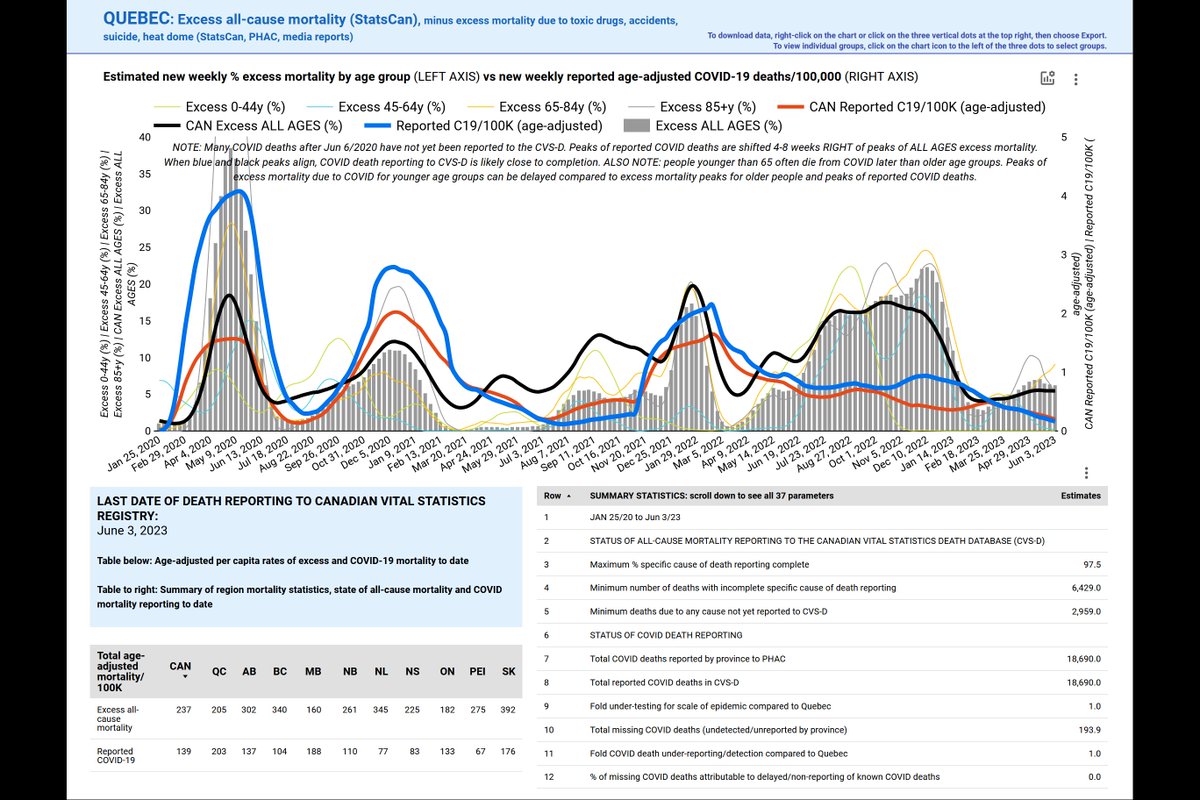
@BIRcovidhealth @GovCanHealth Weekly excess all-cause mortality Jan 25/20 to Jun 3/23
QUÉBEC
Remember: all-cause mortality reporting is delayed in many provinces.
See tweets 15-17 to get a sense of when and where additional excess deaths are likely to be reported over the coming 2-3 years.
/30
QUÉBEC
Remember: all-cause mortality reporting is delayed in many provinces.
See tweets 15-17 to get a sense of when and where additional excess deaths are likely to be reported over the coming 2-3 years.
/30
@BIRcovidhealth @GovCanHealth Canadian COVID Forecast Aug 12-25, 2023
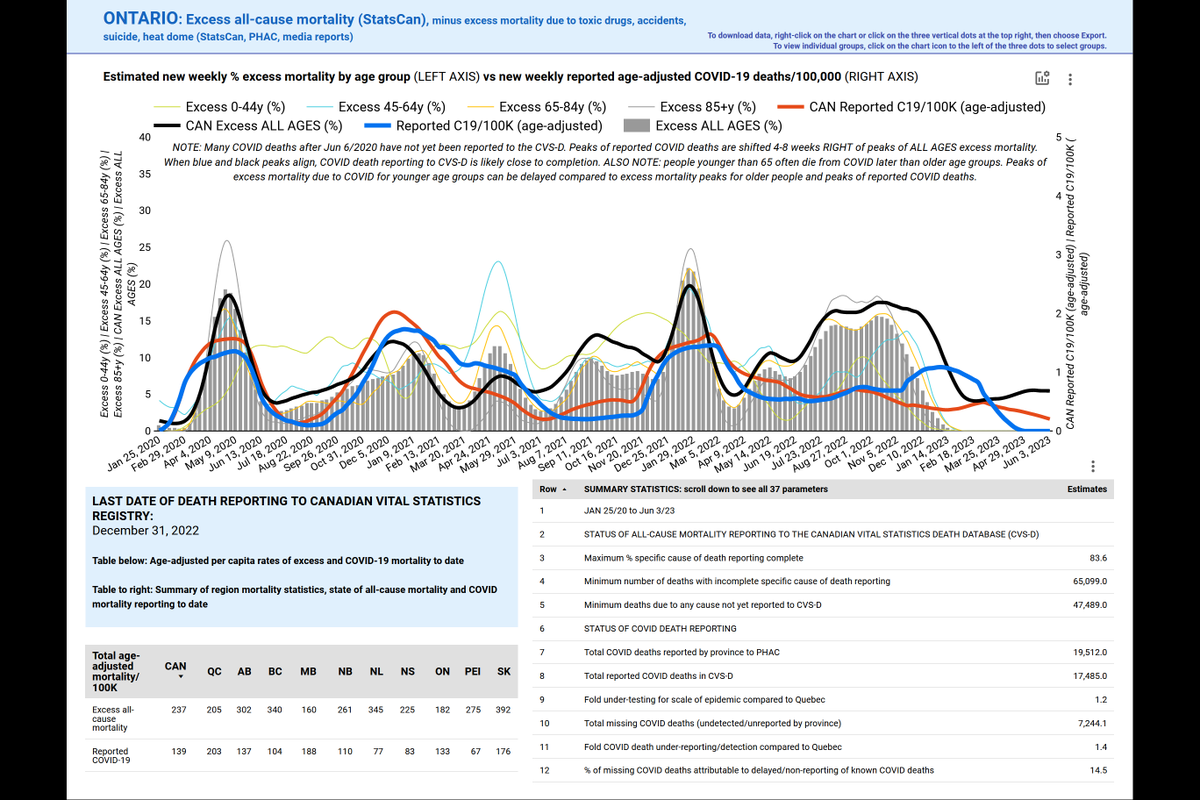
ONTARIO
VERY HIGH (increasing)
About 1 in every 63 people infected
Compared to lowest point of pandemic in Canada:
-Infections, long COVID ~11X higher
-Hospitalizations ~6X higher
-Deaths ~3X higher
/31
ONTARIO
VERY HIGH (increasing)
About 1 in every 63 people infected
Compared to lowest point of pandemic in Canada:
-Infections, long COVID ~11X higher
-Hospitalizations ~6X higher
-Deaths ~3X higher
/31

@BIRcovidhealth @GovCanHealth Weekly excess all-cause mortality Jan 25/20 to Jun 3/23
ONTARIO
Remember: all-cause mortality reporting is delayed in many provinces.
See tweets 15-17 to get a sense of when and where additional excess deaths are likely to be reported over the coming 2-3 years.
/32
ONTARIO
Remember: all-cause mortality reporting is delayed in many provinces.
See tweets 15-17 to get a sense of when and where additional excess deaths are likely to be reported over the coming 2-3 years.
/32
@BIRcovidhealth @GovCanHealth Canadian COVID Forecast Aug 12-25, 2023
MANITOBA
VERY HIGH (increasing)
About 1 in every 58 people infected
Compared to lowest point of pandemic in Canada:
-Infections, long COVID ~12X higher
-Hospitalizations ~5X higher
-Deaths ~3X higher
/33
MANITOBA
VERY HIGH (increasing)
About 1 in every 58 people infected
Compared to lowest point of pandemic in Canada:
-Infections, long COVID ~12X higher
-Hospitalizations ~5X higher
-Deaths ~3X higher
/33

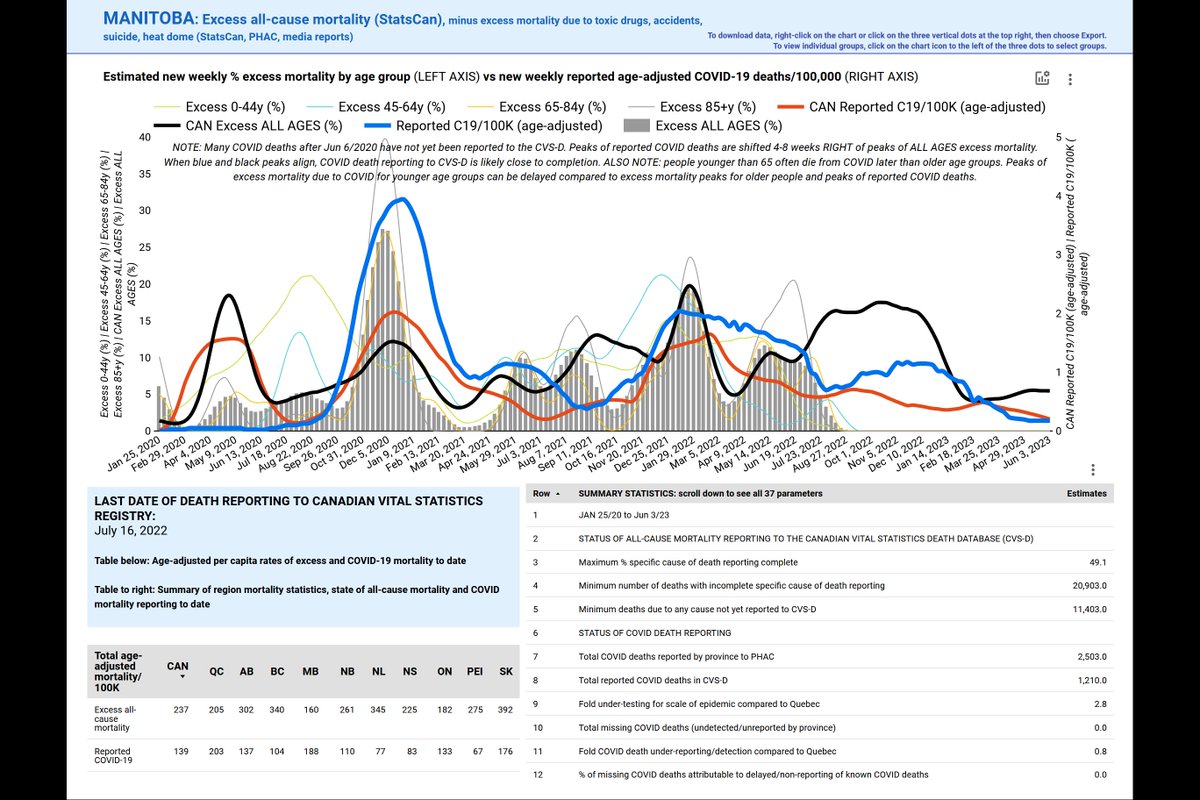
@BIRcovidhealth @GovCanHealth Weekly excess all-cause mortality Jan 25/20 to Jun 3/23
MANITOBA
Remember: all-cause mortality reporting is delayed in many provinces.
See tweets 15-17 to get a sense of when and where additional excess deaths are likely to be reported over the coming 2-3 years.
/34
MANITOBA
Remember: all-cause mortality reporting is delayed in many provinces.
See tweets 15-17 to get a sense of when and where additional excess deaths are likely to be reported over the coming 2-3 years.
/34
@BIRcovidhealth @GovCanHealth Canadian COVID Forecast Aug 12-25, 2023
SASKATCHEWAN
VERY HIGH (increasing)
About 1 in every 61 people infected
Compared to lowest point of pandemic in Canada:
-Infections, long COVID ~12X higher
-Hospitalizations ~7X higher
-Deaths ~4X higher
/35
SASKATCHEWAN
VERY HIGH (increasing)
About 1 in every 61 people infected
Compared to lowest point of pandemic in Canada:
-Infections, long COVID ~12X higher
-Hospitalizations ~7X higher
-Deaths ~4X higher
/35

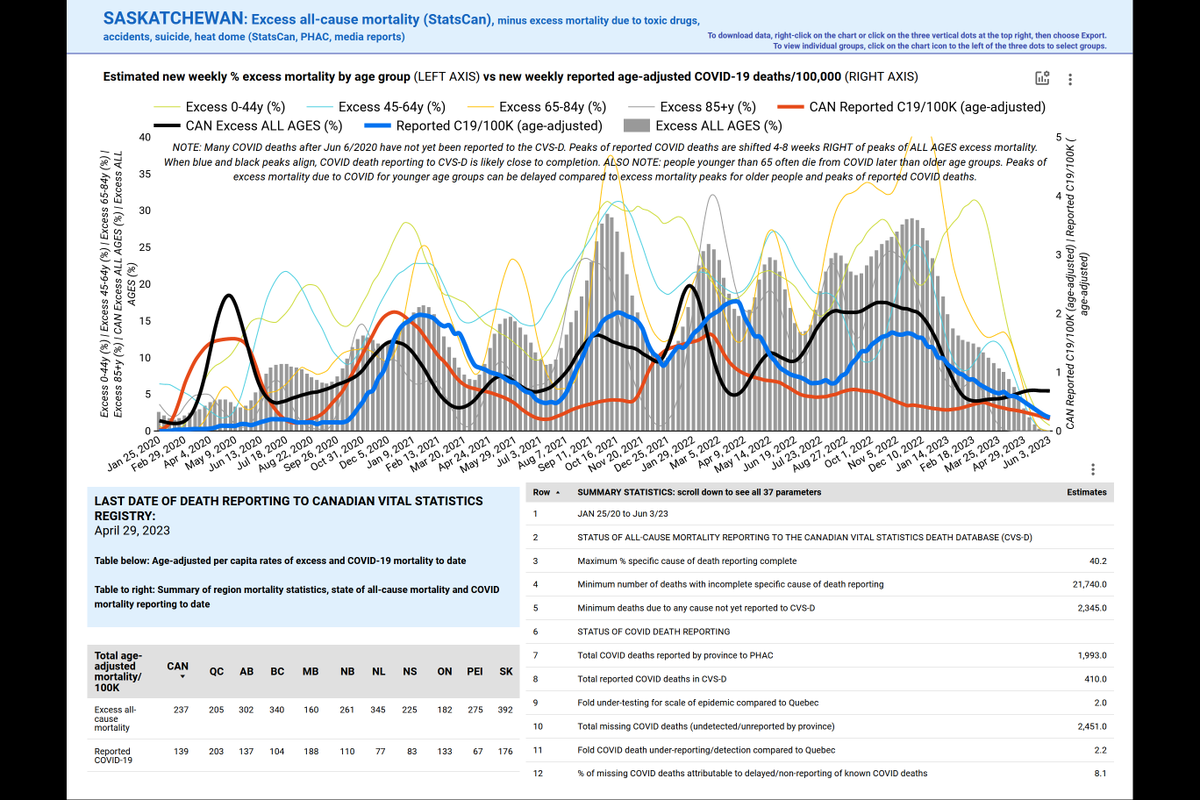
@BIRcovidhealth @GovCanHealth Weekly excess all-cause mortality Jan 25/20 to Jun 3/23
SASKATCHEWAN
Remember: all-cause mortality reporting is delayed in many provinces.
See tweets 15-17 to get a sense of when and where additional excess deaths are likely to be reported over the coming 2-3 years.
/36
SASKATCHEWAN
Remember: all-cause mortality reporting is delayed in many provinces.
See tweets 15-17 to get a sense of when and where additional excess deaths are likely to be reported over the coming 2-3 years.
/36
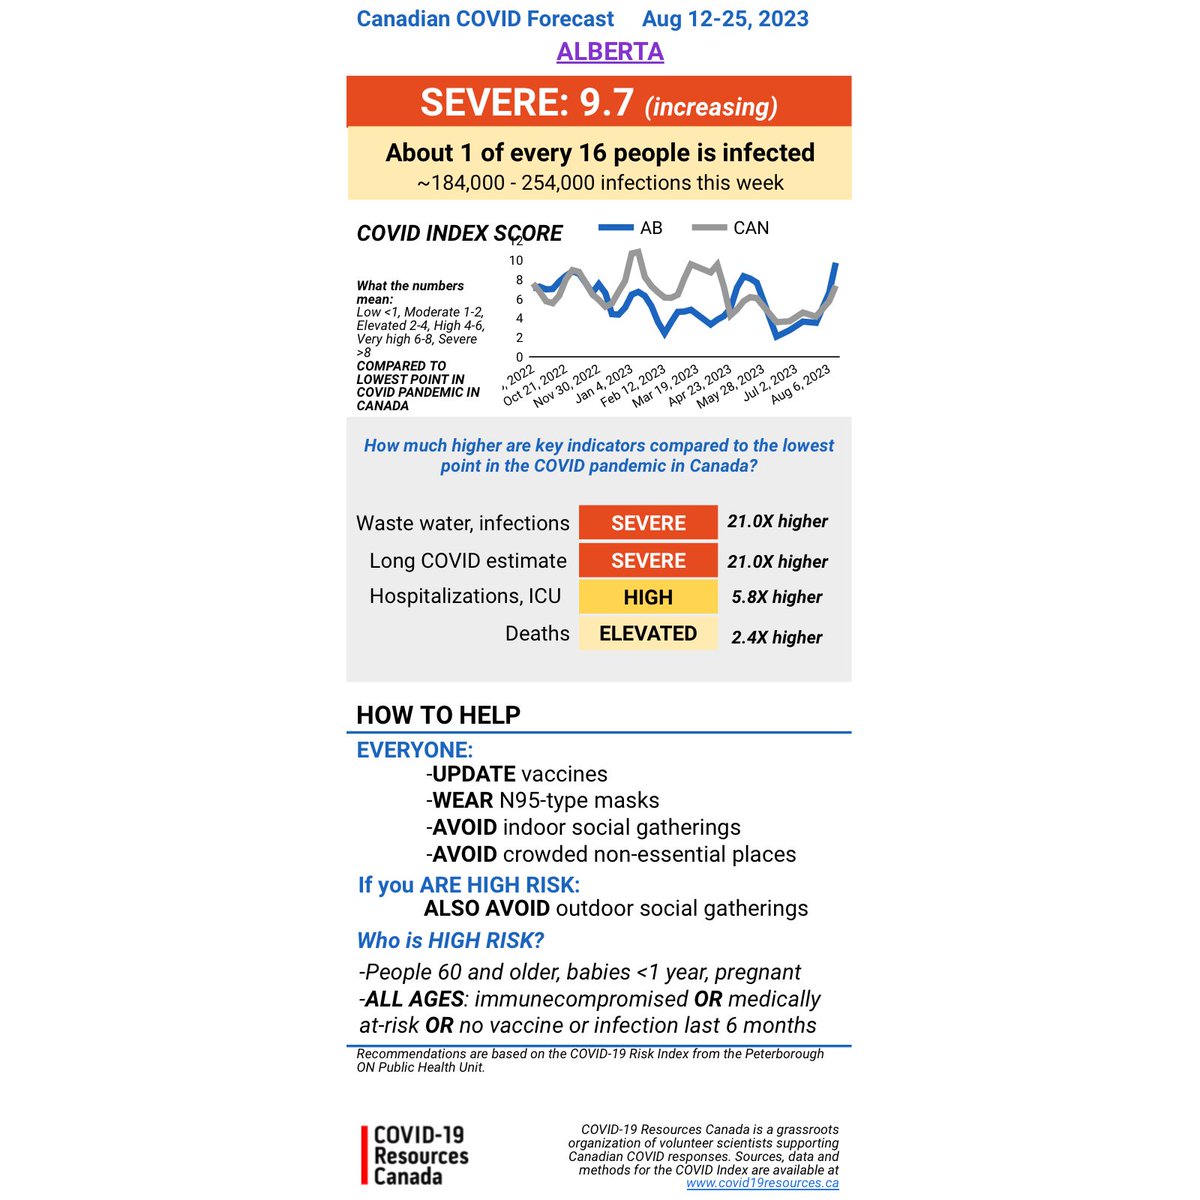
@BIRcovidhealth @GovCanHealth Canadian COVID Forecast Aug 12-25, 2023
ALBERTA
SEVERE (increasing)
About 1 in every 16 people infected
Compared to lowest point of pandemic in Canada:
-Infections, long COVID ~21X higher
-Hospitalizations ~6X higher
-Deaths ~2X higher
/37
ALBERTA
SEVERE (increasing)
About 1 in every 16 people infected
Compared to lowest point of pandemic in Canada:
-Infections, long COVID ~21X higher
-Hospitalizations ~6X higher
-Deaths ~2X higher
/37
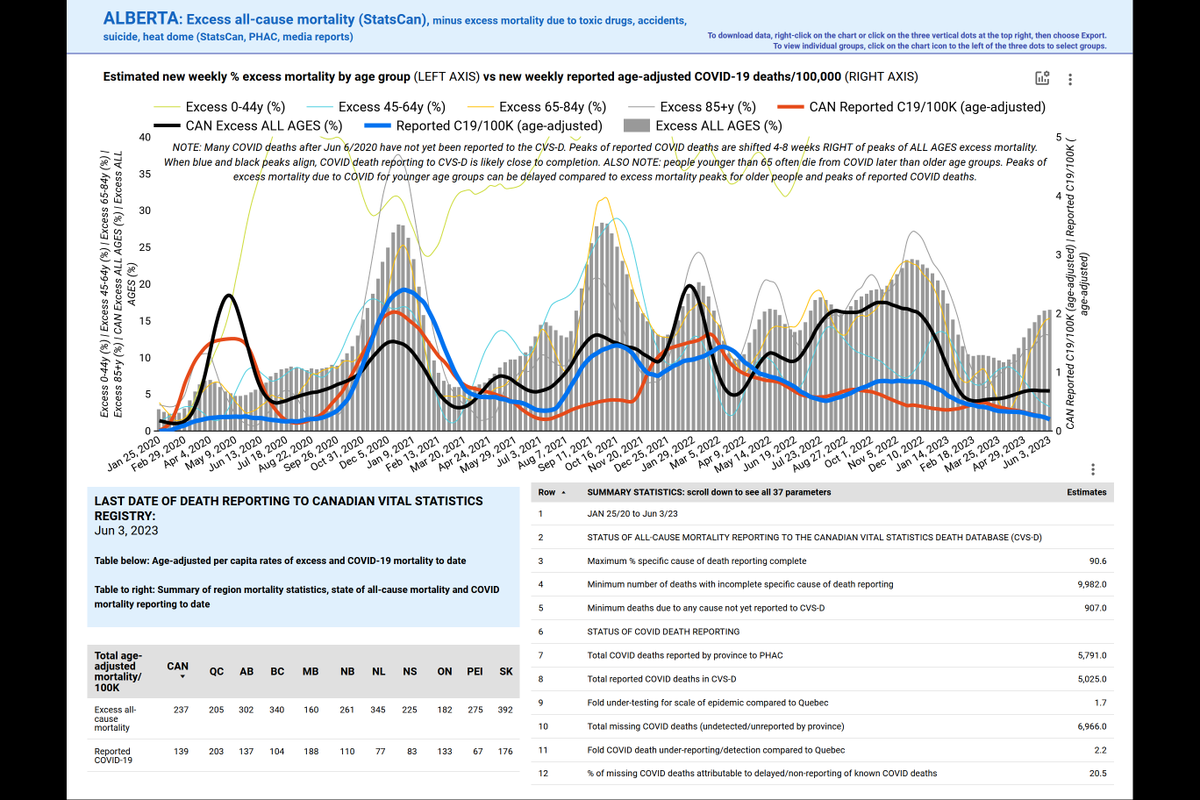
@BIRcovidhealth @GovCanHealth Weekly excess all-cause mortality Jan 25/20 to Jun 3/23
ALBERTA
Remember: all-cause mortality reporting is delayed in many provinces.
See tweets 15-17 to get a sense of when and where additional excess deaths are likely to be reported over the coming 2-3 years.
/38
ALBERTA
Remember: all-cause mortality reporting is delayed in many provinces.
See tweets 15-17 to get a sense of when and where additional excess deaths are likely to be reported over the coming 2-3 years.
/38
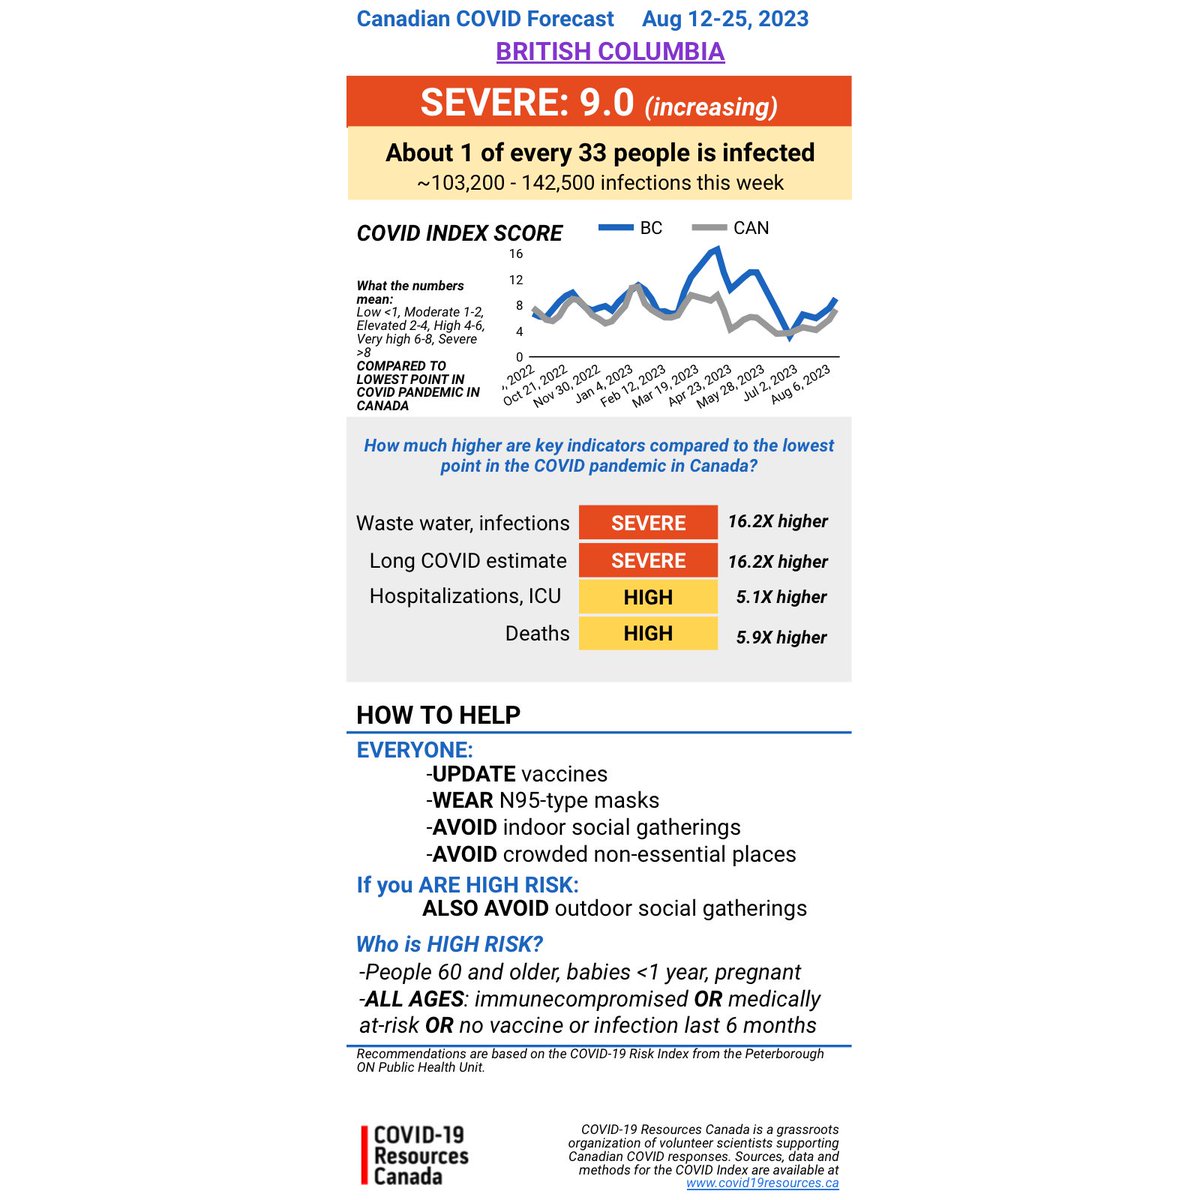
@BIRcovidhealth @GovCanHealth Canadian COVID Forecast Aug 12-25, 2023
BRITISH COLUMBIA
SEVERE (increasing)
About 1 in every 33 people infected
Compared to lowest point of pandemic in Canada:
-Infections, long COVID ~16X higher
-Hospitalizations ~5X higher
-Deaths ~6X higher
/39
BRITISH COLUMBIA
SEVERE (increasing)
About 1 in every 33 people infected
Compared to lowest point of pandemic in Canada:
-Infections, long COVID ~16X higher
-Hospitalizations ~5X higher
-Deaths ~6X higher
/39
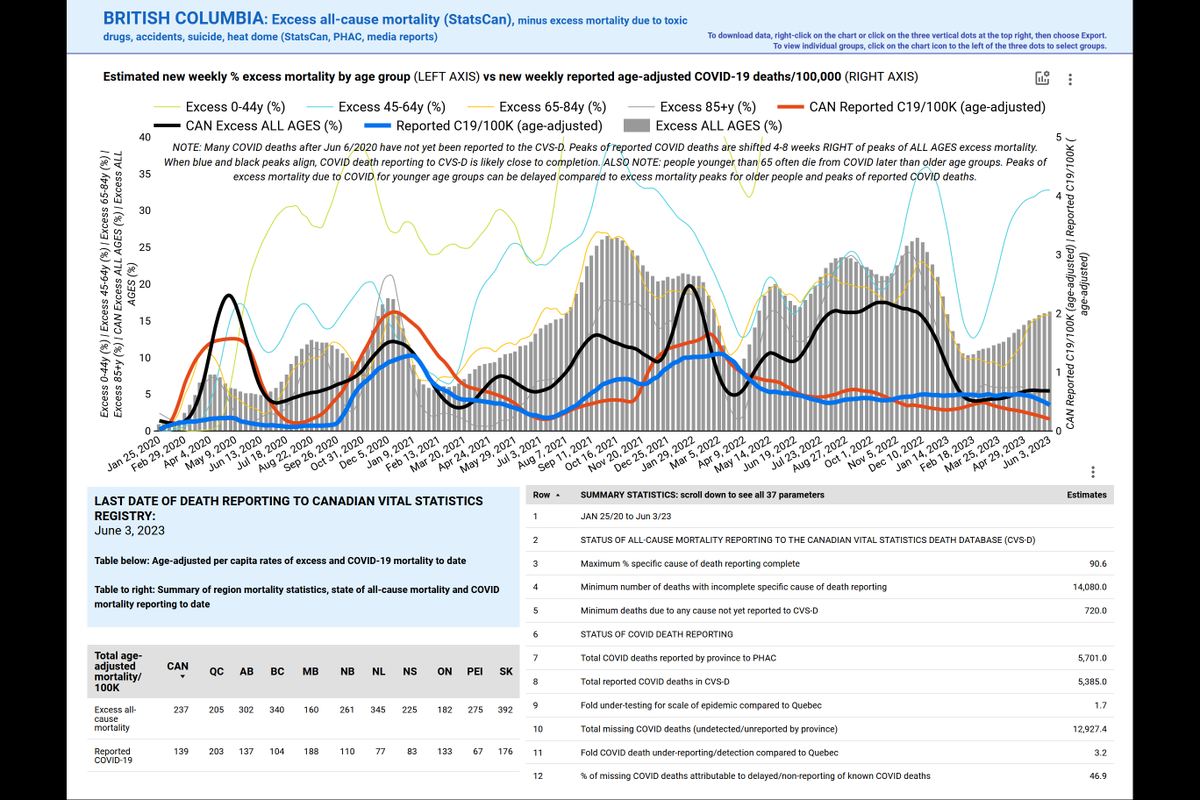
@BIRcovidhealth @GovCanHealth Weekly excess all-cause mortality Jan 25/20 to Jun 3/23
BRITISH COLUMBIA
Remember: all-cause mortality reporting is delayed in many provinces.
See tweets 15-17 to get a sense of when and where additional excess deaths are likely to be reported over the coming 2-3 years.
/40
BRITISH COLUMBIA
Remember: all-cause mortality reporting is delayed in many provinces.
See tweets 15-17 to get a sense of when and where additional excess deaths are likely to be reported over the coming 2-3 years.
/40
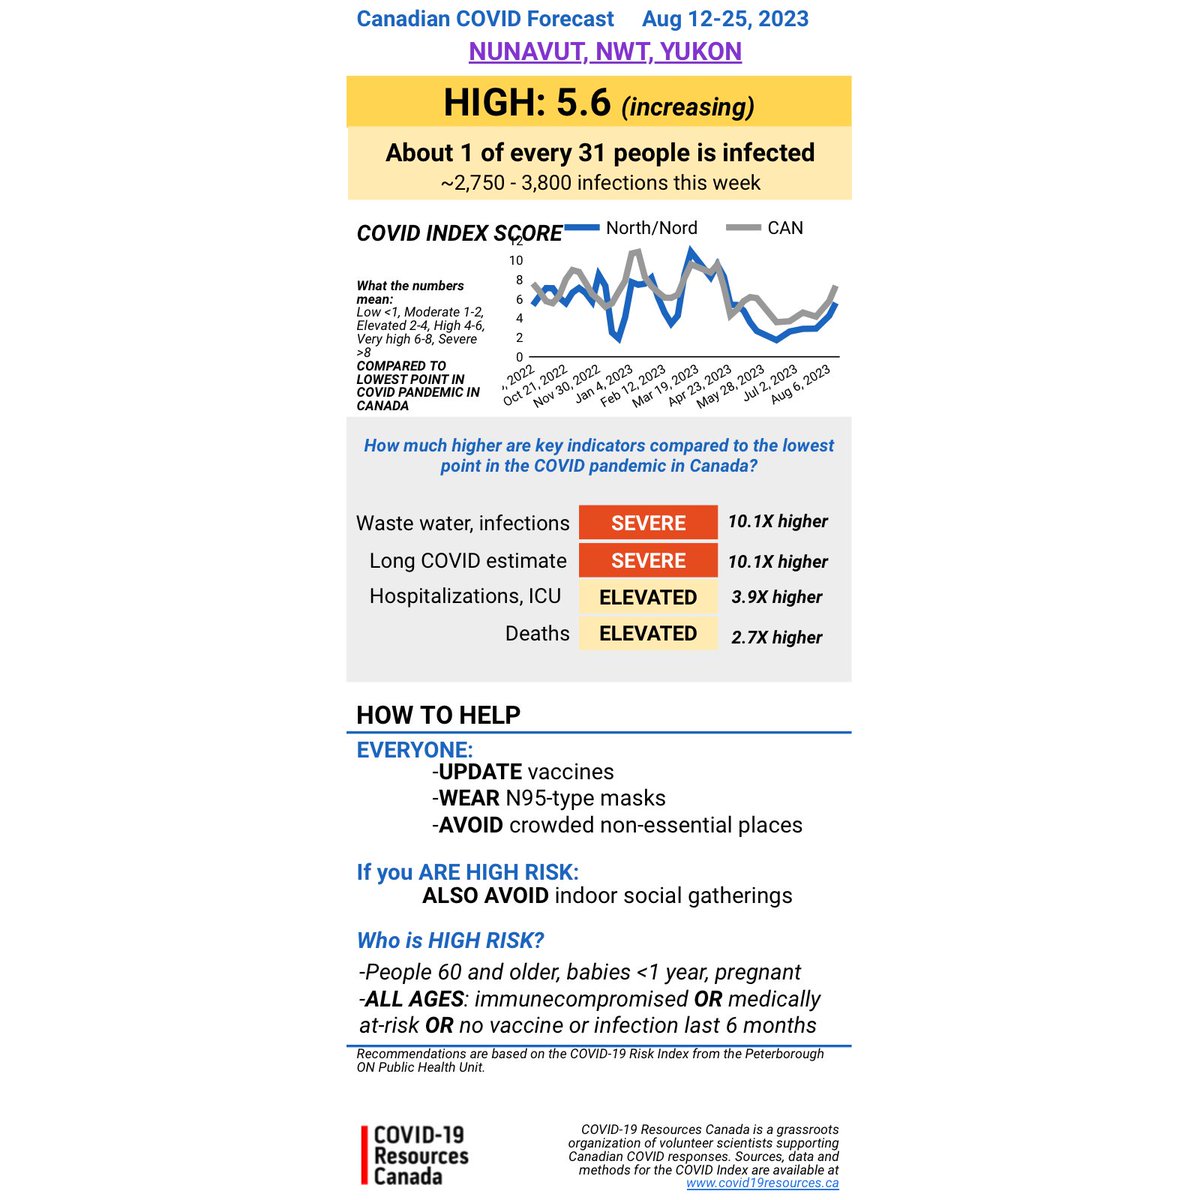
@BIRcovidhealth @GovCanHealth Canadian COVID Forecast Aug 12-25, 2023
NUNAVUT, NWT, YUKON
HIGH (increasing)
About 1 in every 31 people infected
Compared to lowest point of pandemic in Canada:
-Infections, long COVID ~10X higher
-Hospitalizations ~4X higher
-Deaths ~3X higher
/41
NUNAVUT, NWT, YUKON
HIGH (increasing)
About 1 in every 31 people infected
Compared to lowest point of pandemic in Canada:
-Infections, long COVID ~10X higher
-Hospitalizations ~4X higher
-Deaths ~3X higher
/41
@BIRcovidhealth @GovCanHealth Remember, the forecast reflects not only recent input data, but also numbers expected for the next 2 weeks, based on 5-week average trends.
The next forecast will be August 26, 2023. You should assume infections in your region are increasing when making decisions.
/42
The next forecast will be August 26, 2023. You should assume infections in your region are increasing when making decisions.
/42
@BIRcovidhealth @GovCanHealth In this surge, infections seem to be increasing fastest first in western provinces. Central and Eastern provinces should expect that infection numbers as high as estimates for Western provinces may start happening in the coming weeks.
/43
/43
@BIRcovidhealth @GovCanHealth I’m not very sure about where things will go in the coming weeks. We could see a surge that increases quickly but tops out quickly too, as we’ve seen for much of the last 6 months.
/44
/44
@BIRcovidhealth @GovCanHealth We could also be starting the annual upward climb in excess mortality that starts in July and peaks around December.
I don’t “think” we’ll see the excess mortality of 2022, but it will almost certainly remain higher than excess mortality in 2020 and 2021.
/45
I don’t “think” we’ll see the excess mortality of 2022, but it will almost certainly remain higher than excess mortality in 2020 and 2021.
/45
@BIRcovidhealth @GovCanHealth I would still hold out for a fall XBB-based vaccine, but be very careful about avoiding exposure until these are available, ESPECIALLY if you have not yet been infected.
/46
/46
@BIRcovidhealth @GovCanHealth Take care of yourselves and others. Look for the helpers and be a helper.
And if you’re in an essential place, especially a healthcare setting, please, please wear a mask to protect those at higher risk. You can act before healthcare settings finally do.
/47/fin
And if you’re in an essential place, especially a healthcare setting, please, please wear a mask to protect those at higher risk. You can act before healthcare settings finally do.
/47/fin
@kraftmcdinner @BIRcovidhealth @GovCanHealth BC may also have a policy about excluding hospital outbreak cases from hospital numbers. They excluded deaths associated with reinfection until 3 months ago.
• • •
Missing some Tweet in this thread? You can try to
force a refresh