1/6
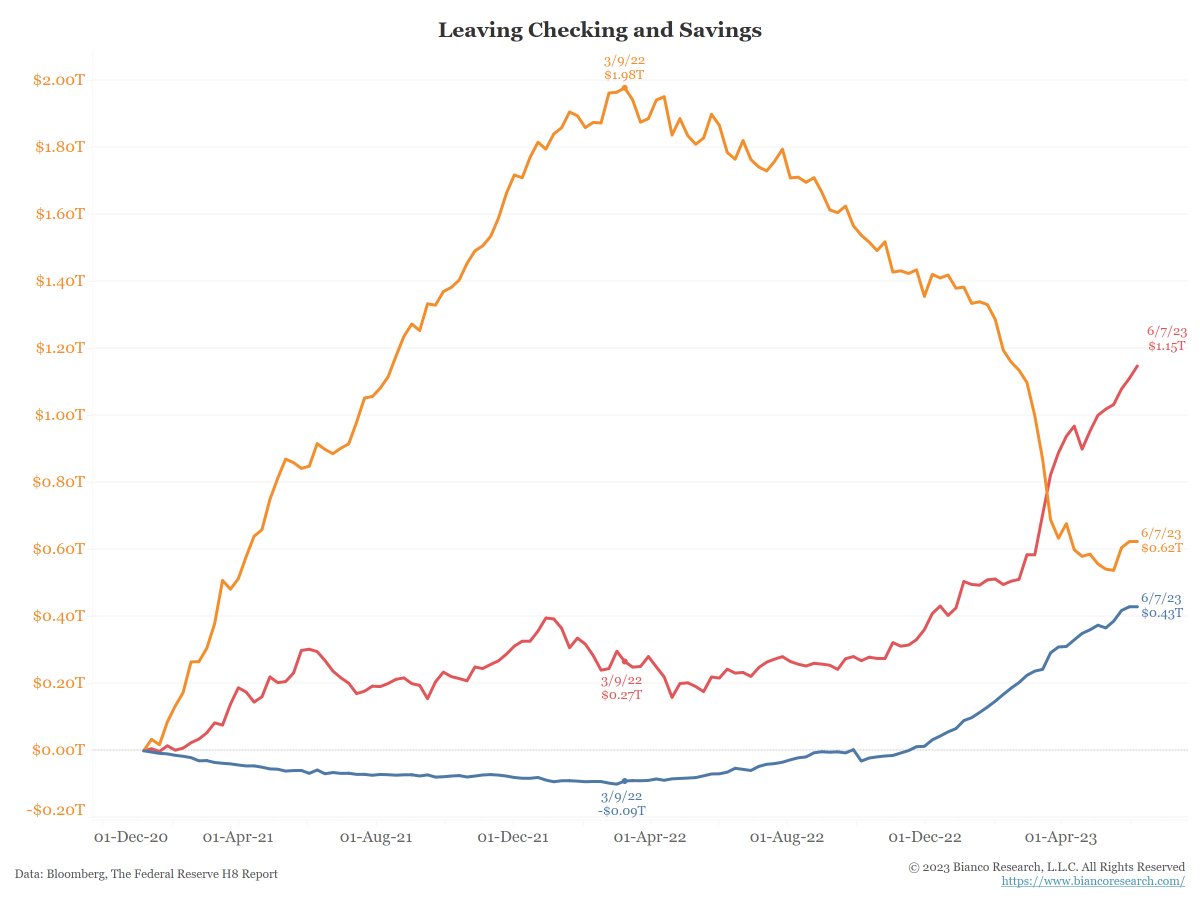
Whatever happened to the bank walk? Or money slowly leaving low-yielding bank deposit accounts for higher-yielding T-Bills and money market accounts?
As the blue line below shows, it never stopped (new low). Money continues to pour into money market funds (orange).
Whatever happened to the bank walk? Or money slowly leaving low-yielding bank deposit accounts for higher-yielding T-Bills and money market accounts?
As the blue line below shows, it never stopped (new low). Money continues to pour into money market funds (orange).

2/6
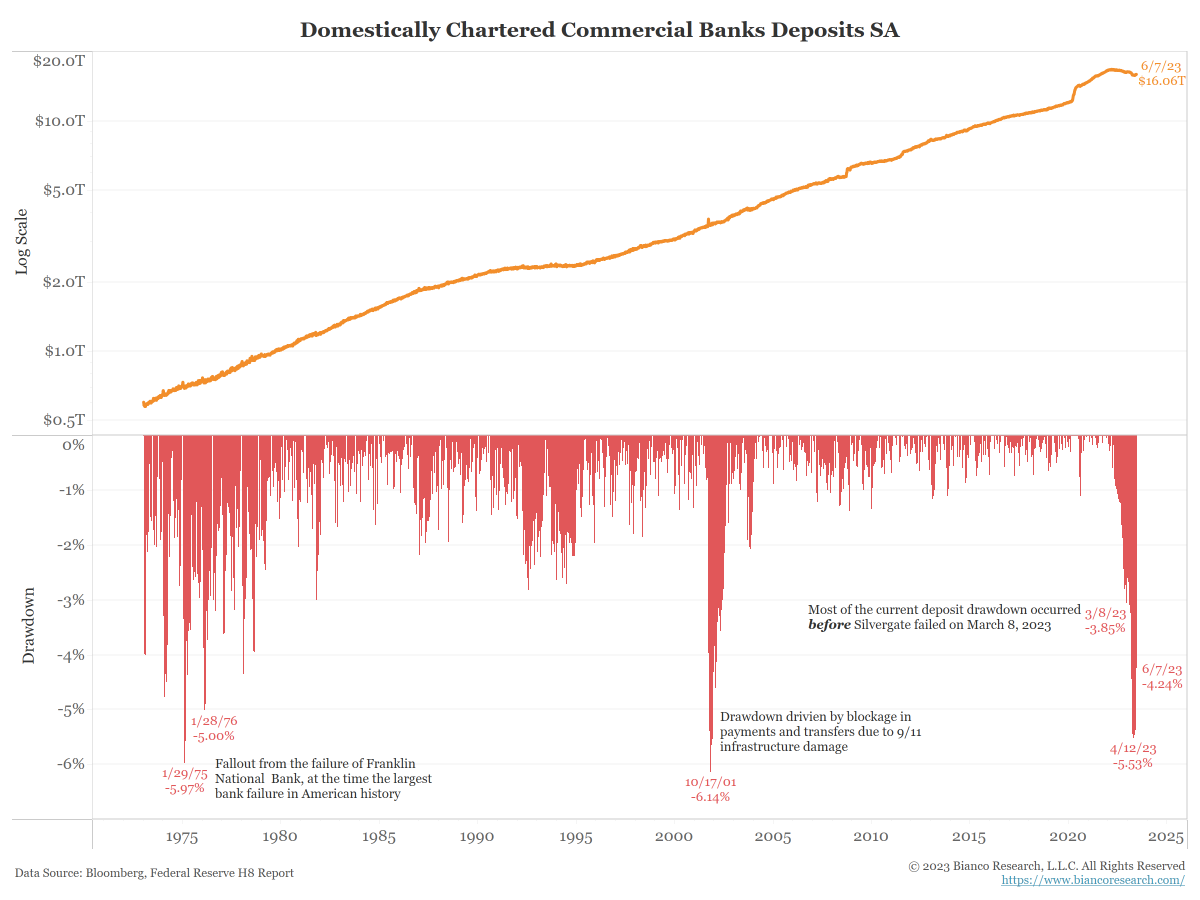
And this continuing bank walking is like nothing we have ever seen before.
(Why? New technology. 120 million use mobile banking apps every month. Two minutes on your phone and you can move into a money market fund and pick up thousands in interest income.)
And this continuing bank walking is like nothing we have ever seen before.
(Why? New technology. 120 million use mobile banking apps every month. Two minutes on your phone and you can move into a money market fund and pick up thousands in interest income.)

3/6
And the bank walk should continue as the spread between deposit rates (orange) and money market rates (blue) is still the widest ever (red).
And the bank walk should continue as the spread between deposit rates (orange) and money market rates (blue) is still the widest ever (red).

4/6
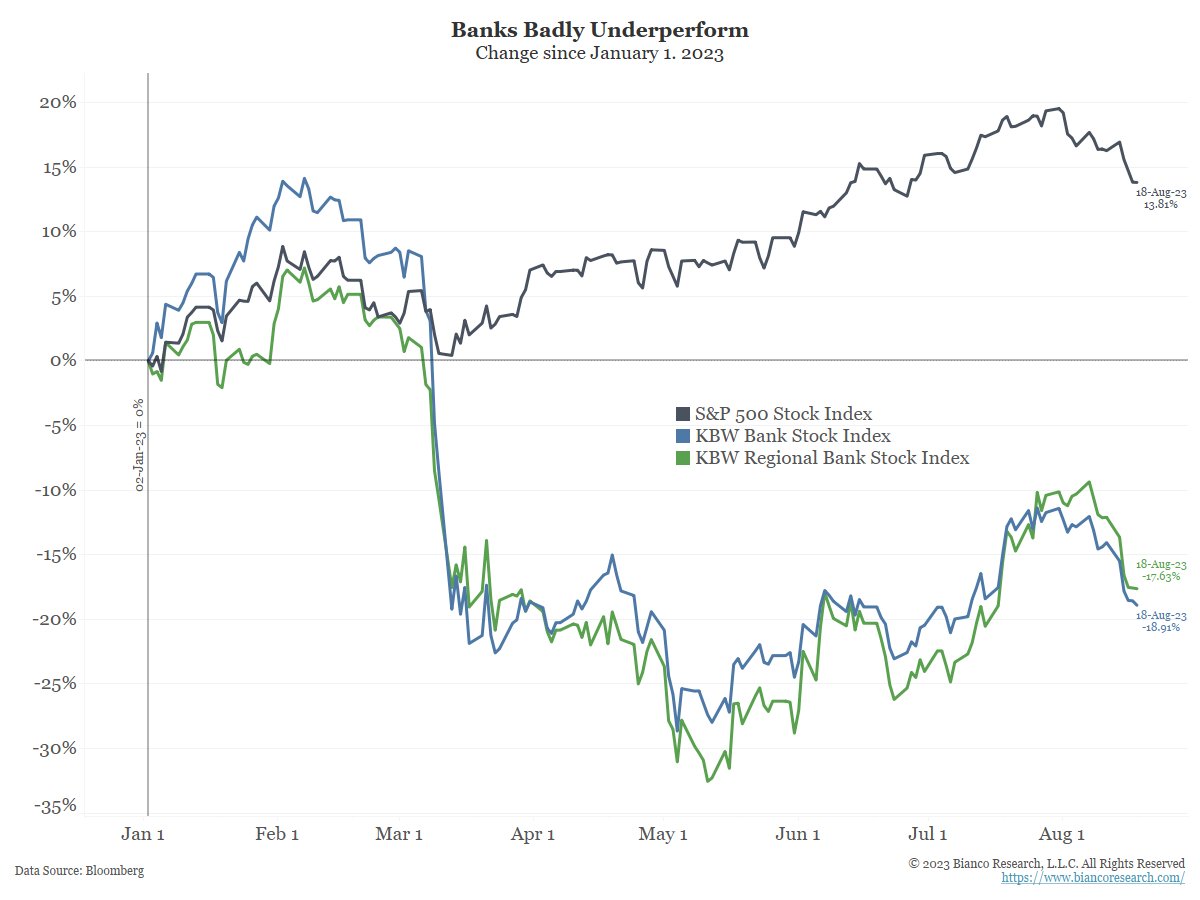
Why don't the banks raise deposit rates to stop the bank walk? Because it is cheap funding. Raising deposit rates kills profitability.
This year, the bank stock's terrible performance is more about squeezing profitability and the bank walk and less about more failures.
Why don't the banks raise deposit rates to stop the bank walk? Because it is cheap funding. Raising deposit rates kills profitability.
This year, the bank stock's terrible performance is more about squeezing profitability and the bank walk and less about more failures.
5/6
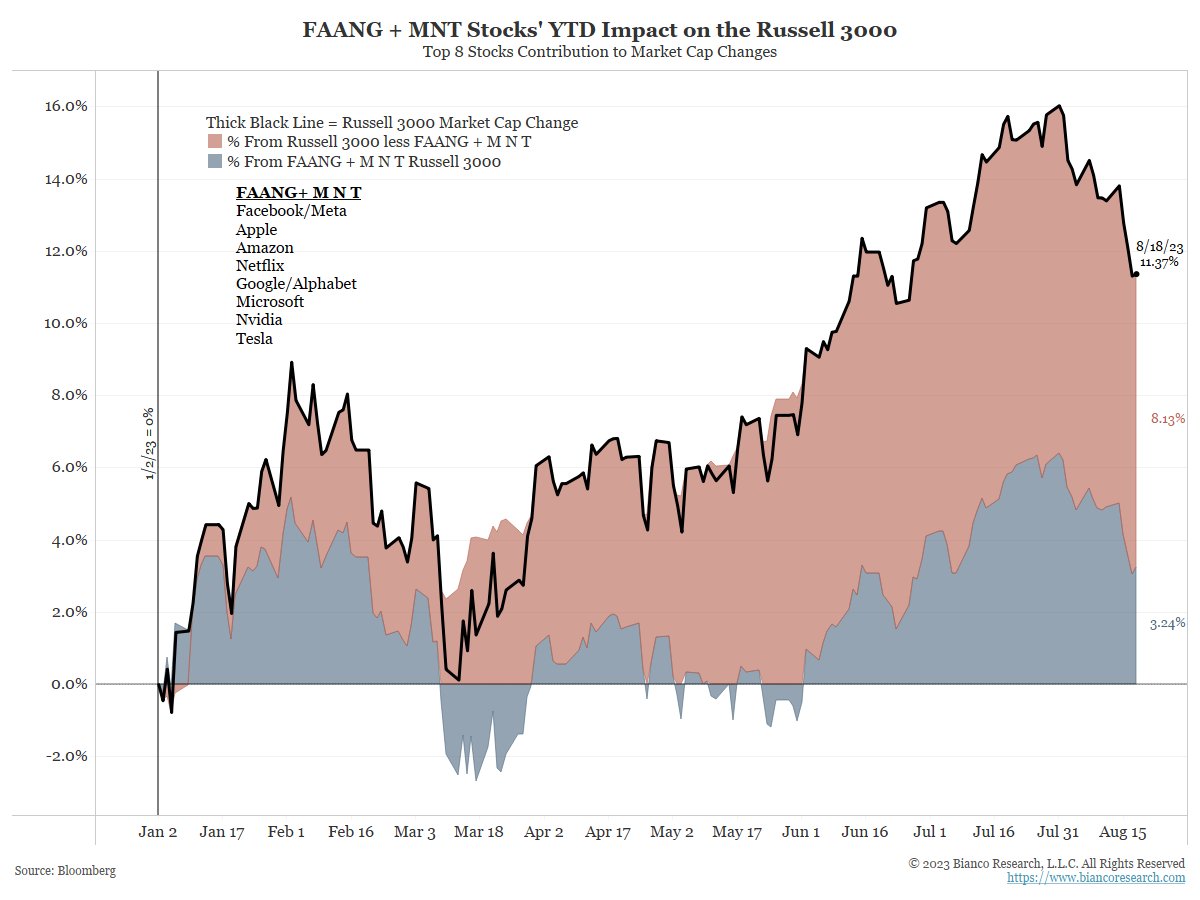
So where is this showing up? In every stock except the "FAANG+ MNT."
These other 2,993 stocks are collectively only up 3.24% this year. These companies need banks, whereas the FAANG+ MNT" do not.
(The Russell 3000 mkt cap is $45T. $11T in FAANG+ MNT and $34T in the rest.)
So where is this showing up? In every stock except the "FAANG+ MNT."
These other 2,993 stocks are collectively only up 3.24% this year. These companies need banks, whereas the FAANG+ MNT" do not.
(The Russell 3000 mkt cap is $45T. $11T in FAANG+ MNT and $34T in the rest.)
6/6
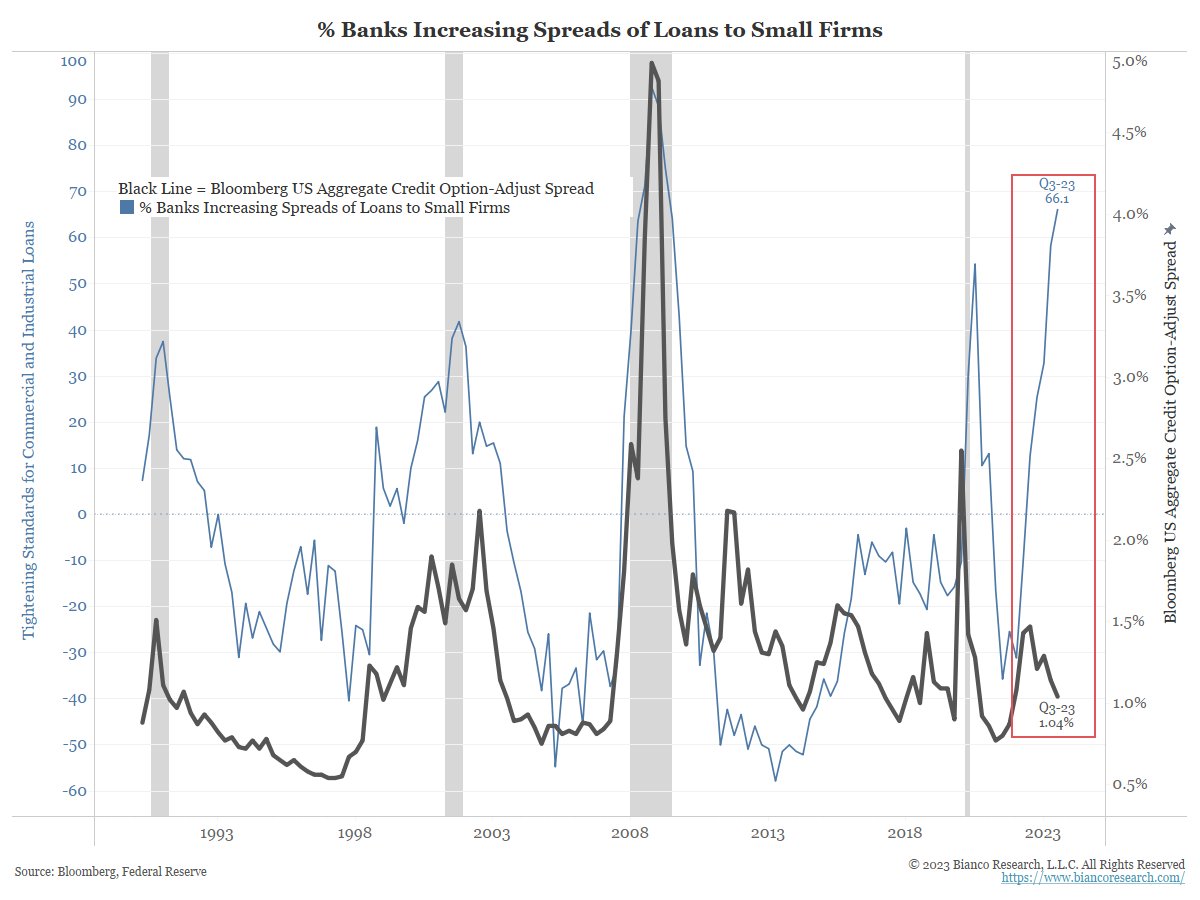
And what are banks doing because of the Bank Walk? They are squeezing everyone with tighter lending standards and much wider spreads (blue).
The corporate bond market does not have the problem of a bank walk, so its spreads remain tight (black).
Record difference.
And what are banks doing because of the Bank Walk? They are squeezing everyone with tighter lending standards and much wider spreads (blue).
The corporate bond market does not have the problem of a bank walk, so its spreads remain tight (black).
Record difference.
• • •
Missing some Tweet in this thread? You can try to
force a refresh