
A 🧵 on why Seurat and Scanpy's log fold change calculations are discordant. 1/
(based on the Supplementary Notes from ). biorxiv.org/content/10.110…

(based on the Supplementary Notes from ). biorxiv.org/content/10.110…
https://twitter.com/lpachter/status/1693880427948421193
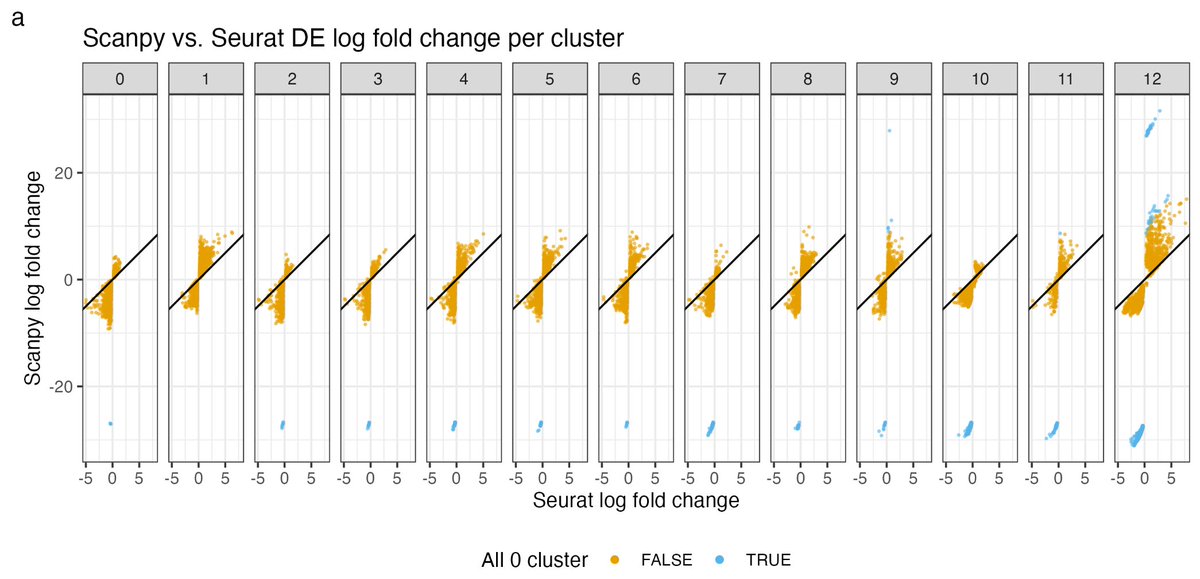
I first became aware of the discrepancy in LFC reporting by Seurat and Scanpy from a preprint by @jeffreypullin and @davisjmcc:
The result seemed surprising because it didn't seem like calculating log(x/y) = log(x)-log(y) should be complicated. 2/
The result seemed surprising because it didn't seem like calculating log(x/y) = log(x)-log(y) should be complicated. 2/
https://twitter.com/slavov_n/status/1582347828818456576
So what gives?
We have molecule counts X_{ig} where i ranges over cells & g over genes, and we consider two groups of cells G_1 and G_2 containing n_1 and n_2 cells respectively. Let's start with Seurat which calculates LFC according to the formula below. But what is Y_{ig}? 3/
We have molecule counts X_{ig} where i ranges over cells & g over genes, and we consider two groups of cells G_1 and G_2 containing n_1 and n_2 cells respectively. Let's start with Seurat which calculates LFC according to the formula below. But what is Y_{ig}? 3/

Y_{ig} is the logarithm of the depth-normalized counts X_{ig}, specifically given by the formula below (where S_i is the total number of counts in cell i, scaled by a factor of 10,000 and prior to the log a pseudocount of 1 is added). Why this formula? 4/

The formula for Y_{ig} is abbreviated as log2(CP10k+1), and its a "normalization" of the data. First, the division of X_{ig} by S_i is intended to scale counts across cells so that cell counts can be compared to each other. There's an extra factor of 10k- more on that later. 5/
The logarithm is intended to "stabilize the variance". In simple terms, the goal is to transform the counts so that genes with more counts don't have more variance across cells (a relationship that is observed in #scRNAseq). Why specifically the logarithm transform? 6/
Tl;dr: if the distribution of counts across cells is Poisson, the square root transform is optimal and if the distribution is negative binomial the logarithm is (a good approximation to the) optimal. This was worked about by Anscombe in 1948 7/ jstor.org/stable/2332343
The mean-variance relationship in #scRNAseq looks quadratic, i.e. there seems to be a negative-binomial distribution of counts for a gene across cells. Thus the log(CP10k+1) formula. Some examples generated by @vallens below: 8/

From Anscombe's work it turns out that the 10k factor AND the +1 pseudocount in the log2(CP10k+1) formula are important. They are constants that should not be set arbitrarily, but rather according to the steepness of quadratic relationship between mean and variance. 9/
In Seurat the defaults are fixed, probably arrived at by trial and error, and from the practical need to simply avoid plugging in a 0 into the log function. But I digress... we've started to go down a variance stabilizing rabbit hole... what's the relevant to the LFC? 10/
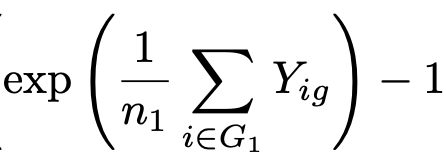
Well the exponential removes the log2, and then the -1 gets rid of the +1 that was used in the log2(CP10k+1) formula (LHS). But now, in order to avoid plugging in a 0 into the log, another +1 pseudocount was added back in (RHS). 11/


So instead of computing log(x/y) what's being computed is log((x+1)/(y+1)). If x & y are both large, the results will be similar, but not when x and/or y are small. The thing is X_{ig}/S_i can be very small and we see that low-expressed genes are disproportionately affected. 12/

So in Seurat, a lack of care in setting the pseudocount in the log2(CP10k+1) formula, and probably a lack of understanding as to its meaning (via Anscombe 1948), led to a large pseudocount erroneously being applied in the LFC calculation.
How about Scanpy? 13/
How about Scanpy? 13/
Fortunately Scanpy used a tiny pseudocount to avoid this problem. In their formula, epsilon is 10^(-9). That's why we see that for almost all genes, Scanpy LFC is higher than Seurat LFC. 14/

But what is Scanpy doing? It exponentiates the mean rather than taking the mean of the exponent. Since log(x)+log(y) = log(xy), Scanpy is effectively computing the geometric mean of the X_{ig}/S_i+1 values then taking the log. Seurat uses arithmetic mean. Which is right? 15/
Well the log of the geometric mean is the MLE for the mean of log-normal distributed data, so it would make sense to use the geometric mean if the exp(Y_{ig}) were normally distributed. Strangely, the Scanpy authors don't think this is the case! 👀 16/
In they write "”scRNA-seq data are not in fact log-normally distributed.”
17/embopress.org/doi/full/10.15…
17/embopress.org/doi/full/10.15…
There's another problem: there's a -1 after the exponentiation. That's to fix the fact that the geometric mean has been computed on the X_{ig}/S_i + 1. But the geometric mean of (x_1+1,x_2+1),...(x_n+1) - 1 is not the same as the GM of x_1,x_2,...x_n unless the x_i are equal. 18/
This mistake is less of a big deal, because the two formulas should in practice yield similar results, but it's an error and there's no reason the Y_{ig} couldn't have been exponentiated (just like in Seurat). 19/
In addition to these issues, Seurat and Scanpy are particularly discordant when one of the clusters (G_1 or G_2) has a gene with expression 0. The pseudocount differences really matter then (hence the outlier blue genes). 20/


BTW, I haven't mentioned scran, but it computes the LFC for use in the t-test and binomial test, and it uses two different formulas for the two tests (!) Details in our supplement. 21/ biorxiv.org/content/10.110…
So how should this hot mess be fixed? The solution is not just to tweak the arithmetic of the LFC in Seurat and Scanpy et al. The entire workflows of these platforms need to be revisited. For example, variance stabilization doesn't even make sense. 22/
https://twitter.com/lpachter/status/1653260053884055553?s=20
In , w/ @goringennady and @johnjvastola we outline a modeling based approach for rethinking what it means to analyze #scRNAseq. 23/biorxiv.org/content/10.110…
Right now Seurat and Scanpy are primarily geared towards arriving at a UMAP (). That's not a meaningful goal, and the piling on of heuristics to get there does the field no favors... 24/journals.plos.org/ploscompbiol/a…
... as bad as the LFC discrepancy is, the p-valule discordance between Seurat and Scanpy is even worse...
Sleep tight. 😉
25/25
Sleep tight. 😉
25/25

@NadigAjay @GorinGennady Basically to make a UMAP people first run PCA. They don't really need to do this, but they do it because it's the standard advertised default workflow. PCA exists prior to UMAP because it was needed prior to running t-SNE (and UMAP has by and large replaced t-SNE).
@NadigAjay @GorinGennady And since variance increases with expression, used on raw data PCA will effectively be driven by the most highly expressed genes, rather than all genes.
• • •
Missing some Tweet in this thread? You can try to
force a refresh


