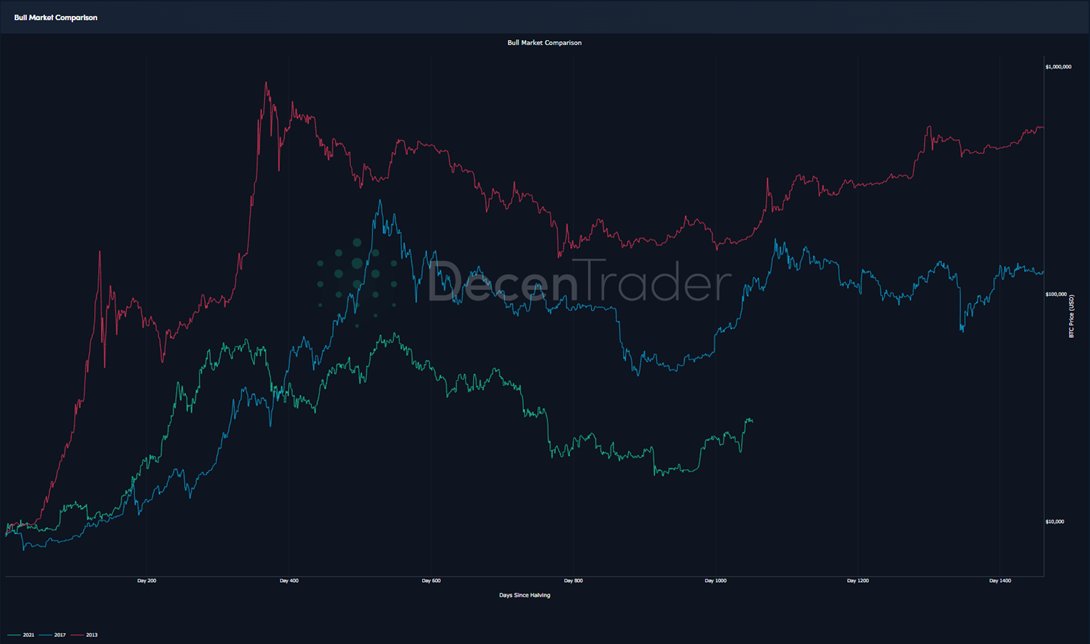
The Macro backdrop is obviously much different this cycle to that of prior cycles, but nevertheless, let's look at the Bitcoin cycle and where we are: 🧵
1/ Bitcoin is 1200 days since the previous halving.
During this period, Bitcoin has historically consolidated.
1/ Bitcoin is 1200 days since the previous halving.
During this period, Bitcoin has historically consolidated.

2/ Day 1276 is highlighted as it was around the time in both prior cycles, that we saw a move higher in advance of the halving
- Smart money buying the rumor.
At the same time, we also saw miners accumulating ahead of the halving.
- Smart money buying the rumor.
At the same time, we also saw miners accumulating ahead of the halving.

3/ Miners are incentivized to ensure that prices are well above marginal cost prior to the halving.
Whether they collude consciously, or not they are collectively incentivized to send prices higher before their marginal revenue is effectively halved.
Whether they collude consciously, or not they are collectively incentivized to send prices higher before their marginal revenue is effectively halved.
4/ So what about the *rest* of the supply?
1 Year hodl Wave chart shows that there has been a steady accumulation similar to that of previous cycles.
These holders typically start dumping after the halving. (along with the miners)
1 Year hodl Wave chart shows that there has been a steady accumulation similar to that of previous cycles.
These holders typically start dumping after the halving. (along with the miners)

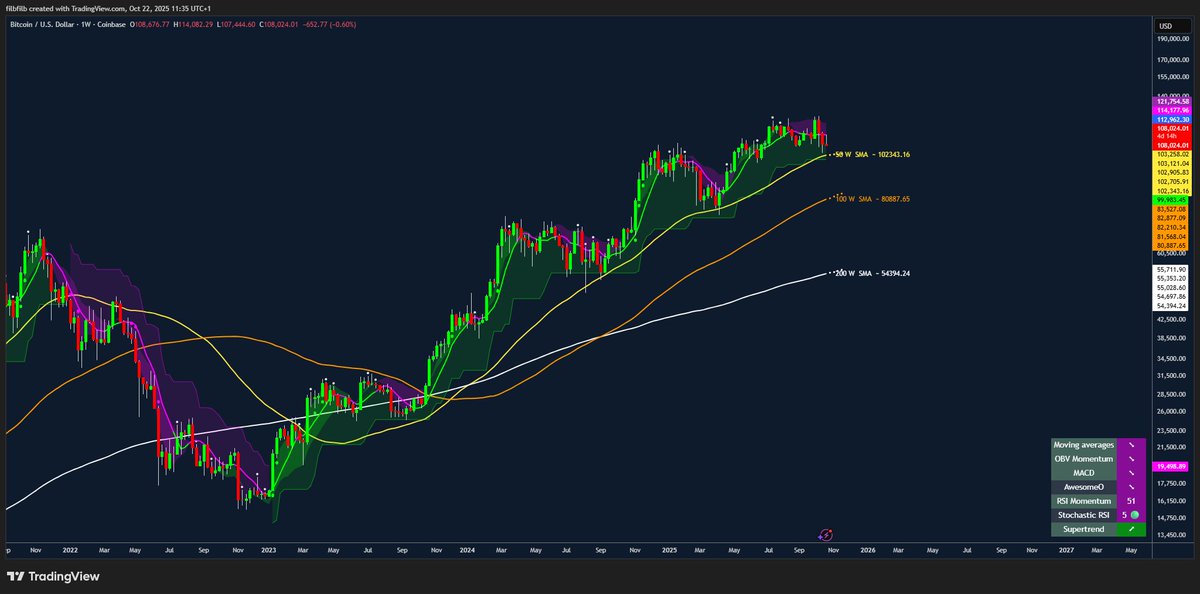
5/ From a timing perspective Q4 seems like a critical time for BTC where we are likely to see supply constricted and new money driven by speculation.
Until then, it would be unusual for Bitcoin to break up, much more likely to consolidate.
Until then, it would be unusual for Bitcoin to break up, much more likely to consolidate.
6/Clearly the elephant in the room is the Macro Environment.
If that can remain steady, then I believe the game theory will play out and Bitcoin will convincingly break $30k before the 2023 year-end.
If that can remain steady, then I believe the game theory will play out and Bitcoin will convincingly break $30k before the 2023 year-end.
7/ A few people have asked about returning to $20k.
I would suggest that if that happens and is for anything other than for a very short time period, then the pre-halving pump may only take us to the 2023 highs already seen and breaking it would come later.
I would suggest that if that happens and is for anything other than for a very short time period, then the pre-halving pump may only take us to the 2023 highs already seen and breaking it would come later.
8/ 2 Scenarios look something like this.

9/
Bitcoin Dominance is also behaving in the same way - you can see that it is decreasing now, the same as the previous cycles, as Bitcoin lost the 20 WMA.
Bitcoin Dominance is also behaving in the same way - you can see that it is decreasing now, the same as the previous cycles, as Bitcoin lost the 20 WMA.

• • •
Missing some Tweet in this thread? You can try to
force a refresh