Anchored VWAP
(explained & use cases)
a thread 🧵
(explained & use cases)
a thread 🧵

in this thread, I will cover the following:
- settings I use for anchored vwap
- where I pull it from
- trading from the anchored vwap pulls
bonus advanced example at the end using anchoring, context and execution in a real scenario.
- settings I use for anchored vwap
- where I pull it from
- trading from the anchored vwap pulls
bonus advanced example at the end using anchoring, context and execution in a real scenario.
settings
make sure source is on - open
make sure source is on - open

timeframes
any time frame
my personal favourites:
- 5m (only if I am scalping)
- 15m
- 1h
- 4h
- daily
any time frame
my personal favourites:
- 5m (only if I am scalping)
- 15m
- 1h
- 4h
- daily
where to anchor
I use this in a similar fashion to how I would pull a fixed range / volume profile tool.
- at the beginning of ranges
I use this in a similar fashion to how I would pull a fixed range / volume profile tool.
- at the beginning of ranges

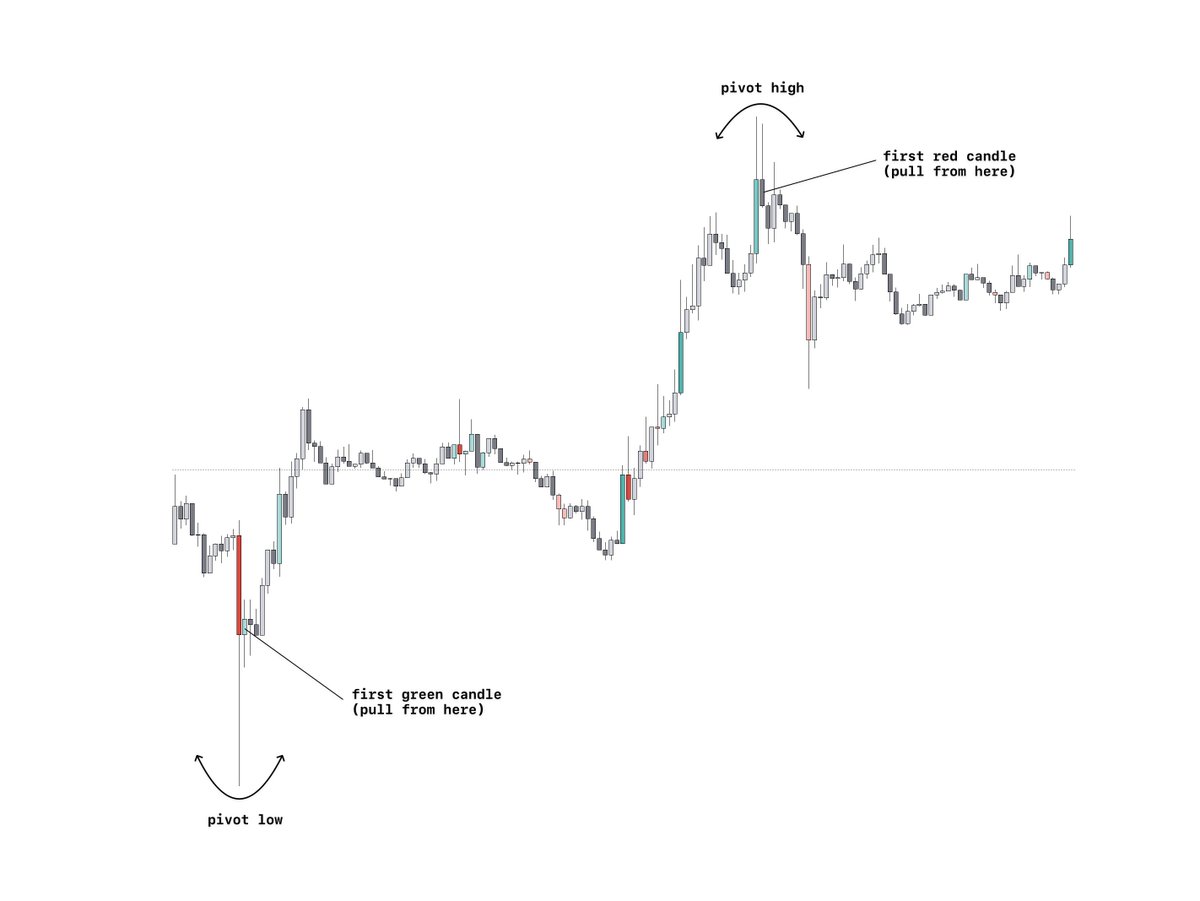
where to anchor (2)
- pivot highs/lows
similar again to how I use fixed range tool (TV)
note:
- if taking from pivot high, I use the first red candle
- if taking from pivot low, I use the first green candle
this is due to using the "open" source setting
- pivot highs/lows
similar again to how I use fixed range tool (TV)
note:
- if taking from pivot high, I use the first red candle
- if taking from pivot low, I use the first green candle
this is due to using the "open" source setting
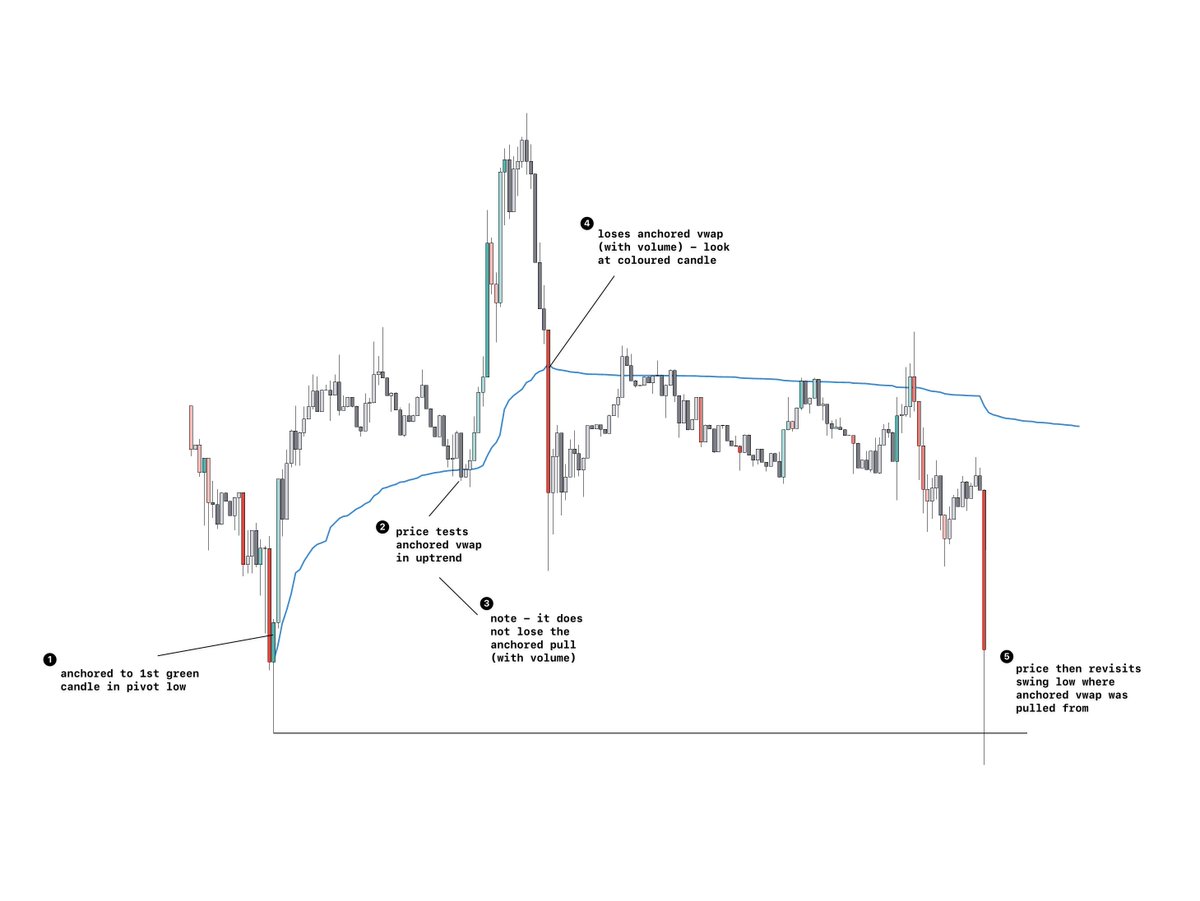
use cases
signs of strength/weakness:
- mainly used when pulling from pivot (or intra day) highs/lows
example:
- if price is uptrending and loses anchored vwap (anchored to low)
there is greatly increased likelihood of price revisiting the swing low it has been anchored from
signs of strength/weakness:
- mainly used when pulling from pivot (or intra day) highs/lows
example:
- if price is uptrending and loses anchored vwap (anchored to low)
there is greatly increased likelihood of price revisiting the swing low it has been anchored from
use cases (2)
range median:
- mainly used when pulling from beginning of a range (as shown above)
I use it similar to how I would a POC of a range, as a POI to take trades off, should it come into confluence with other levels
note - not my favourite use case of tool
range median:
- mainly used when pulling from beginning of a range (as shown above)
I use it similar to how I would a POC of a range, as a POI to take trades off, should it come into confluence with other levels
note - not my favourite use case of tool

notes
pivot high/low pulls can be used when within a range also.
- this is a common use case I like to use:
rotating from VAH to VAL with the anchored vwap anchored to the pivot high where we started to rotate from.
pivot high/low pulls can be used when within a range also.
- this is a common use case I like to use:
rotating from VAH to VAL with the anchored vwap anchored to the pivot high where we started to rotate from.
execution
the anchored vwap tool simply is able to give me a heads up as to when a potential trend will end/sign of weakness.
it also can be a POI as when you pull back in a ongoing trend to look for s/r at that anchored vwap
to execute I suggest reading this 👇
the anchored vwap tool simply is able to give me a heads up as to when a potential trend will end/sign of weakness.
it also can be a POI as when you pull back in a ongoing trend to look for s/r at that anchored vwap
to execute I suggest reading this 👇
https://twitter.com/Luckshuryy/status/1689998572773605376
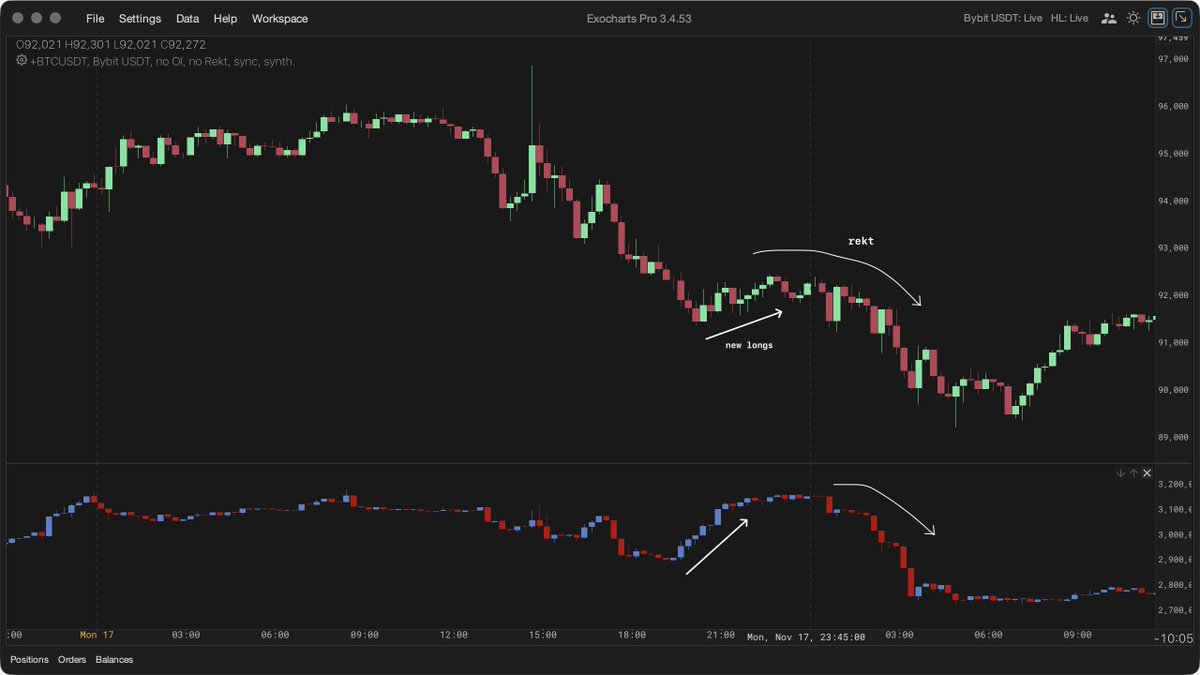
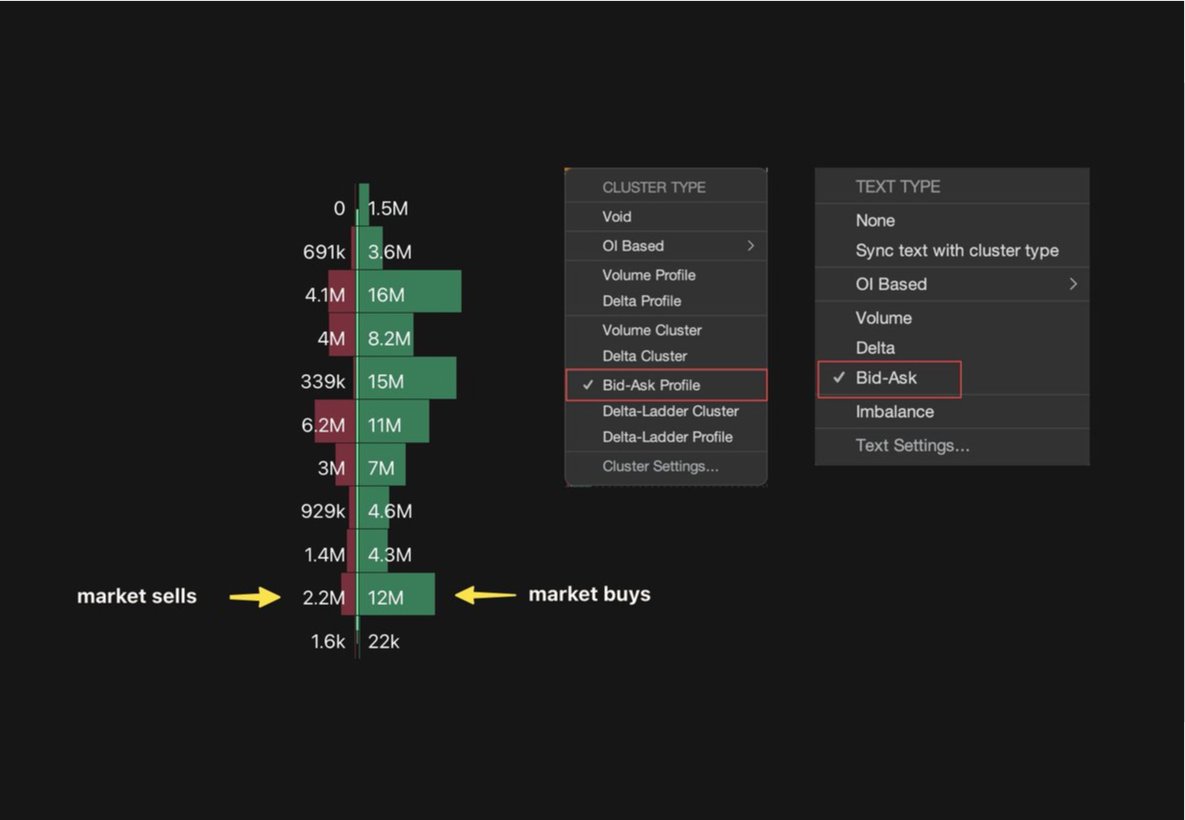
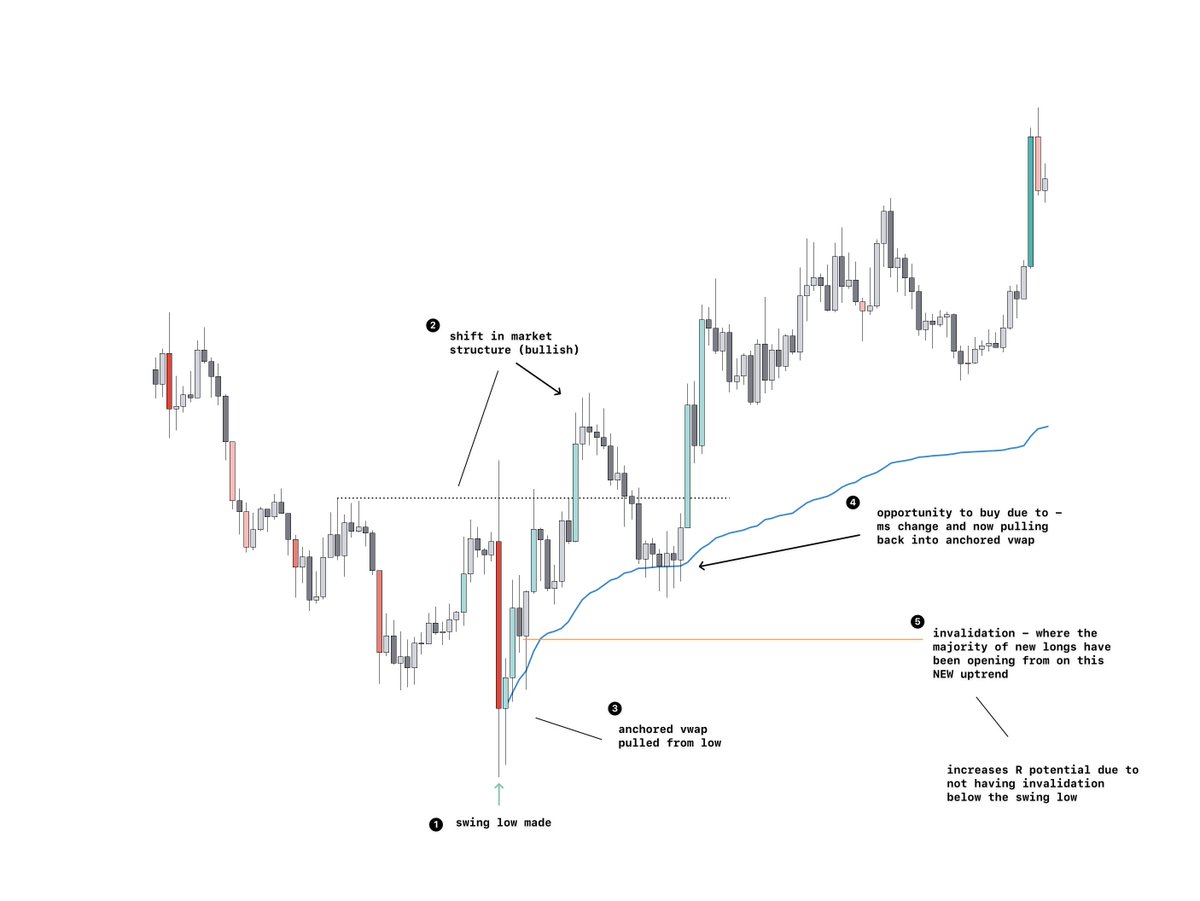
advanced example
this diagram should explain it all:
this is a super nice trade I took a while back using this exact reasoning, which not only uses anchored vwap, but brings into play order flow and where the majority are sided.
hope you found value thank you for reading.
👇
this diagram should explain it all:
this is a super nice trade I took a while back using this exact reasoning, which not only uses anchored vwap, but brings into play order flow and where the majority are sided.
hope you found value thank you for reading.
👇
• • •
Missing some Tweet in this thread? You can try to
force a refresh