The shares of the major currencies in global reserves, as reported to the IMF.
1/
The dollar's weight in global reserves is roughly 3 times the United States weight in the global economy (maybe a bit less0; the euro's weight is close to its weight in the global economy -- and China still punches way below its weight, for obvious reasons!
2/
A far more interesting chart showing global reserves --
The big, interesting important story isn't shifts in share ... but the huge increase in reserve holdings from 02 to 14, and the subsequent reduction in the pace of accumulation.
3/
A technically demanding global reserves chart -- one showing actual flows (purchases + retained interest income) by currency.
The bond market adjustment complicates everything; I don't yet have a good bond market adjustment for the euro.
4/
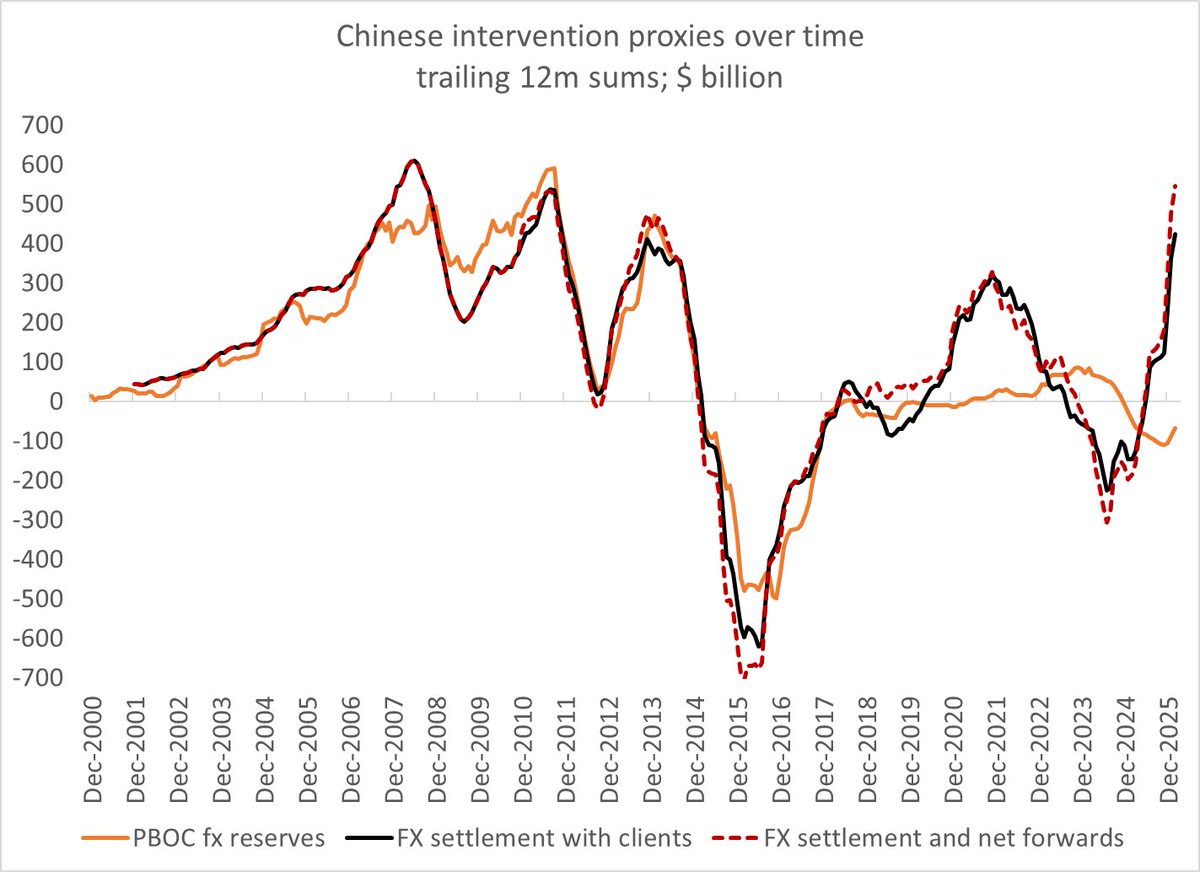
China's reserve sales in 15-16 obviously figure heavily in that chart ...
and there was a quite large pickup in reserve accumulation in 2020-21 that we now tend to forget.
5/
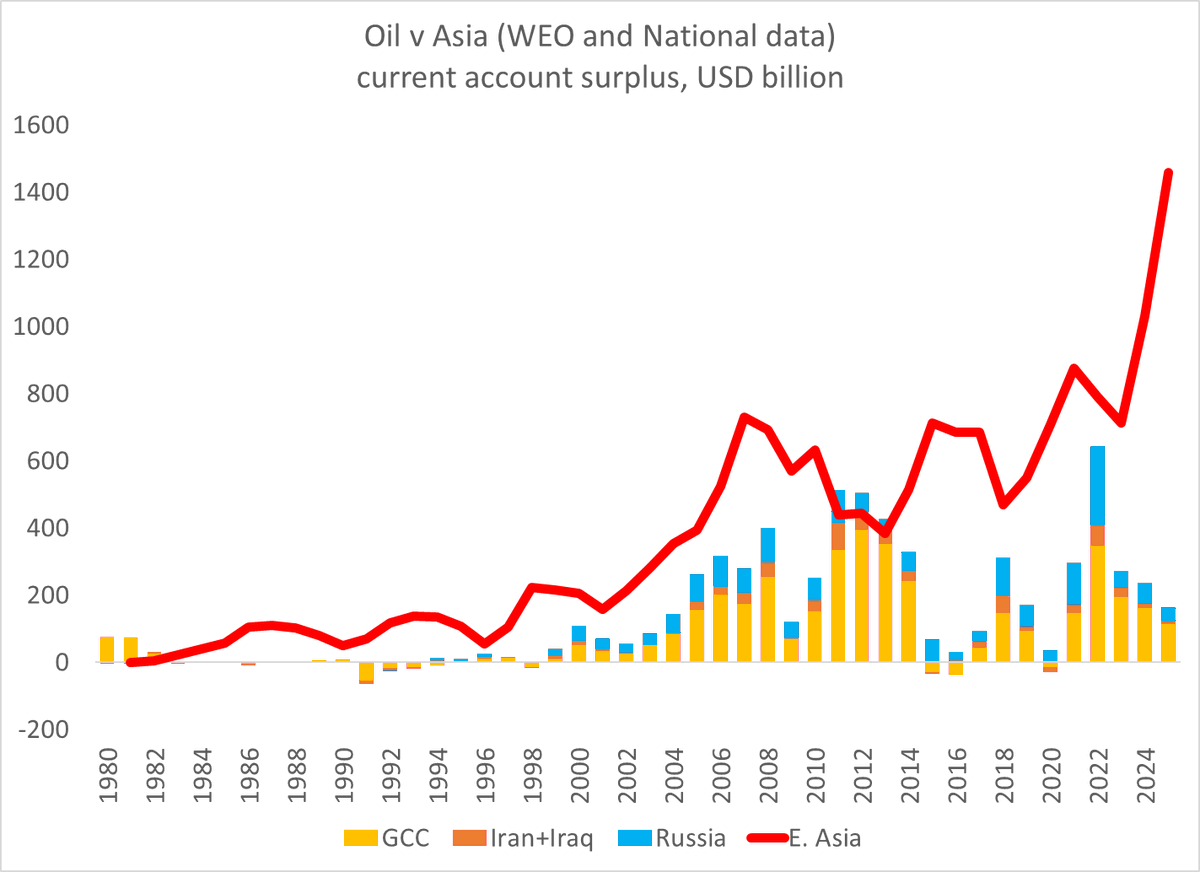
And some of the most interesting stories told by the reserves data have nothing to do with China --
For example, EM Asia sold a lot of reserves last summer and fall, in what I think was a successful defense against an overshot of their currencies when oil was high!
6/
And, as I have noted many times and in many different ways, looking only at formal reserves misses much of the picture these days -- China has as much money in state banks, its policy banks and state investment funds as it holds in its formal reserves ...
7/7
So there are stories to tell that don't hinge on creatively graphing these two lines ...
8/8
• • •
Missing some Tweet in this thread? You can try to
force a refresh
The Treasury has indicated that it will look at the activities of China's state banks in its next assessment of China's currency policies--
It is hard to see how this doesn't become a bit of an issue ... unless of course summitry gets in the way of analysis 1/
It is quite clear that state bank purchases (and in 23/ early 24 sales) of fx have replaced PBOC purchases and sales and the core technique China uses to manage the band around the daily fx -- i.e. settlement looks like an intervention variable
2/
My latest blog looks both at how fx settlement (a measure that includes the state banks) has displaced the PBOC's own reported reserves as the best metric for Chinese intervention & lat some of SAFE's balance sheet mysteries
The blog is detailed and technical -- and thus probably best read by those with a real interest in central bank balance sheets, the balance of payments and how to assess backdoor foreign currency intervention
2/
Drawing on historical data, I propose that the gap between fx settlement and the foreign assets on the PBOC's balance sheet (fx reserves + other f. assets) is a good indicator of hidden intervention --
Obviously overshadowed by the news about a Fed nomination, but the Treasury released its delated October 2025 FX report today and it is worth reading -- not the least b/c of a clear warning to SAFE.
1/
This seems clear
"An economy that fails to publish intervention data or whose data are incomplete will not be given any benefit of the doubt in Treasury’s assessment of intervention practices."
This report only covers the period between July 24 and June 25, so it misses the bulk of the 2025 surge in fx settlement (December = $100b plus). But this chart suggests the use of more sophisticated analytical techniques than those used in past reports --
A bit of background. Taiwan's lifers hold $700 billion in foreign currency assets abroad (more counting their holdings of local ETFs that invest heavily in foreign bonds) v ~ $200 billion in domestic fx policies -- so fx gap (pre hedging) of $500 billion
2/
Taiwan's regulator (perhaps the most complicit regulator on earth) not allows the lifers NOT to mark their fx holdings to the fx market -- so the lifers are incentivized not to hedge (and they are rapidly reducing their hedge ratio)
Japan is an interesting case in a lot of ways. It has a ton of domestic debt (and significant domestic financial assets) which generates heated concerns about its solvency/ ability to manage higher rates. But it is also a massive global creditor --
1/
Japan's net holdings of bonds (net of foreign holdings of JGBs) is close to 50% of its GDP (a creditor position as big v GDP as the US net det position). That includes $1 trillion in bonds held in Japan's $1.175 trillion in reserves, + over $2 trillion in other holdings
2/
That translates into big holdings of US debt -- the MoF's Treasuries all show up in the US TIC data, but the corporate bonds held by the lifers, postbank and the GPIF are only partially captured in the US data b/c of third party management/ the use of EU custodians
14m cars would be roughly 1/4th of the global market for cars outside China (the Chinese market is ~ 25m cars) ... no way that doesn't have a disruptive impact.
China would go from 6 to 14m cars in a two year period if 2025 isn't an outlier ...
2/
Not clear that German/ European politics can caught up to the scale of China's export tsunami. And some European firms think they can profit from China's subsidies and strong local supply chain by producing in China for the European market