One of the major criticisms of HSR Phase II was that all the “economically viable” locations had already been connected.
This made the critical mistake of assuming cities are static.
Example: HSR came to Huzhou, a city in northern Zhejiang Province, in June 2020.

This made the critical mistake of assuming cities are static.
Example: HSR came to Huzhou, a city in northern Zhejiang Province, in June 2020.
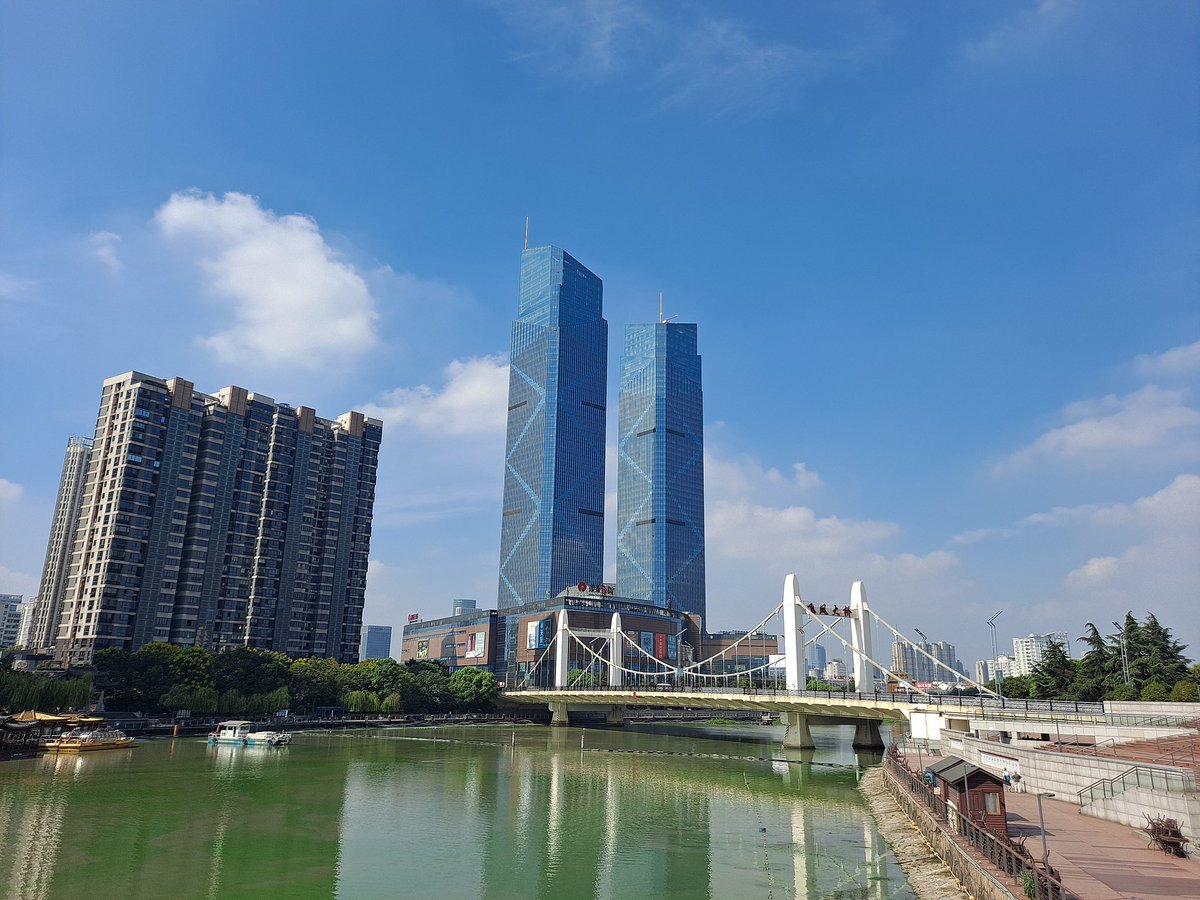

Known as the “City of Silk”, Huzhou is a Tier IV prefecture with an urban population of around 1.6M.
It has per capita GDP of around ¥113k, ~72% of Shanghai’s, which lies 2 hours to the east
It has per capita GDP of around ¥113k, ~72% of Shanghai’s, which lies 2 hours to the east
But this is still much higher than Shanghai when it got HSR in 2011 (~¥85k).
And we all know how Shanghai took to HSR travel: Beijing-Shanghai is today by far the busiest HSR line in the world.
And we all know how Shanghai took to HSR travel: Beijing-Shanghai is today by far the busiest HSR line in the world.
Or take Yibin in Sichuan, of Wuliangye fame a.k.a. “Poor Man’s Moutai” according to Guizhou人.
Tier IV prefecture with a 2.2M urban population that will finally connect to the HSR network this year.
Its per capita GDP (~¥78k) is only slightly lower than Shanghai’s in 2011.
Tier IV prefecture with a 2.2M urban population that will finally connect to the HSR network this year.
Its per capita GDP (~¥78k) is only slightly lower than Shanghai’s in 2011.

There are still quite a few Tier IV and lower cities that still need to be connected to the HSR network.
Many of these are wealthier today than Tier I and II cities when they were first connected.
And bc it doesn’t take as much physical track to connect them, incr. RoI is high.
Many of these are wealthier today than Tier I and II cities when they were first connected.
And bc it doesn’t take as much physical track to connect them, incr. RoI is high.
https://twitter.com/glennluk/status/1695106032689692754
The other major misconception was that planners were “shooting in the dark” and building lines without a good idea that people would use them.
There may have been some uncertainty when the first lines were built - would travelers pony up 3x the ticket prices to get there faster?
There may have been some uncertainty when the first lines were built - would travelers pony up 3x the ticket prices to get there faster?
But once the lines were rolled out, and planners saw that travelers were indeed willing to pay more - this particular risk largely went away.
The other risk was construction and technical risk. Could the lines be built at a low-enough cost and would the technology work?
The other risk was construction and technical risk. Could the lines be built at a low-enough cost and would the technology work?
On the construction cost side, it became apparent in Phase I that was China Railway could built these things at a consistent and predictable cost that could be extrapolated out across the rest of the country, across various topographies.
So construction risk dissolved too.
So construction risk dissolved too.
On the technical side, the 2011 Wenzhou crash raised this risk significantly and ended up setting back the industry at least two years.
But subsequent improvements and a sparkling clean safety record since lowered this risk significantly since 2011.
But subsequent improvements and a sparkling clean safety record since lowered this risk significantly since 2011.
(After lowering maximum speeds in response to the Wenzhou crash, railway planners are now once again talking about raising them … beyond even the original 350 km/hr maximum)
The remaining major risk is then whether new line routes would have sufficient ridership to justify incremental investment.
But even here, the risks were largely mitigated by the fact that planners actually had a ton of data to work with from the conventional train network.
But even here, the risks were largely mitigated by the fact that planners actually had a ton of data to work with from the conventional train network.
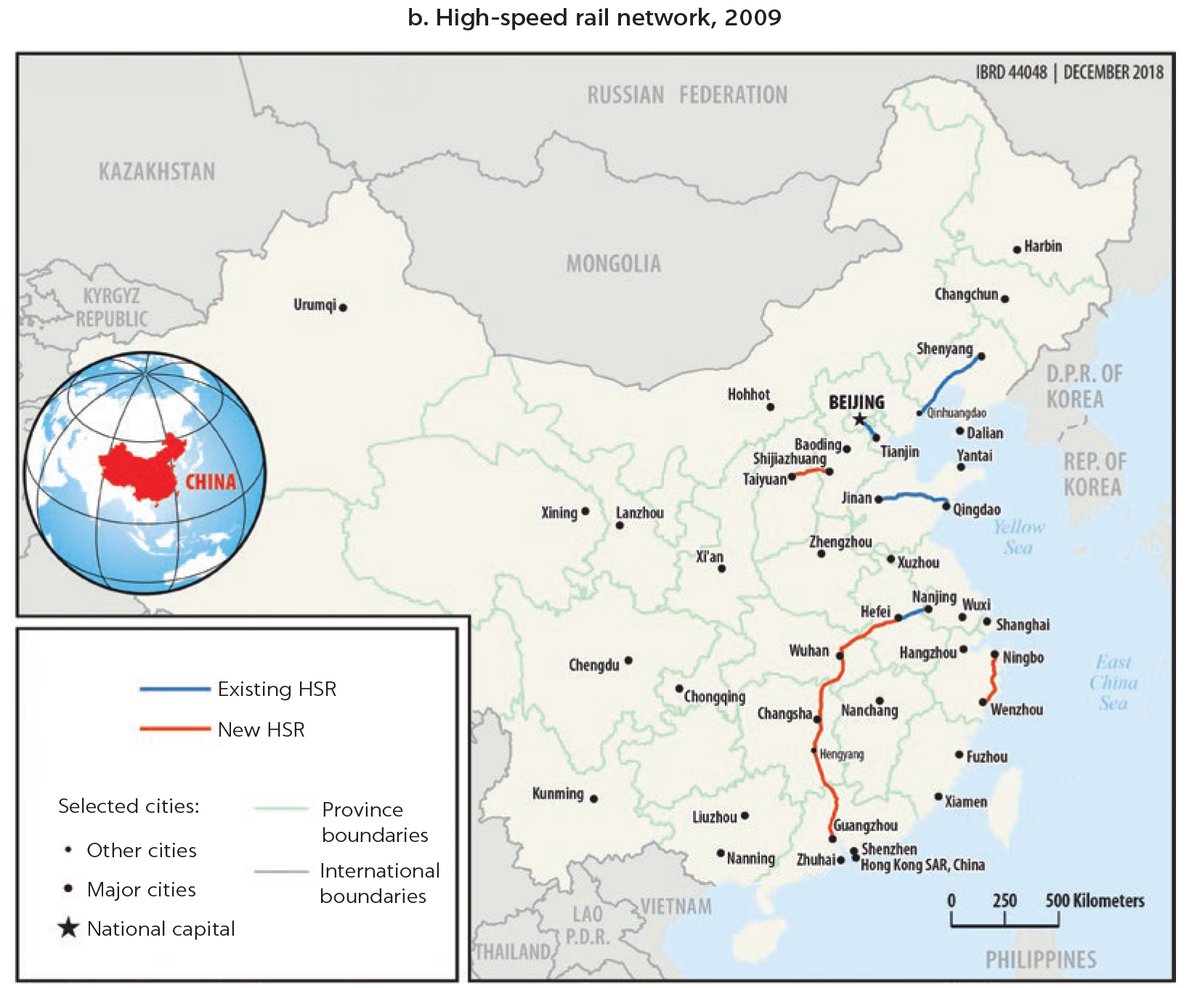
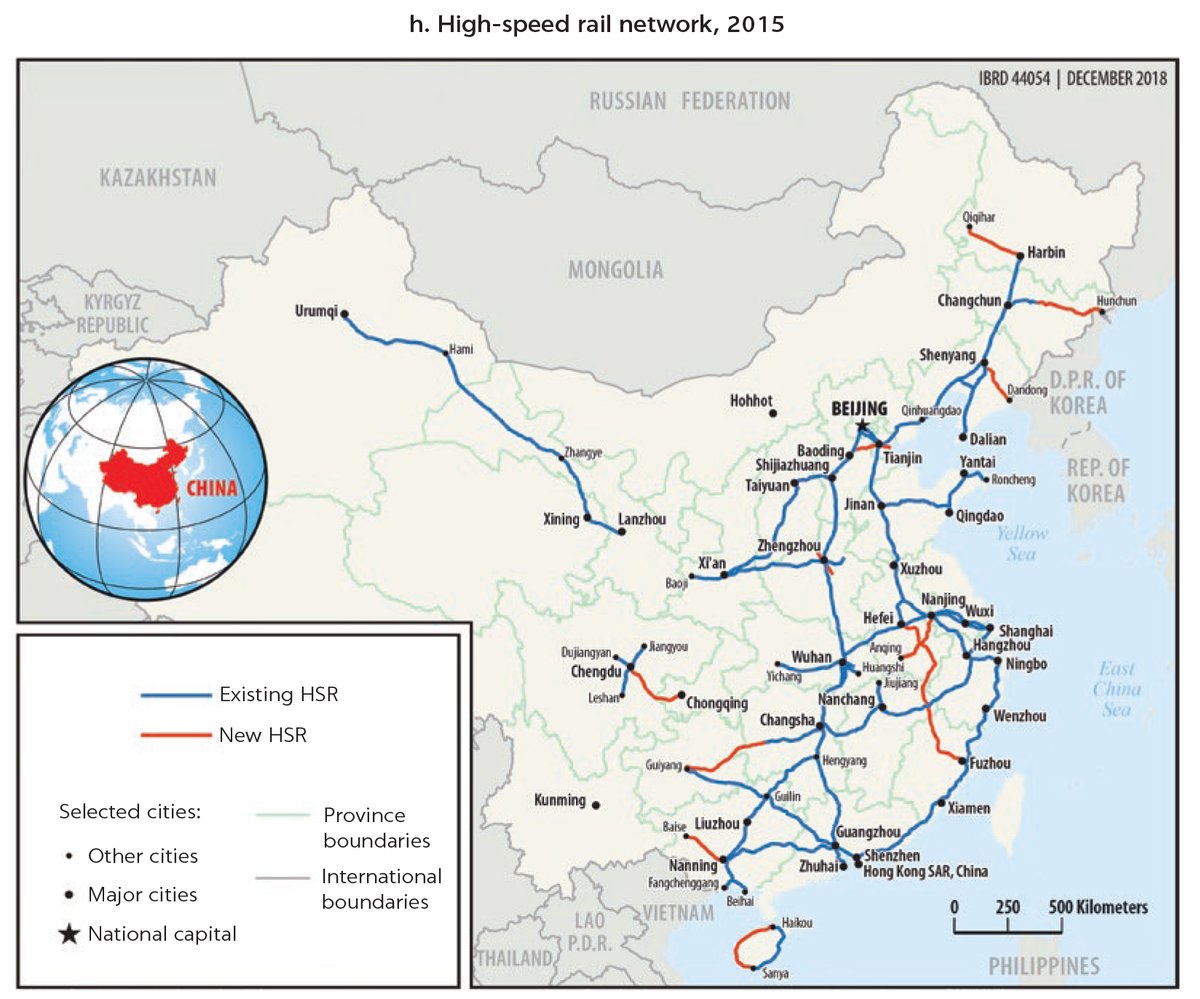
It is very obvious looking at these network evolution maps that HSR were built on top of existing conventional passenger routes
Ridership from conventional routes consistently translated into HSR ridership.
Picking new routes was almost formulaic.
Ridership from conventional routes consistently translated into HSR ridership.
Picking new routes was almost formulaic.
https://twitter.com/glennluk/status/1695103369315065890
Once all of these risks (market fit, costs, technical feasibility) were mitigated in Phase I, the risk-reward profile of incr. HSR investment became very attractive.
The key constraint shifted from risk profile to execution capacity - how quickly could this network be built?
The key constraint shifted from risk profile to execution capacity - how quickly could this network be built?
TL;DR:
Once you analyze the economics and risk-reward profile of the 3-phase HSR network buildout …
… it is clear that contrary to claims of it being “increasingly non-productive investment”, incremental RoI is actually rising over time, especially on a risk-adjusted basis.
Once you analyze the economics and risk-reward profile of the 3-phase HSR network buildout …
… it is clear that contrary to claims of it being “increasingly non-productive investment”, incremental RoI is actually rising over time, especially on a risk-adjusted basis.
• • •
Missing some Tweet in this thread? You can try to
force a refresh