
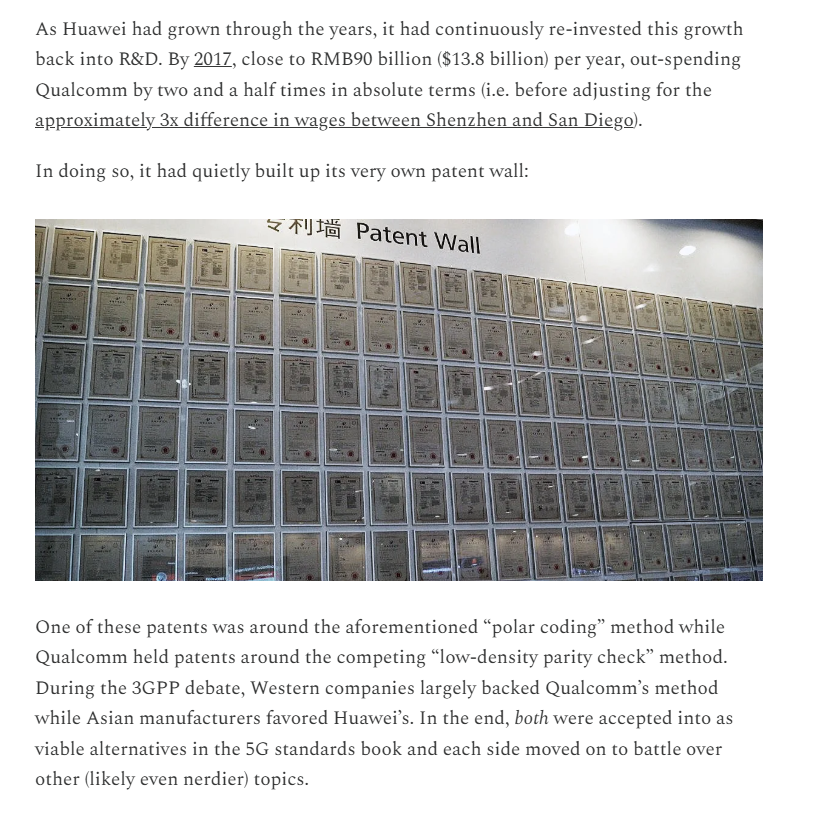
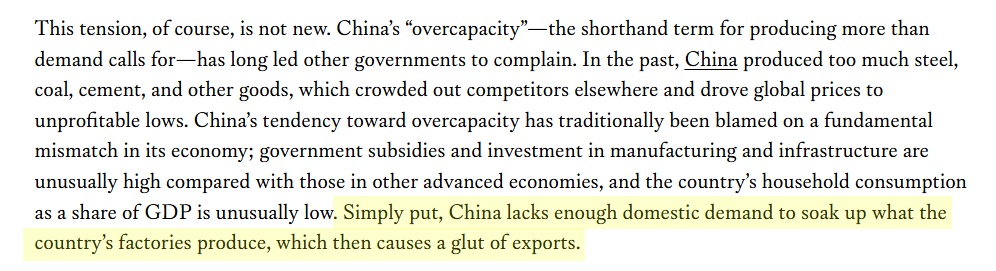
 A key implication here is that it is more difficult for companies to build a sustainable economic moat around core technology in China.
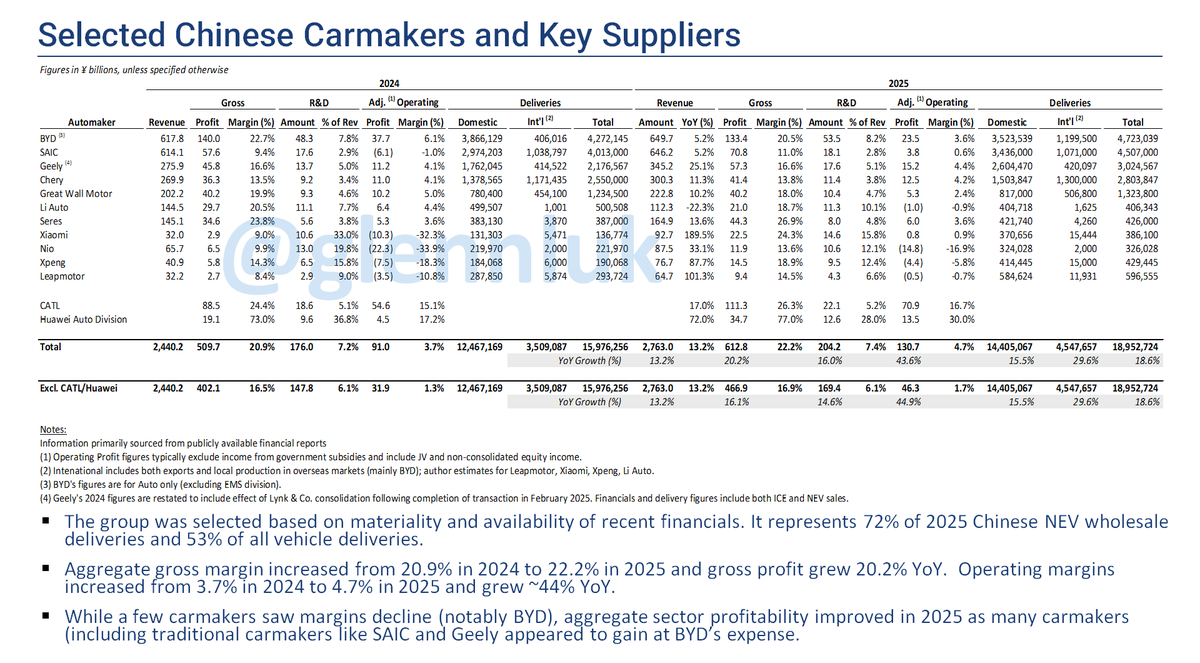
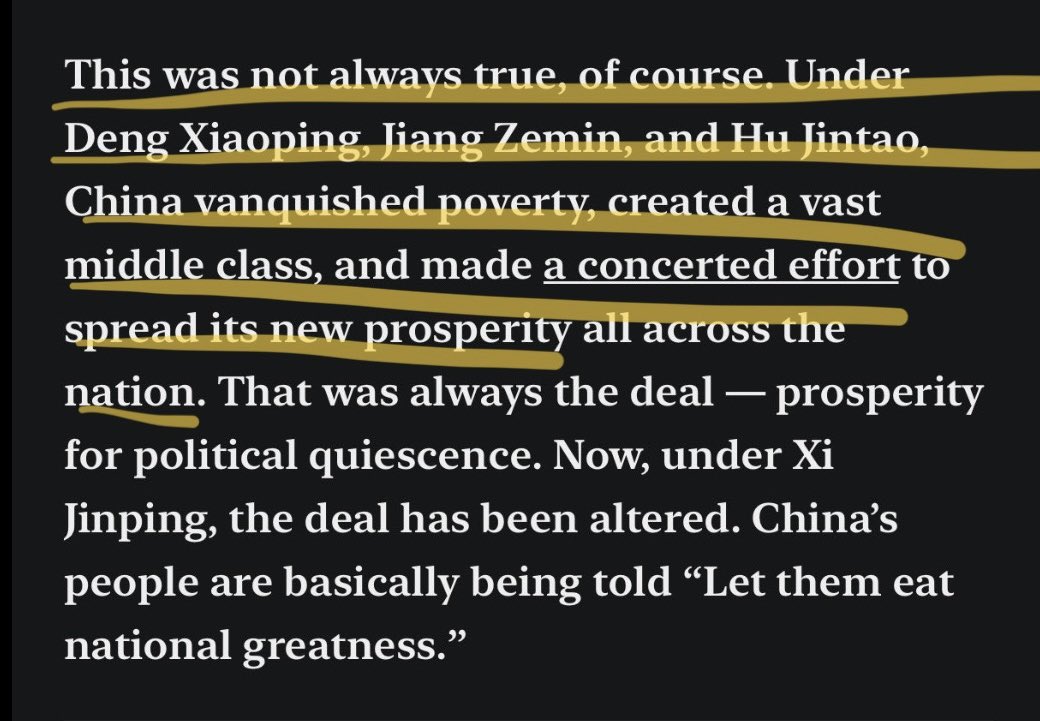 Gini coefficient for wages peaked in 2008.


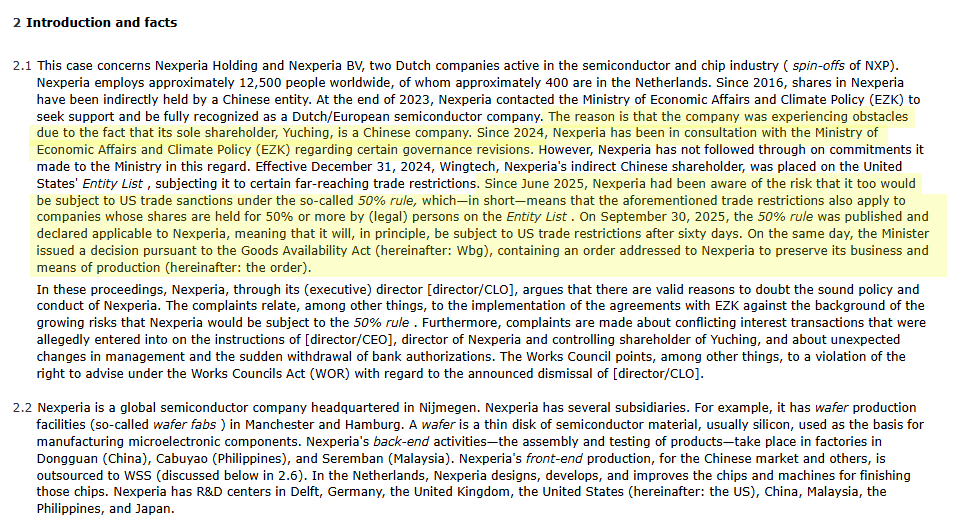 A detailed timeline of the events described in the legal brief clearly show that the entire series of events were instigated by the addition of Wingtech, which indirectly owned/controlled 100% of Nexperia, to the Entity List.
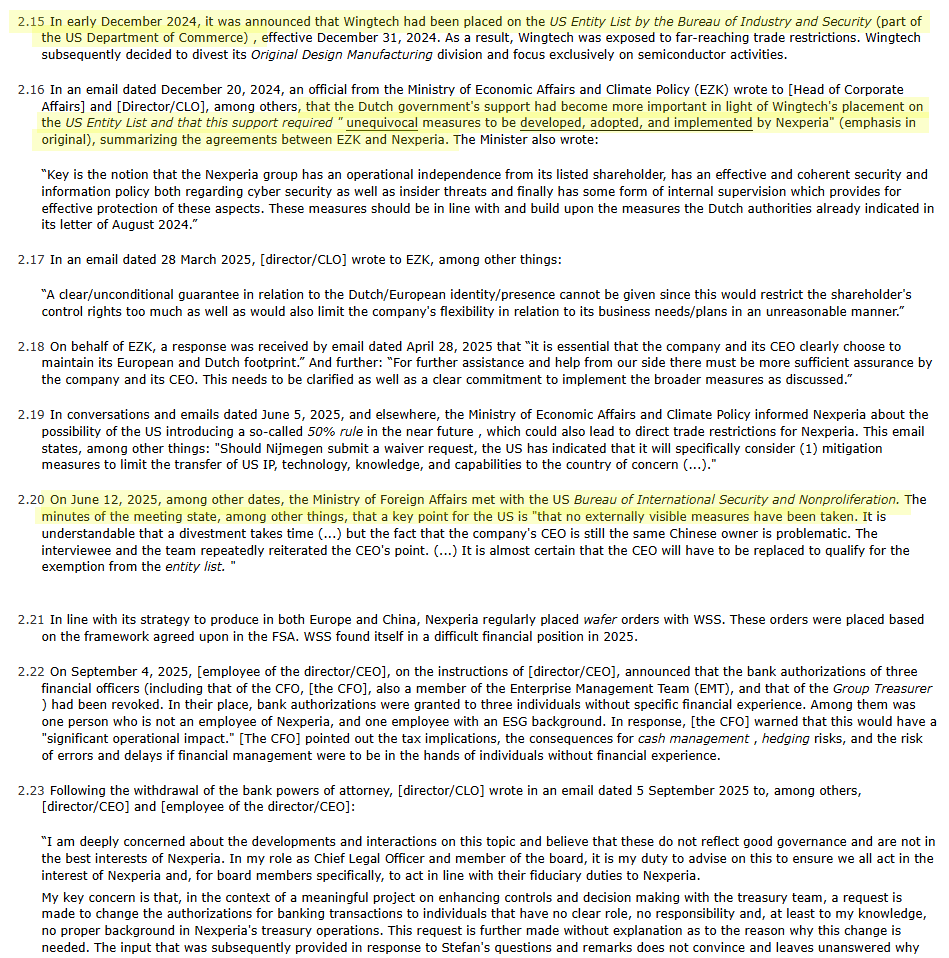


 This number (which tends to range from 100 to 150) is actually derived from brands — ostensibly pulled out of the CAAM** database. Depending on how high the number is, it could include defunct, retired brands.

