Liquidity & #Bitcoin are inexorably linked. For in-depth analysis on this topic you cant go past @42MacroWeather @RaoulGMI @crossbordercap @MacroAlf
This 🧵 explores one specific liquidity measure in order to understand whether it it has "signal value" for $BTC
This 🧵 explores one specific liquidity measure in order to understand whether it it has "signal value" for $BTC
@42MacroWeather @RaoulGMI @crossbordercap @MacroAlf Firstly, there is no settled definition of liquidity and opinions on the topic vary wildly. The US Financial Liquidity Index is the most widely vaunted on Twitter, so I have chosen this as the focus. You can find it on the @TheTerminal by running the ticker {.US_LIQI G Index}
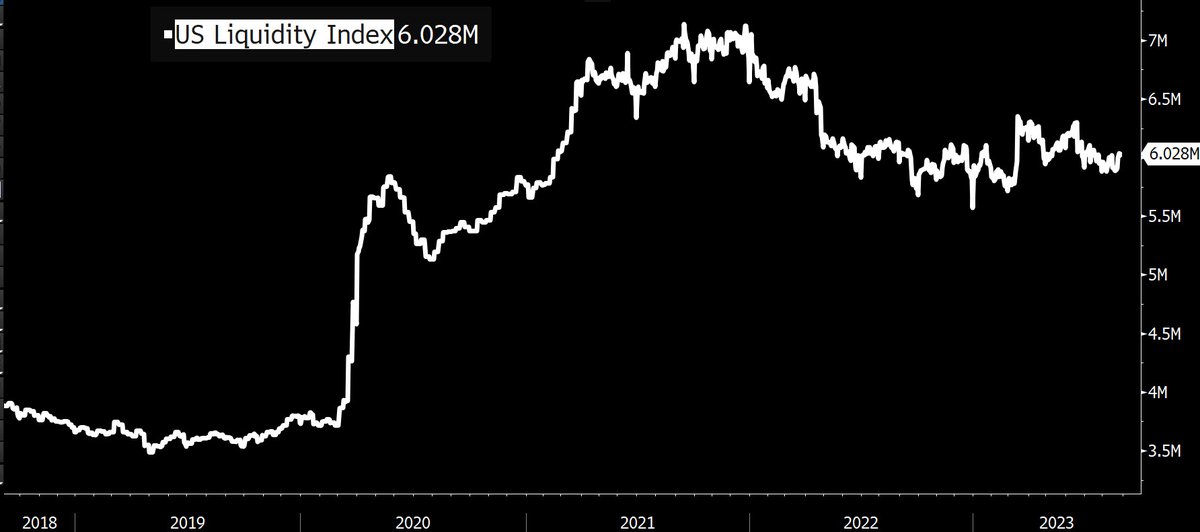
@42MacroWeather @RaoulGMI @crossbordercap @MacroAlf @TheTerminal Currently aggregate US Financial Liquidity is $6.02T. How is it constructed?
Fed Balance Sheet ($8.13T) -- ⬆️ adds liquidity
(RRP) Reverse Repo Facility at the Fed ($1.69T) -- ⬆️ reduces liquidity
(TGA) Treasury Account at the Fed ($0.41T) -- ⬆️ reduces liquidity
Fed Balance Sheet ($8.13T) -- ⬆️ adds liquidity
(RRP) Reverse Repo Facility at the Fed ($1.69T) -- ⬆️ reduces liquidity
(TGA) Treasury Account at the Fed ($0.41T) -- ⬆️ reduces liquidity
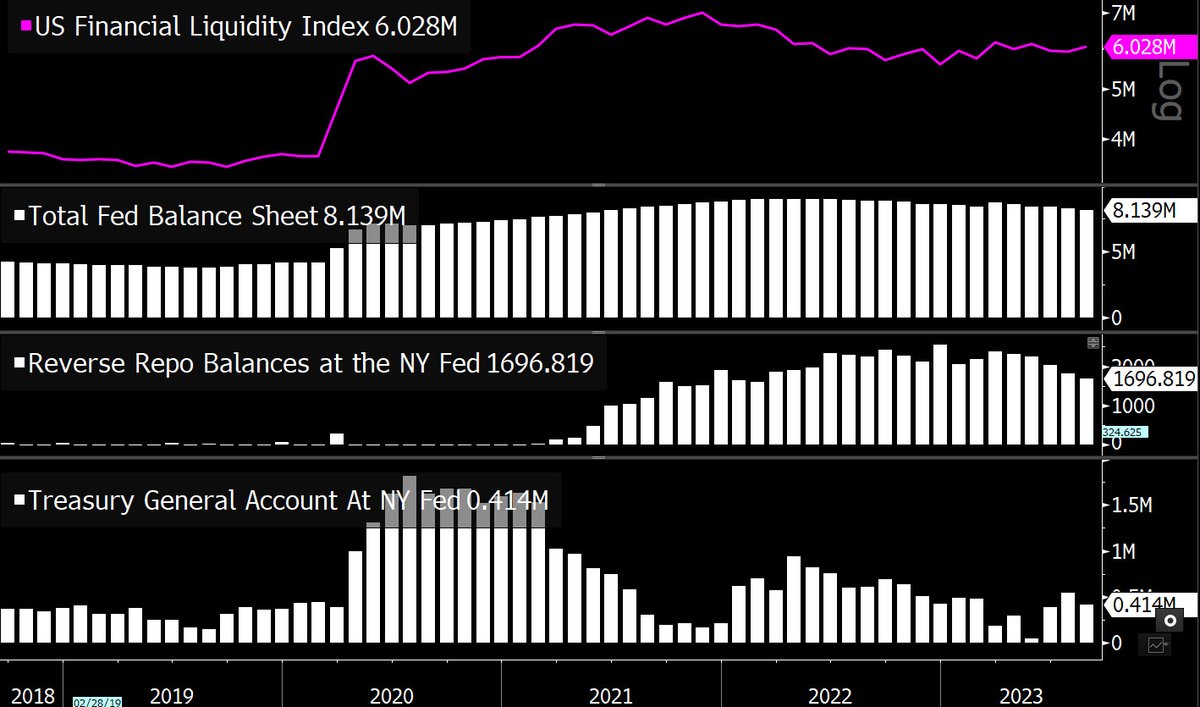
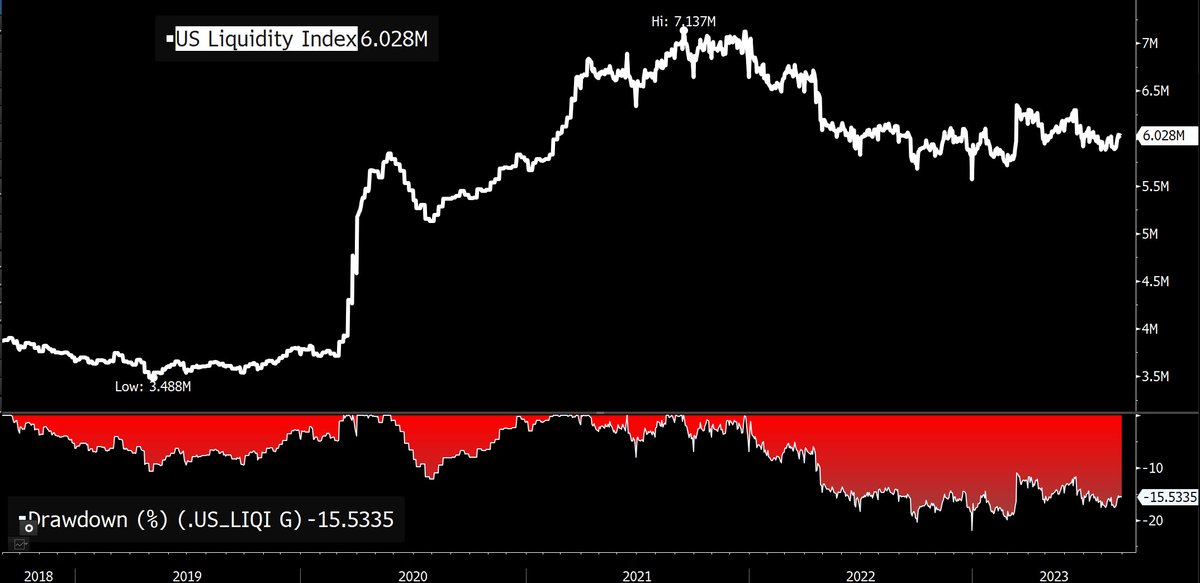
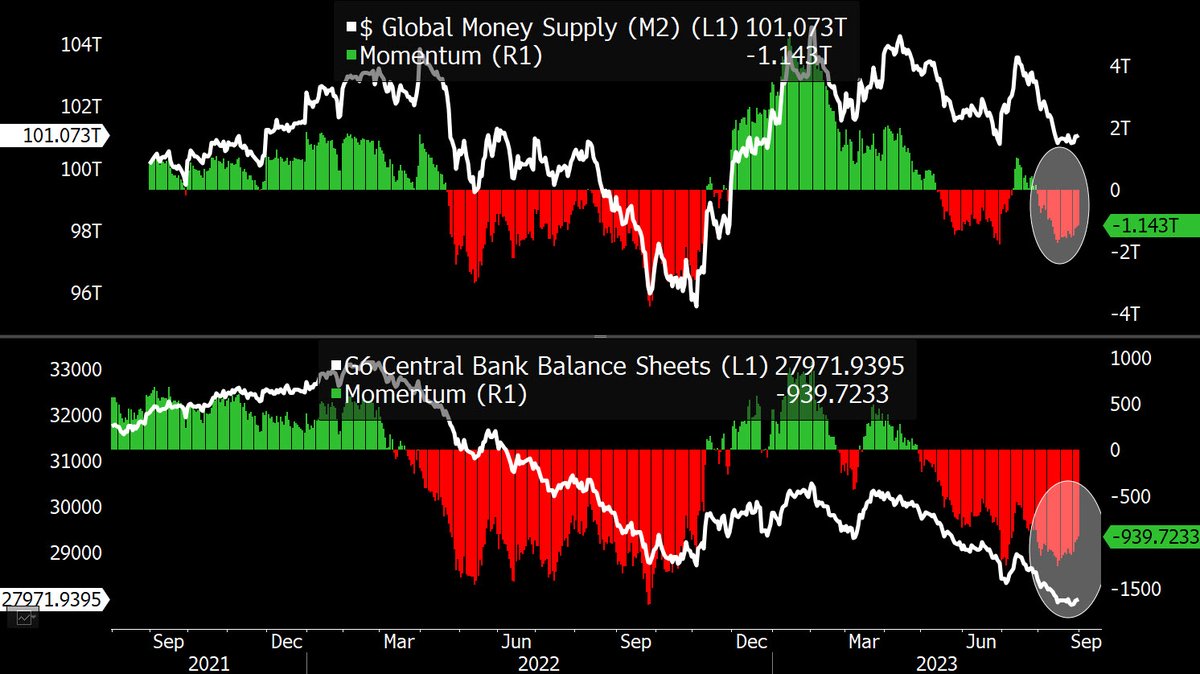
@42MacroWeather @RaoulGMI @crossbordercap @MacroAlf @TheTerminal About $1T (-15%) has been drained since 2021, according to this one important, but narrow measure.
All of it has been due to the Fed ⬇️ the size of its Bal Sheet. Had the Treasury not gone on an unprecedented spending spree over the same period, it would have been a lot worse.
All of it has been due to the Fed ⬇️ the size of its Bal Sheet. Had the Treasury not gone on an unprecedented spending spree over the same period, it would have been a lot worse.
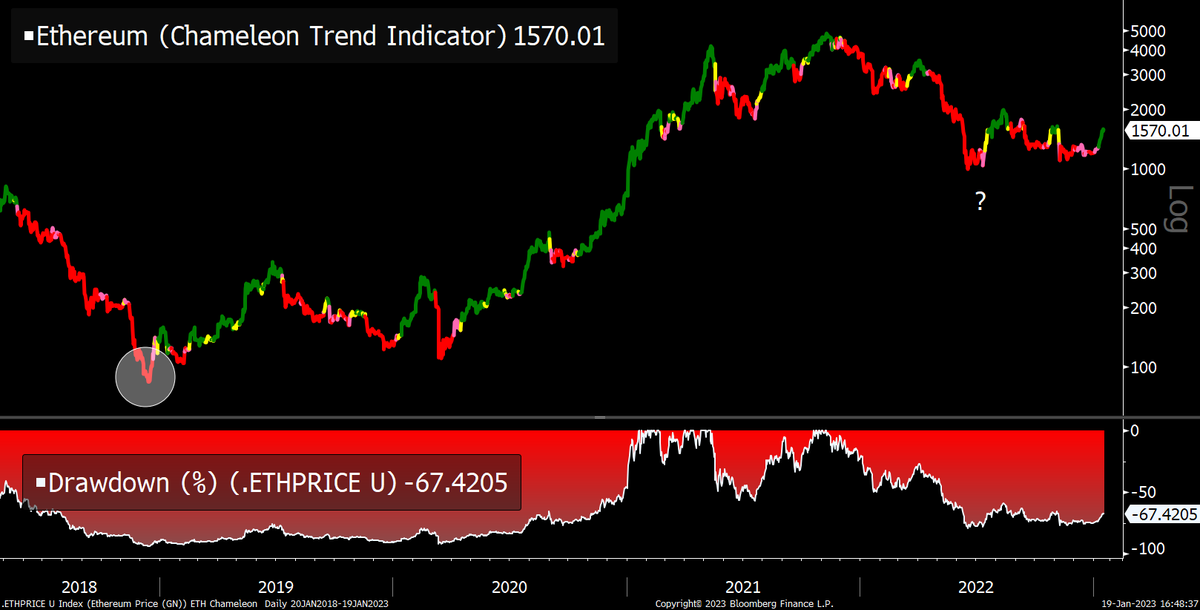
@42MacroWeather @RaoulGMI @crossbordercap @MacroAlf @TheTerminal How does this relate to Bitcoin?
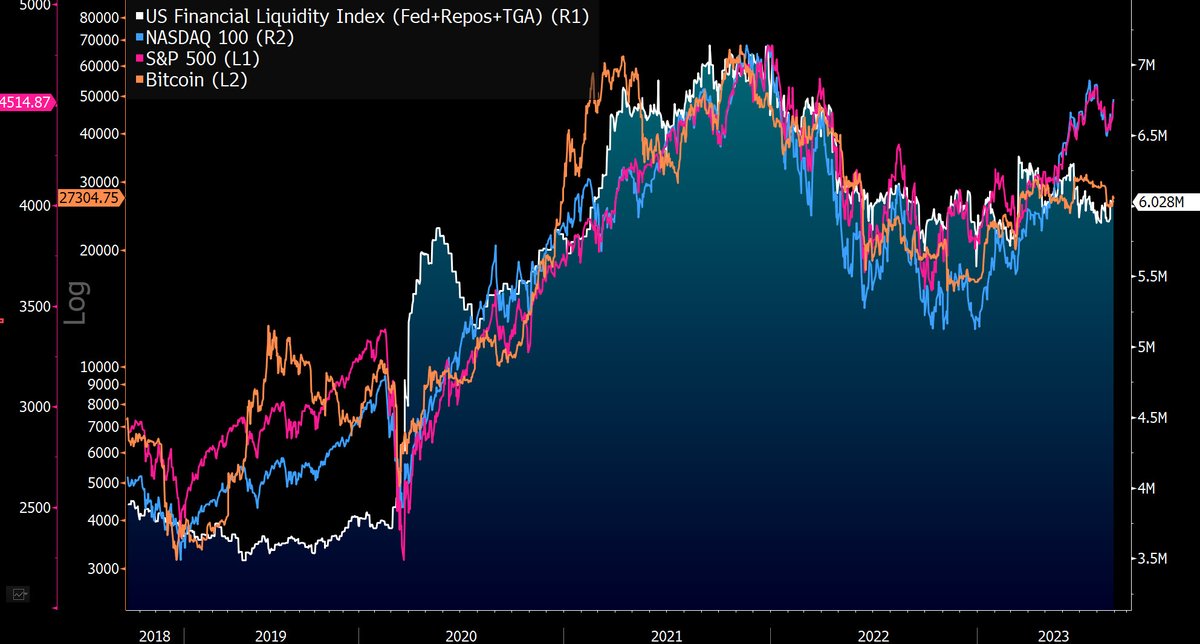
Well, Bitcoin tracks this index pretty closely.
Well, Bitcoin tracks this index pretty closely.

@42MacroWeather @RaoulGMI @crossbordercap @MacroAlf @TheTerminal When we add in Equity markets we see how all risk assets are tightly related. This has intensified since the Covid calamity where the monthly correlations have moved from below 0.20 to approx. 0.60-0.80.
@42MacroWeather @RaoulGMI @crossbordercap @MacroAlf @TheTerminal A word of caution on correlations. 2 series can look highly connected but it doesnt necessarily mean that 1 explains the other from a purely statistical standpoint. One measure is to look at the rtns of both timeseries
$BTC | liquidity index r^2 = 0.008 (no explanatory power)
$BTC | liquidity index r^2 = 0.008 (no explanatory power)
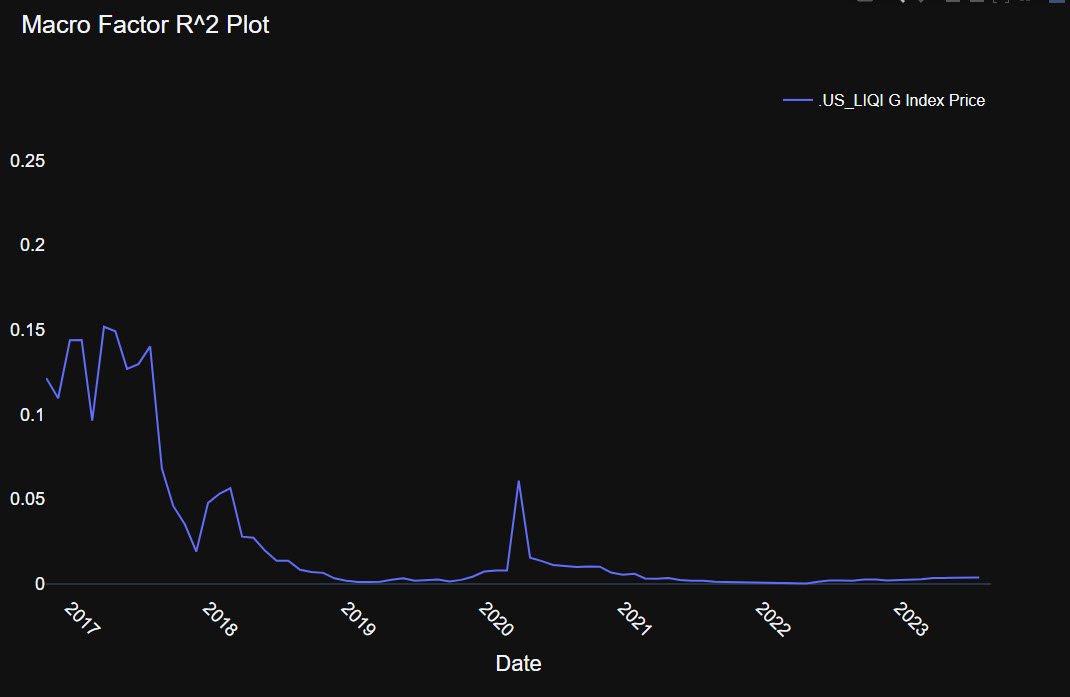
@42MacroWeather @RaoulGMI @crossbordercap @MacroAlf @TheTerminal That doesn't mean we should discard it. It just means it needs to be applied in a thoughtful way. Clearly Bitcoin has been reacting to the subtle changes in liquidity and on closer inspection even more so than equity markets which diverged strongly in July/Aug

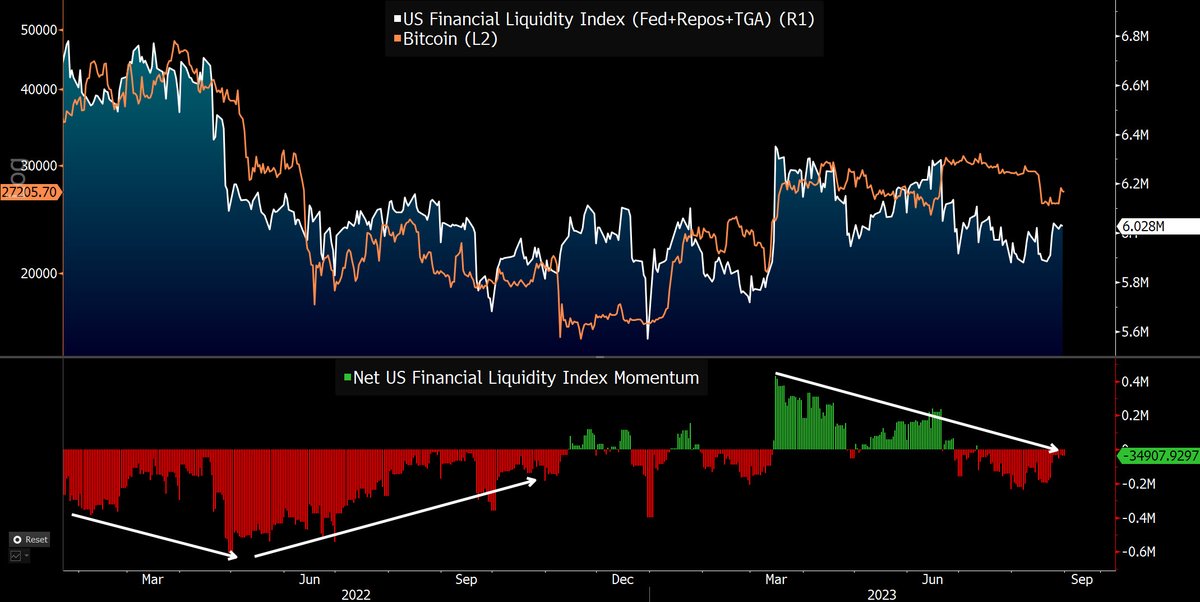
@42MacroWeather @RaoulGMI @crossbordercap @MacroAlf @TheTerminal So if we measure the momentum of US liquidity can we derive a signal? $BTC bottomed after net liquidity was most negative and started to decelerate in 2H22. After rallying with improving liquidity in Q1 (Bank Bailout), $BTC faded as liquidity receded, momentum went negative again
@42MacroWeather @RaoulGMI @crossbordercap @MacroAlf @TheTerminal Lets apply a simple moving average to Liquidity so we can generate a simple risk/on filter.

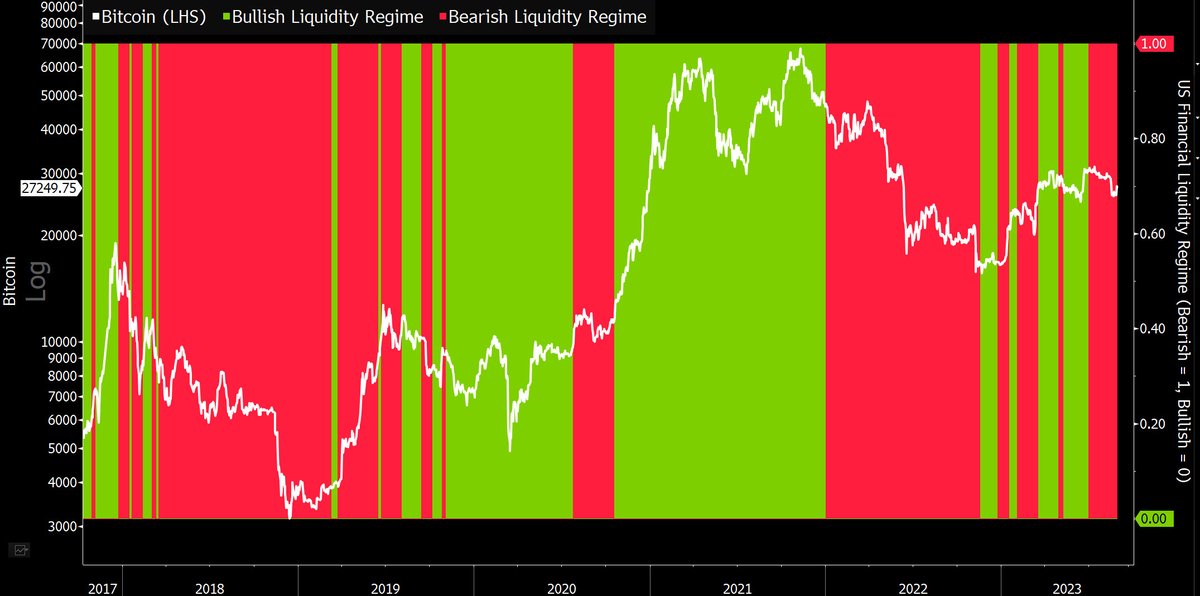
@42MacroWeather @RaoulGMI @crossbordercap @MacroAlf @TheTerminal I use something similar for my US Liquidity Regime Signal which I write about regularly at @BBGIntelligence. Here you can see Bitcoin against bullish/bearish liquidity regimes. We are currently in a Bearish regime.
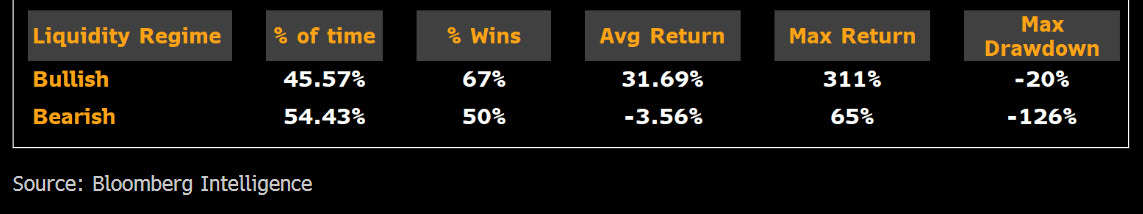
@42MacroWeather @RaoulGMI @crossbordercap @MacroAlf @TheTerminal @BBGIntelligence As a simple risk/on filter for Bitcoin the performance of the system is pretty robust. Main takeaway: $BTC performs when the wind (positive/expanding liquidity) is its back.
@42MacroWeather @RaoulGMI @crossbordercap @MacroAlf @TheTerminal @BBGIntelligence I discussed the results in more detail previously, here:
https://twitter.com/Jamie1Coutts/status/1696438615226925433?s=20
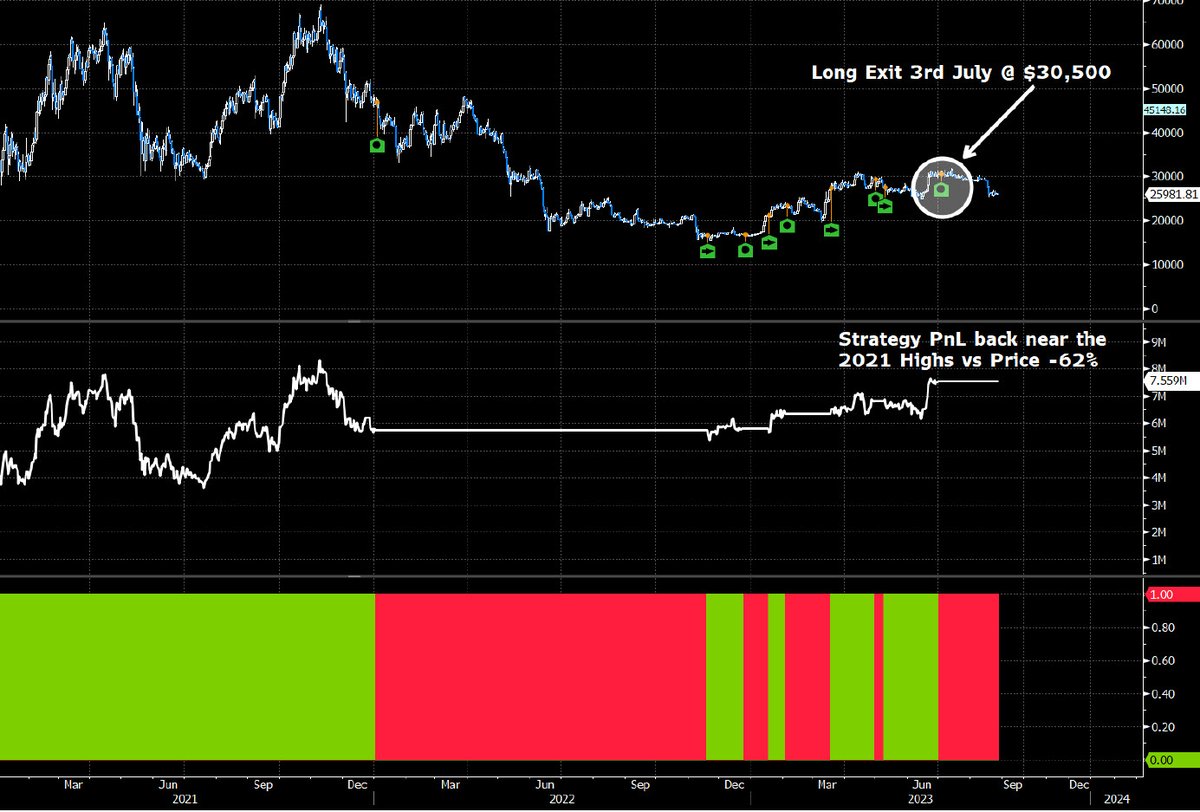
@42MacroWeather @RaoulGMI @crossbordercap @MacroAlf @TheTerminal @BBGIntelligence As a standalone trading strategy it has outperformed $BTC since 2014 (extent of the Liquidity index history) by approx. 33%. Not bad for the best performing asset. However, since inception, a $BTC Buy and hold strategy would have outperformed the strategy.
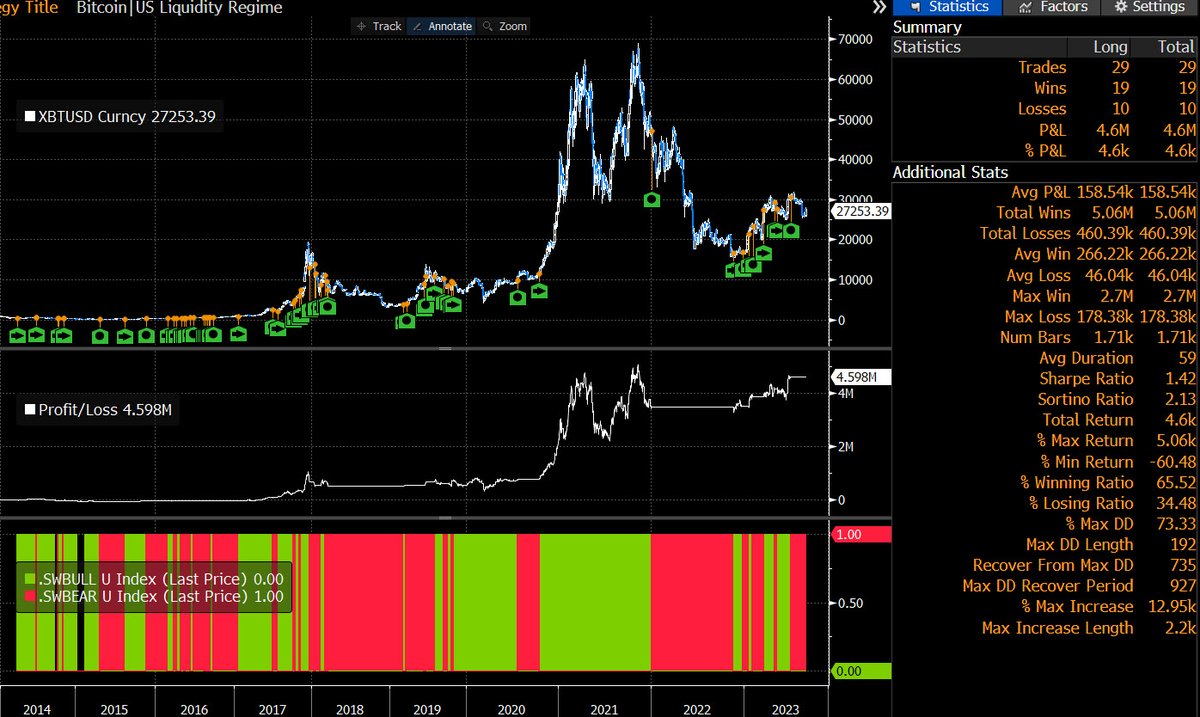
@42MacroWeather @RaoulGMI @crossbordercap @MacroAlf @TheTerminal @BBGIntelligence Note that strategy PnL is only 10% from high watermark and how it gave a timely signal when $BTC was above $30,500 in early July.
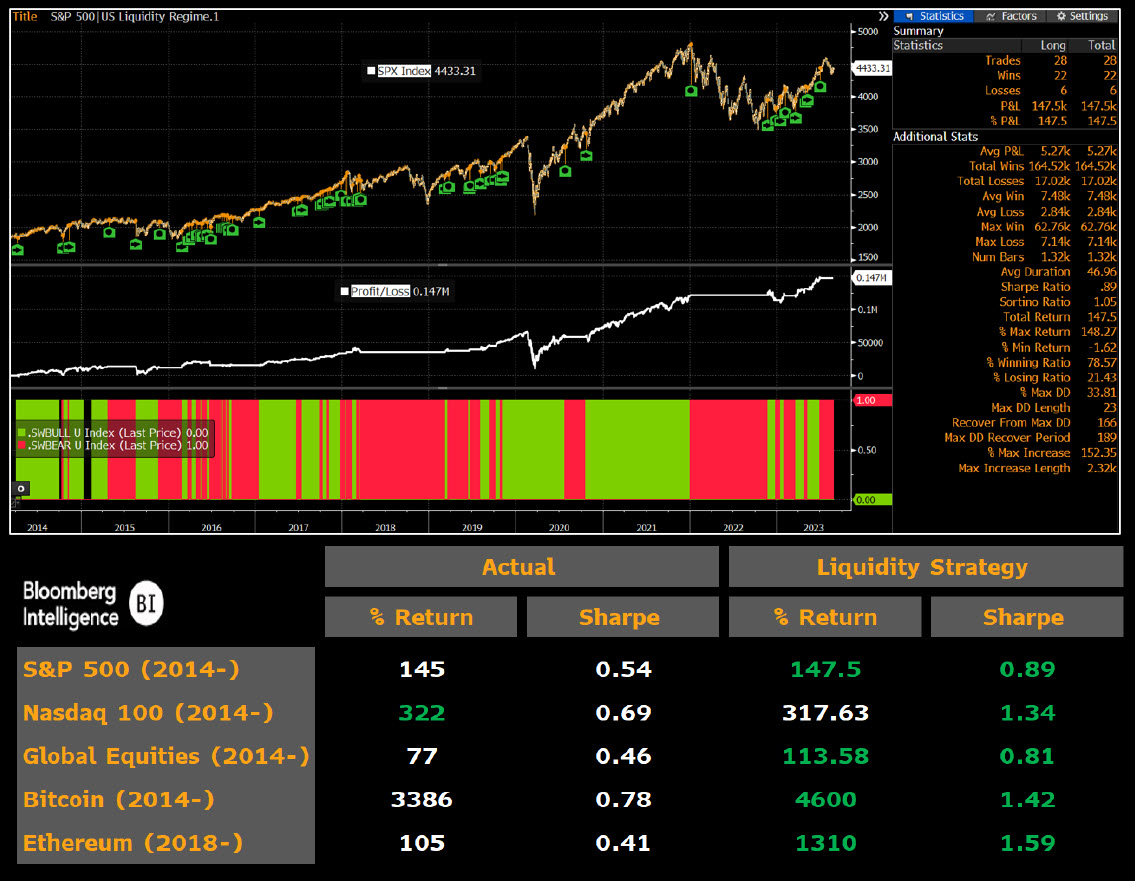
@42MacroWeather @RaoulGMI @crossbordercap @MacroAlf @TheTerminal @BBGIntelligence Unsurprisingly, given the correlation btwn risk assets, the US liquidity regime filter also works with other risk assets such as the S&P 500
@42MacroWeather @RaoulGMI @crossbordercap @MacroAlf @TheTerminal @BBGIntelligence While US Financial Liquidity Index is a critical measure to monitor for risk assets, it is by no means the only lens. Global Liquidity, especially China, real money (circulating currency, bank deposits), rates and volatility also need to be factored in.
https://twitter.com/Jamie1Coutts/status/1677286349383106560?s=20
• • •
Missing some Tweet in this thread? You can try to
force a refresh