Liquidations (REKT)
a thread 🧵
a thread 🧵

in this thread, I will cover the following:
- liquidation settings
- filtering larger liquidations
- where I look for liquidations
- exo specific rekt settings
- liquidation settings
- filtering larger liquidations
- where I look for liquidations
- exo specific rekt settings
settings within @ExochartsC
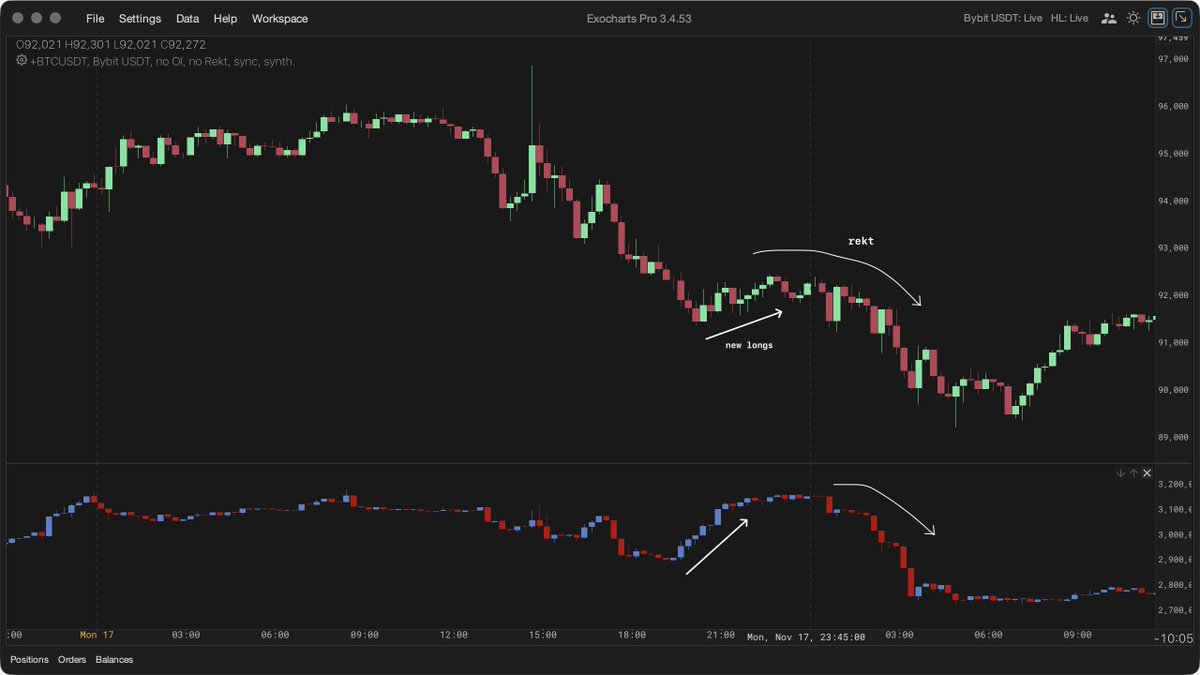
using rekt within the FPBS is how I found it to be most beneficial, using rekt all however, if you have enough screen space I would recommend having 2 separate rows for rekt, one for rekt long and the other for rekt short.
using rekt within the FPBS is how I found it to be most beneficial, using rekt all however, if you have enough screen space I would recommend having 2 separate rows for rekt, one for rekt long and the other for rekt short.

filtering out liquidations
rekt info you will be seeing within Exos fpbs, is going to be all rekt positions on the side in which you have set it to, this is not filtering out any data.
rekt bubbles - ensure hide orders less than (whatever size checked) I use 145k (BTC/USDT)
rekt info you will be seeing within Exos fpbs, is going to be all rekt positions on the side in which you have set it to, this is not filtering out any data.
rekt bubbles - ensure hide orders less than (whatever size checked) I use 145k (BTC/USDT)

why do I need both
questions I will ask myself upon any poi gets hit:
1 - is there a spike in liquidations
2 - if there is a spike, does that contain any specific larger players being liquidated
rekt within the fpbs answers the 1st question
rekt bubbles answers the 2nd
questions I will ask myself upon any poi gets hit:
1 - is there a spike in liquidations
2 - if there is a spike, does that contain any specific larger players being liquidated
rekt within the fpbs answers the 1st question
rekt bubbles answers the 2nd
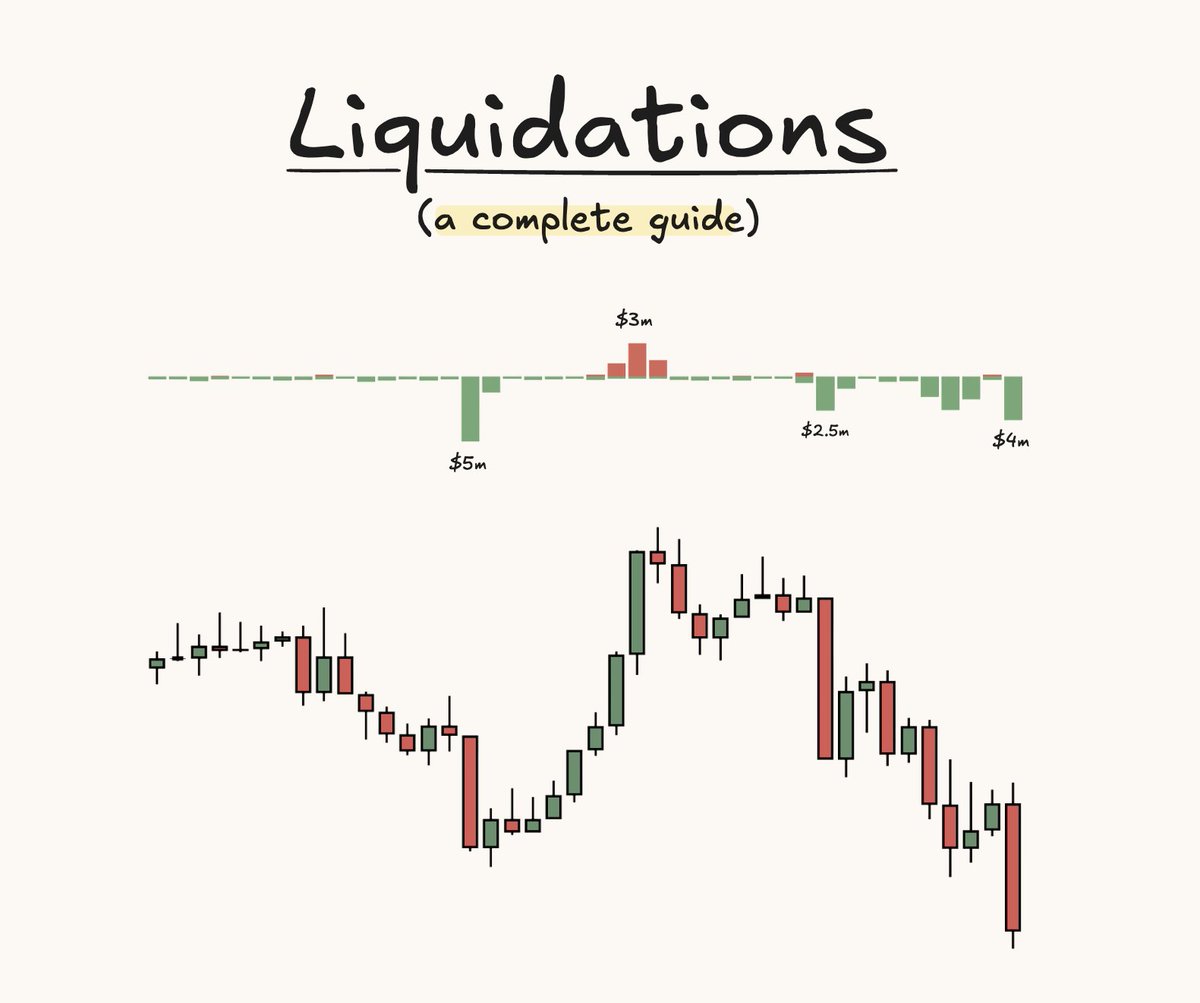
spike in liquidations
a spike - is simply generally something I look at relatively.
however as there is not liquidations every single candle, it is not as beneficial to look at this data and treat it strictly relative.
for me (using BTC/USDT) a candle with > 150k is a spike
a spike - is simply generally something I look at relatively.
however as there is not liquidations every single candle, it is not as beneficial to look at this data and treat it strictly relative.
for me (using BTC/USDT) a candle with > 150k is a spike

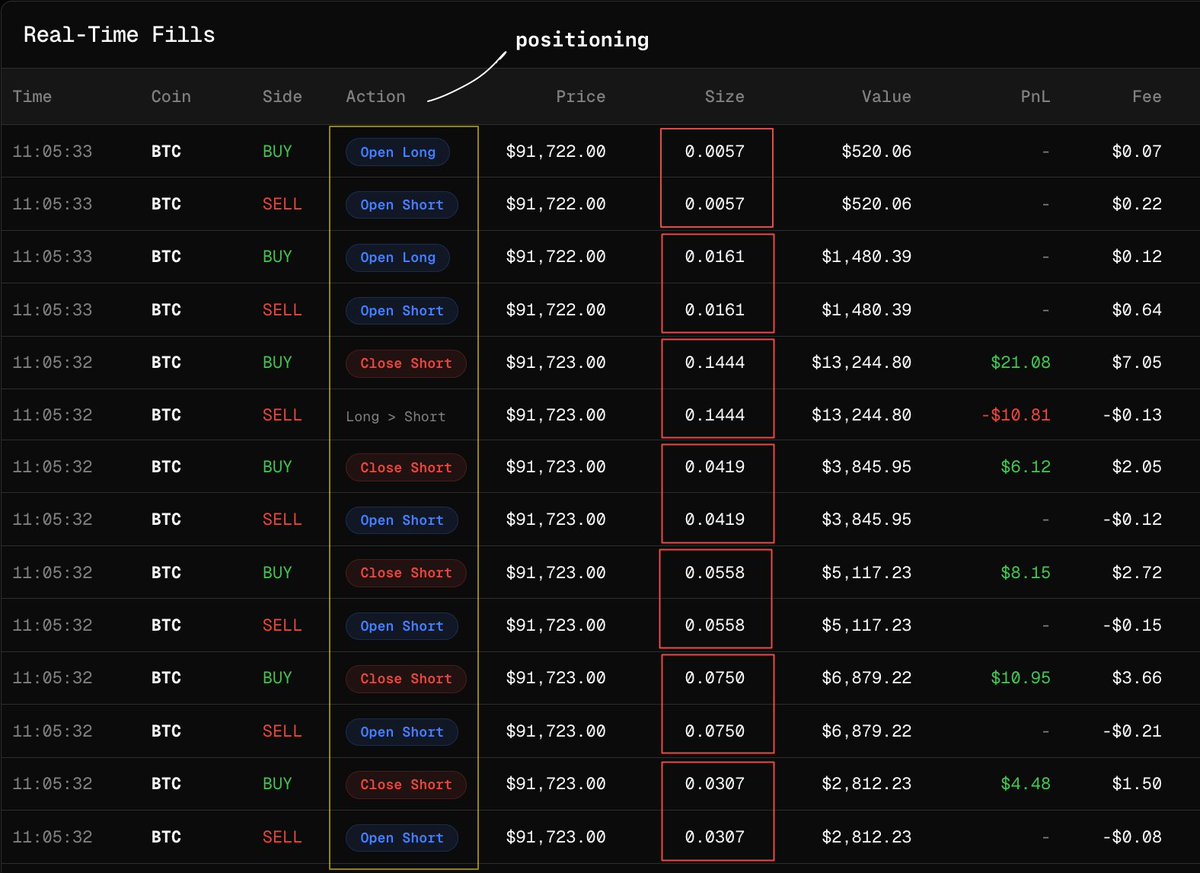
larger players being liquidated
why is this beneficial?
- from my own stats and testing on my own trades, if a trade has a tag that a "larger liquidation has occurred" ie - a bubble (which auto represents trades values which are more than 145k) have a positive ev on their own.
why is this beneficial?
- from my own stats and testing on my own trades, if a trade has a tag that a "larger liquidation has occurred" ie - a bubble (which auto represents trades values which are more than 145k) have a positive ev on their own.

grading
spike in liquidations + larger playing being liquidated within = A*
spike in liquidations on it's own = B+
this is just from my own testing, and is off the basis I'm taking out all other confluences of the trade I am taking.
spike in liquidations + larger playing being liquidated within = A*
spike in liquidations on it's own = B+
this is just from my own testing, and is off the basis I'm taking out all other confluences of the trade I am taking.
where I look for liquidations
- major swing points
- runs of multiple swing highs/lows
most incompetent people will be allowing themselves to get liquidated specifically upon a run of either one of the two above.
- major swing points
- runs of multiple swing highs/lows
most incompetent people will be allowing themselves to get liquidated specifically upon a run of either one of the two above.

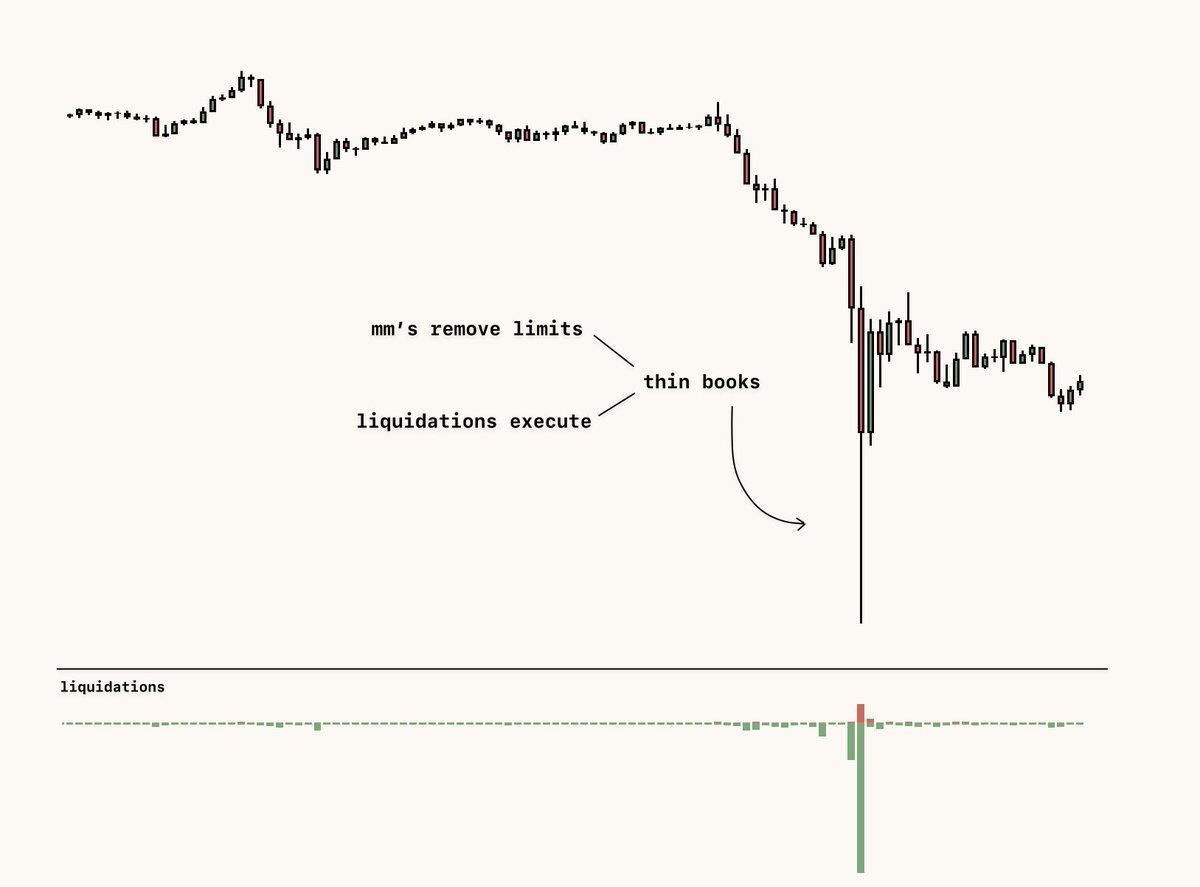
advanced
liquidations occur a lot within inefficiencies, as there is a large gap for price to run through with little to no s/r, allowing for large liquidation cascades.
looking for an inefficiency to be filled followed by a run of liquidity is a favourite of mine to trade.
liquidations occur a lot within inefficiencies, as there is a large gap for price to run through with little to no s/r, allowing for large liquidation cascades.
looking for an inefficiency to be filled followed by a run of liquidity is a favourite of mine to trade.

PS. If you found value would appreciate a like on the 1st post of this thread
Let me know below what you thought and some content you would like to see next
Let me know below what you thought and some content you would like to see next
• • •
Missing some Tweet in this thread? You can try to
force a refresh