Insilico Terminal
a thread 🧵
a thread 🧵

In this thread, I will cover the following:
- specific entry use cases using terminal
- hotkeys to enter at limit most of the time
- account switching
- cli commands I like to use
- my hotkeys at the end of thread
- specific entry use cases using terminal
- hotkeys to enter at limit most of the time
- account switching
- cli commands I like to use
- my hotkeys at the end of thread
my setup
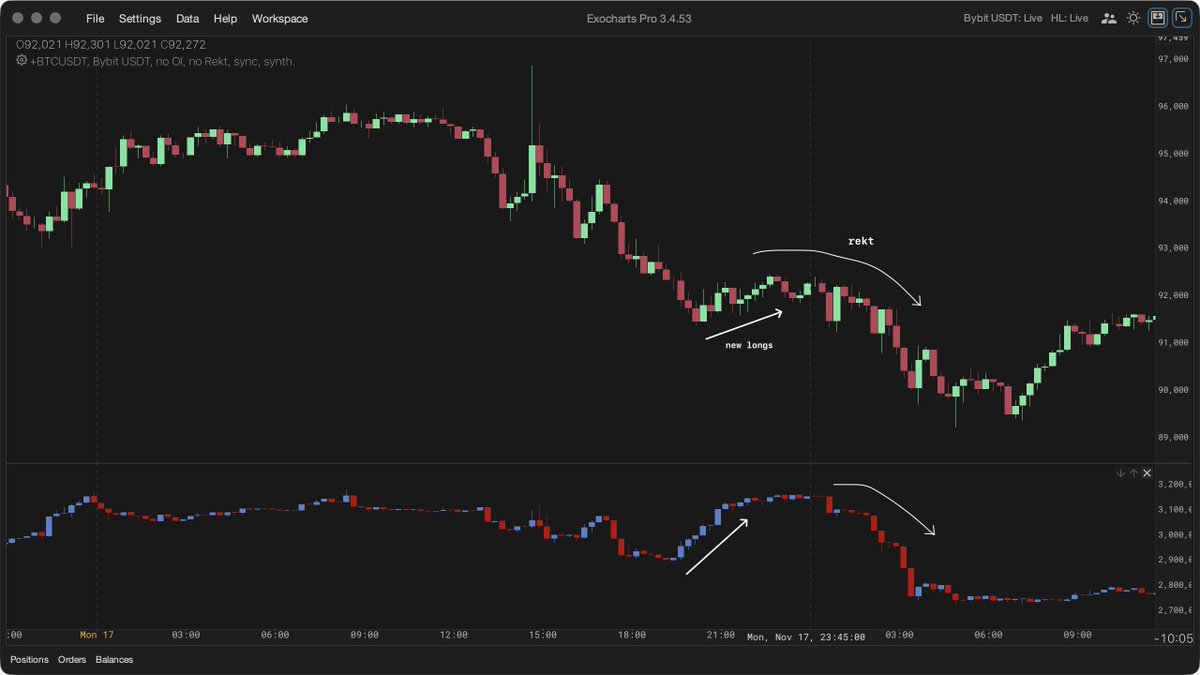
I use insilico alongside my exo desktop as a side panel for my execution.
Then once ive seen the reaction I may want to see within exo, I'm able to pull the trigger as quickly as possible using some optimisation with my Insilico setup and with the use of hotkeys
I use insilico alongside my exo desktop as a side panel for my execution.
Then once ive seen the reaction I may want to see within exo, I'm able to pull the trigger as quickly as possible using some optimisation with my Insilico setup and with the use of hotkeys

thoughts
seeing a reaction then being able to execute as if I was executing at market but instead being able to get in at limit was my aim.
sounds impossible, but with patience, hotkeys and stats I found it possible.
seeing a reaction then being able to execute as if I was executing at market but instead being able to get in at limit was my aim.
sounds impossible, but with patience, hotkeys and stats I found it possible.
hotkeys
- scale buy/sell within a small range (mine is 0.01%-0.08%) from current price and placing limits within that small range using a hotkey.
- chase buy/sell for a distance of X% to be able to get into a move that Is being pushed up/down aggressively by one side.
- scale buy/sell within a small range (mine is 0.01%-0.08%) from current price and placing limits within that small range using a hotkey.
- chase buy/sell for a distance of X% to be able to get into a move that Is being pushed up/down aggressively by one side.

MAE
For the past 380+ trades, my MAE on my winners has always been at the minimum of 0.1% meaning I never truly time the $ high or low.
It makes sense to take advantage of entering at limit using the scale function with a hotkey since I'm always offside at some point by 0.1%.
For the past 380+ trades, my MAE on my winners has always been at the minimum of 0.1% meaning I never truly time the $ high or low.
It makes sense to take advantage of entering at limit using the scale function with a hotkey since I'm always offside at some point by 0.1%.
hotkeys (2)
- chase cancel (cancels my chase order if left running)
- cancel all orders
These are just a few but within my system, they are the most important that I am using most frequently.
- chase cancel (cancels my chase order if left running)
- cancel all orders
These are just a few but within my system, they are the most important that I am using most frequently.
CLI commands I like
"pstop at (price or % away from price)" positions links a stop in place to place a stop loss for your current position.
"chase close (% of position)" closes a % of my current position quickly If I feel it's likely for price to turn around
"pstop at (price or % away from price)" positions links a stop in place to place a stop loss for your current position.
"chase close (% of position)" closes a % of my current position quickly If I feel it's likely for price to turn around

DOM
I've also configured some hotkeys to be able to trade via the DOM within Insilico.
the lots function with the multiplier in my opinion allows for more accurate and quicker position sizing if needed.
I've also configured some hotkeys to be able to trade via the DOM within Insilico.
the lots function with the multiplier in my opinion allows for more accurate and quicker position sizing if needed.

account switching
switching hotkeys between accounts, for quick access to a multi-account layout.
simply shift+click anywhere within the header section for the panel with the account to enable your hotkeys for that account
switching hotkeys between accounts, for quick access to a multi-account layout.
simply shift+click anywhere within the header section for the panel with the account to enable your hotkeys for that account

Using the hotkeys I've discussed
head over to the menu bar to visit the hotkey and variable center where you can edit the default settings I have set for you.
to RECEIVE the keybinds - follow me, like and reply to the 1st post of this thread.
head over to the menu bar to visit the hotkey and variable center where you can edit the default settings I have set for you.
to RECEIVE the keybinds - follow me, like and reply to the 1st post of this thread.

• • •
Missing some Tweet in this thread? You can try to
force a refresh