How to analyze a Balance Sheet in less than 2 minutes: 

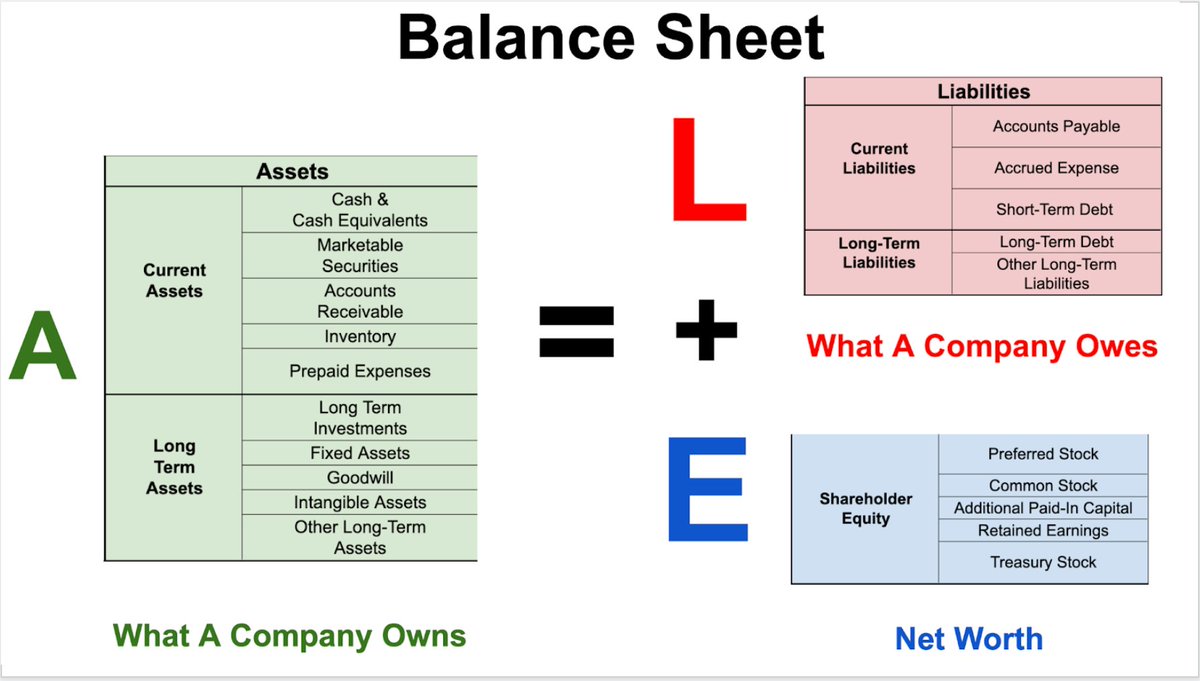
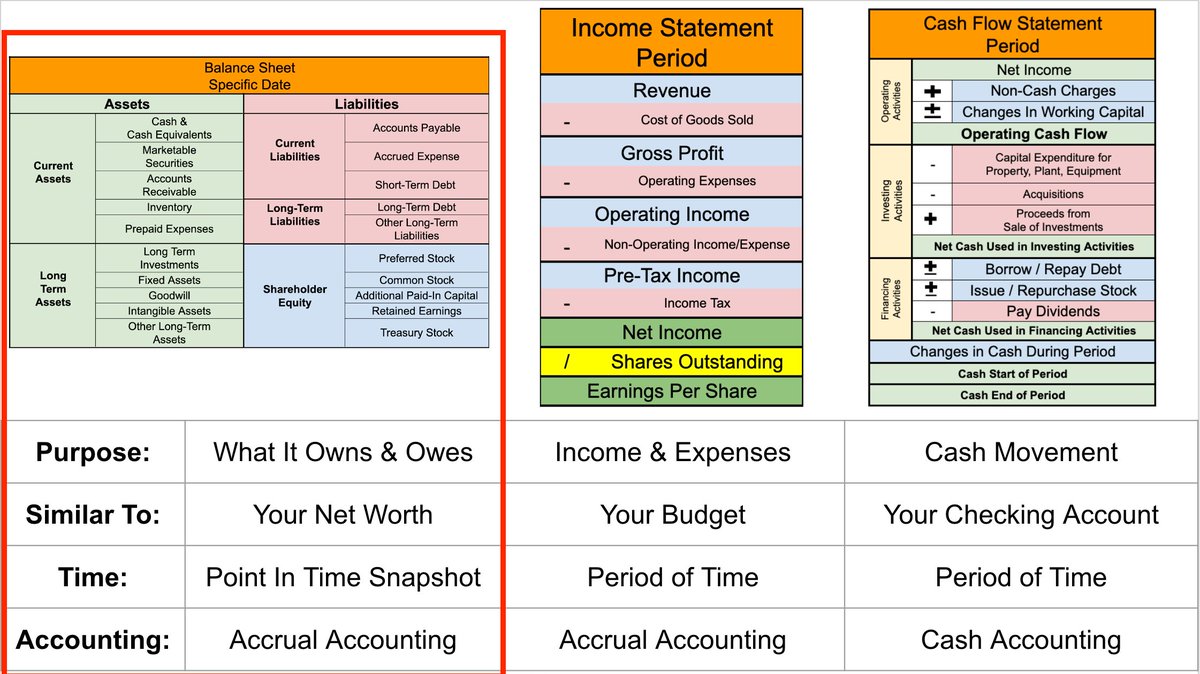
The balance sheet is one of the three major financial statements.
It shows a company’s:
▪️Assets: What it owns
▪️Liabilities: What it owes
▪️Shareholders Equity: It's net worth
At a fixed point in time
It shows a company’s:
▪️Assets: What it owns
▪️Liabilities: What it owes
▪️Shareholders Equity: It's net worth
At a fixed point in time
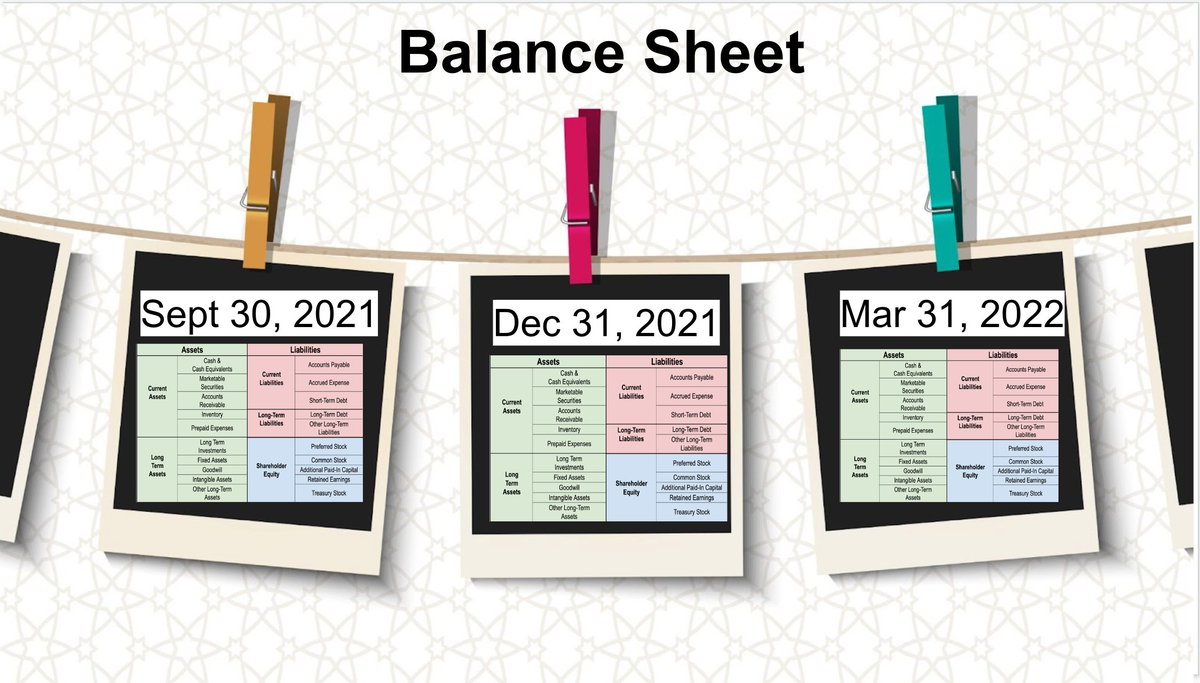
That “at a point in time” part is key!
A balance sheet is a SNAPSHOT of a company’s net worth.
It is measured at the end of a quarter/year.
A balance sheet is a SNAPSHOT of a company’s net worth.
It is measured at the end of a quarter/year.
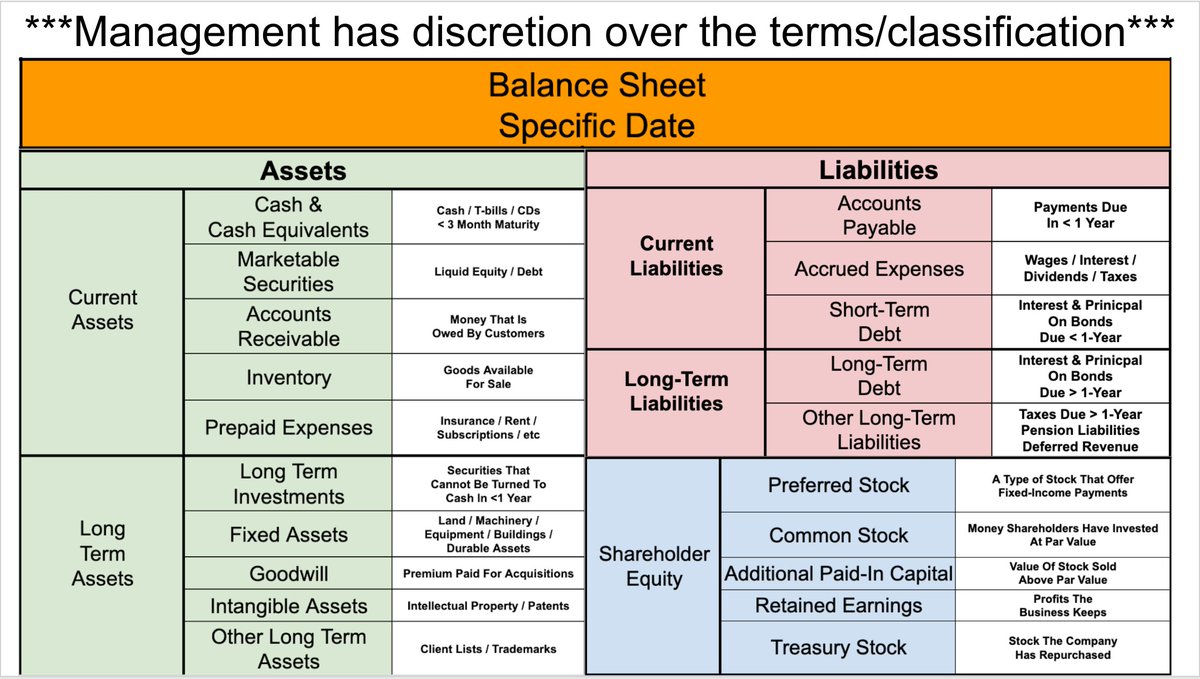
Management teams have leeway in categorizing their balance sheet.
This means that not all balance sheets look the same.
Here are some of the most commonly used terms and what they mean:
This means that not all balance sheets look the same.
Here are some of the most commonly used terms and what they mean:
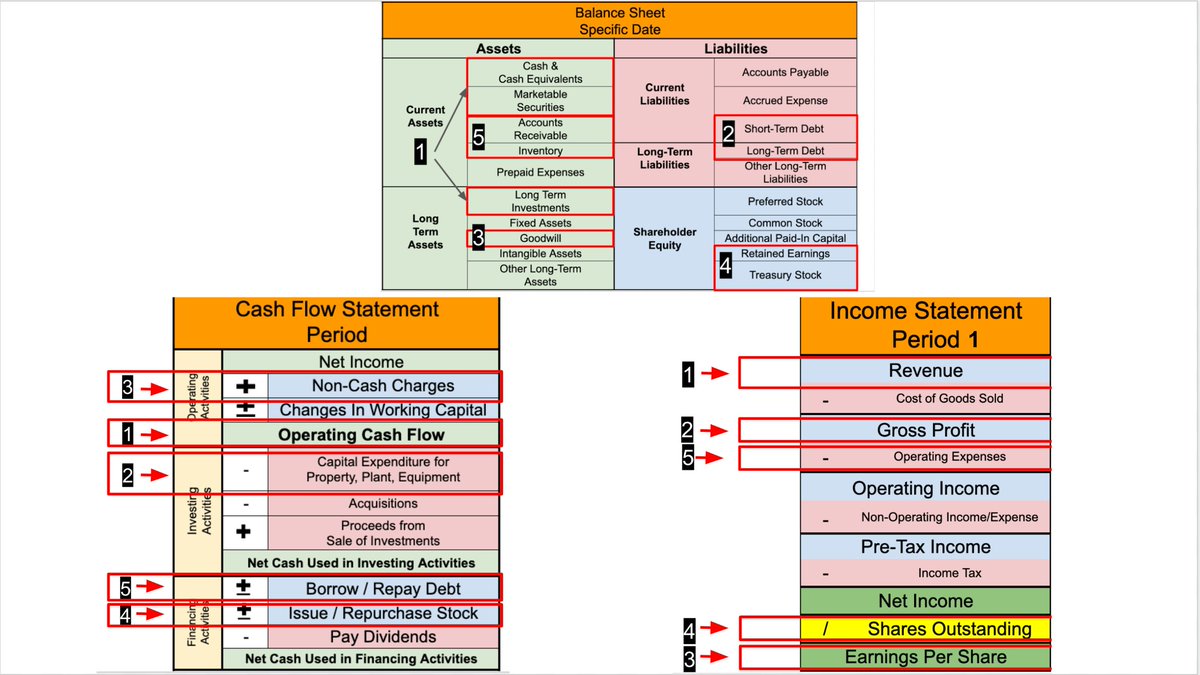
What I focus on first:
1: Cash & Equivalents: How much?
2: Debt: How much? What kind?
3: Goodwill: How much?
4: Retained Earnings (+ T.S.): Positive?
5: Receivables & Inventory: How much?
1: Cash & Equivalents: How much?
2: Debt: How much? What kind?
3: Goodwill: How much?
4: Retained Earnings (+ T.S.): Positive?
5: Receivables & Inventory: How much?
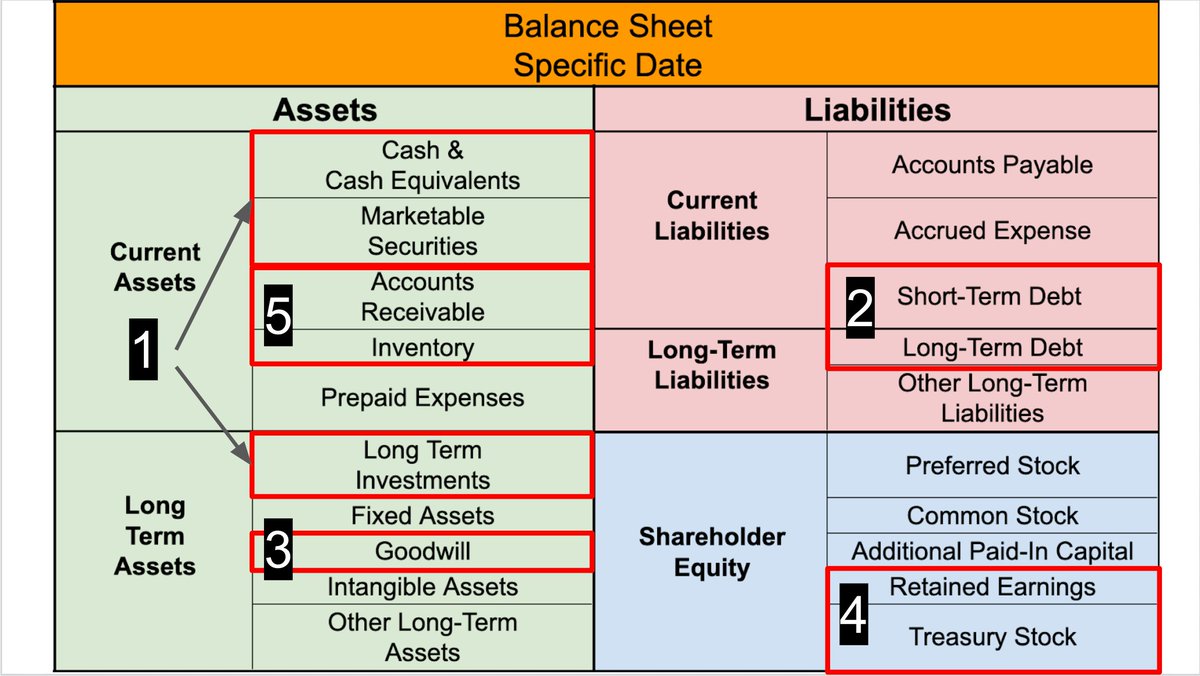
Best Possible Answers
▪️Cash & Equivalents: Millions / Billions (depends on company size)
▪️Debt: None
▪️Goodwill: None
▪️Retained Earnings (+ T.S.): Positive
▪️Receivables & Inventory: None
▪️Cash & Equivalents: Millions / Billions (depends on company size)
▪️Debt: None
▪️Goodwill: None
▪️Retained Earnings (+ T.S.): Positive
▪️Receivables & Inventory: None
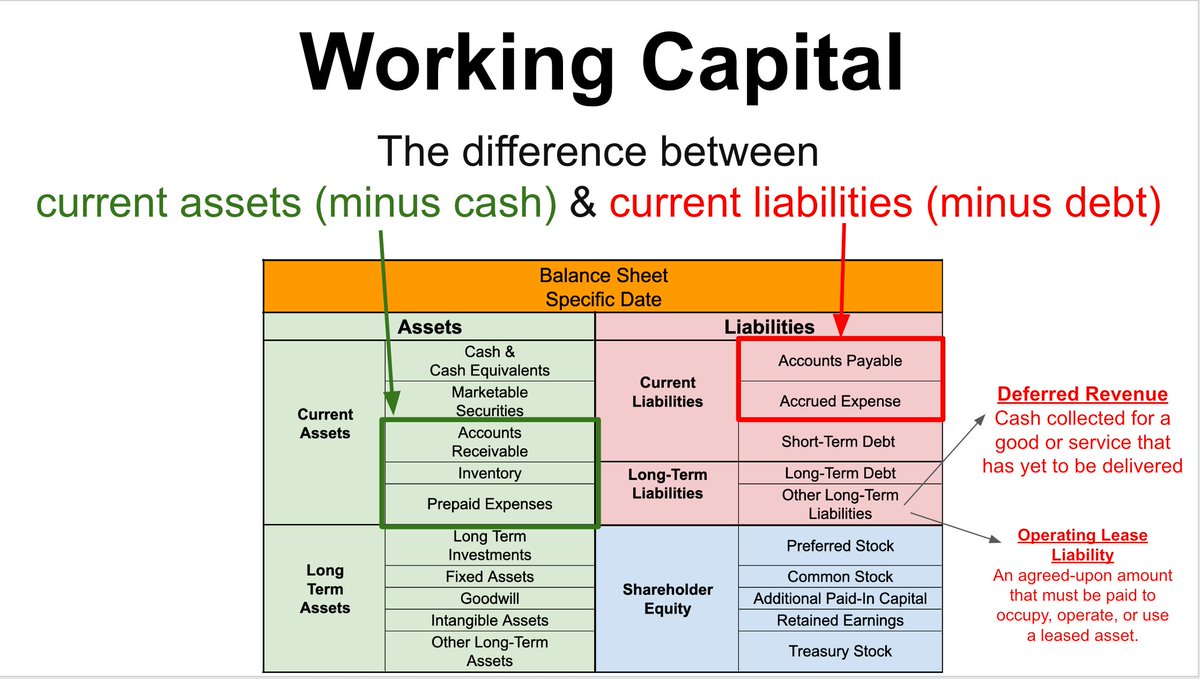
Other areas to quickly glance at:
▪️Working Capital (ideally negative)
▪️Operating Lease Liabilities (ignore)
▪️Deferred Revenue (hopefully has some)
▪️Working Capital (ideally negative)
▪️Operating Lease Liabilities (ignore)
▪️Deferred Revenue (hopefully has some)
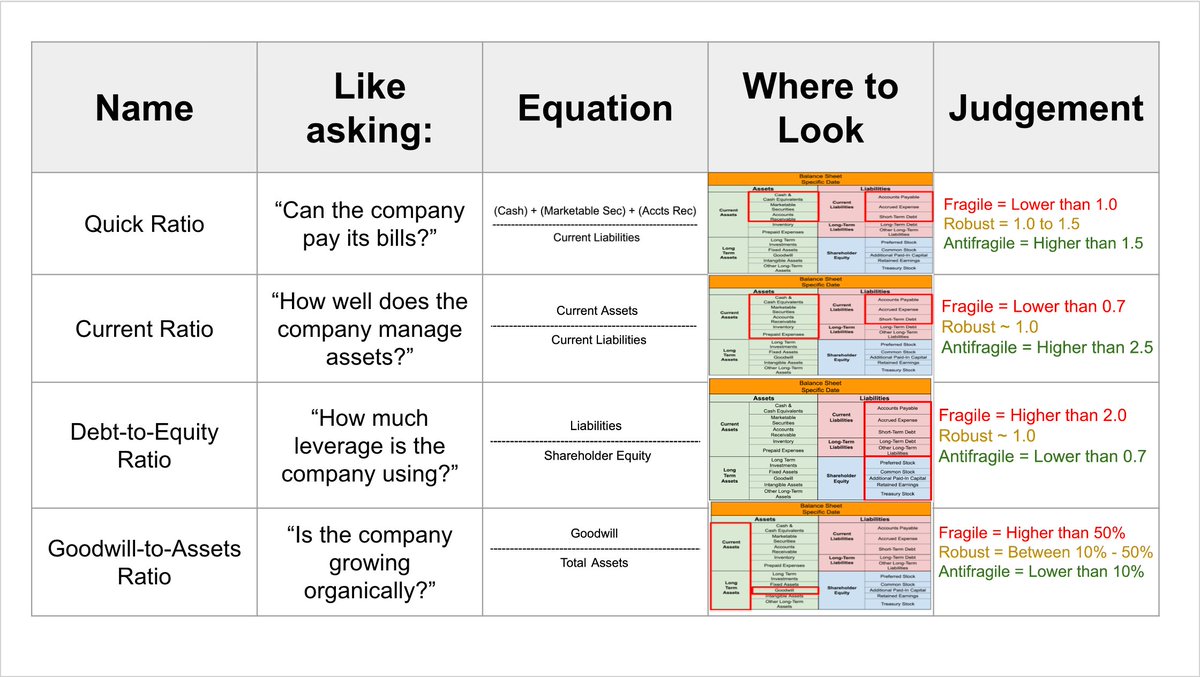
It's also helpful to look at a few simple balance sheet ratios:
(These are calculated for you on many free websites)
(These are calculated for you on many free websites)
I’d never invest without MUCH more analysis than this.
Accounting (and investing) is FILLED with nuance.
Still, with less than 2 minutes of analysis, you can quickly identify whether a company's balance sheet is strong, average, or troublesome.
Accounting (and investing) is FILLED with nuance.
Still, with less than 2 minutes of analysis, you can quickly identify whether a company's balance sheet is strong, average, or troublesome.
Learning to analyze financial statements is an incredibly useful skill.
Want to learn how Warren Buffett does it?
Join me on 9/14 for a FREE webinar.
RSVP here: lu.ma/BuffettRules
Want to learn how Warren Buffett does it?
Join me on 9/14 for a FREE webinar.
RSVP here: lu.ma/BuffettRules

Enjoy this thread?
Follow me @BrianFeroldi for more content like this.
I demystify finance with 1-2 threads each week.
Want to share with your audience? Retweet ♻️ the first tweet below:
Follow me @BrianFeroldi for more content like this.
I demystify finance with 1-2 threads each week.
Want to share with your audience? Retweet ♻️ the first tweet below:
https://twitter.com/61558281/status/1699396264687747255
• • •
Missing some Tweet in this thread? You can try to
force a refresh