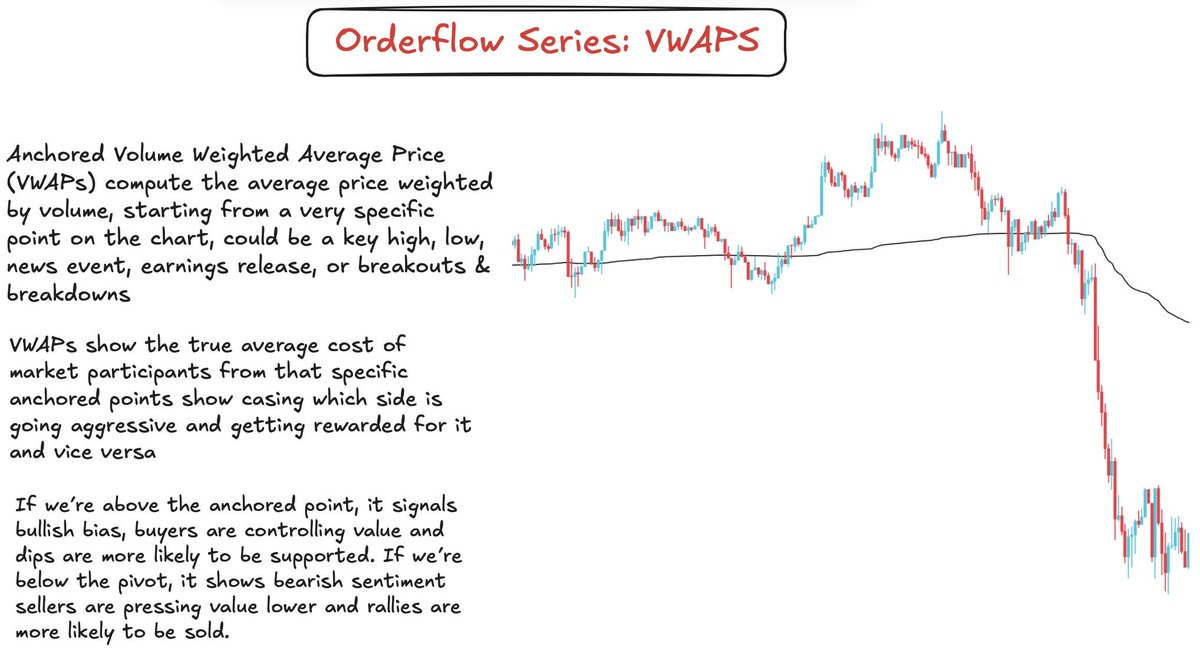
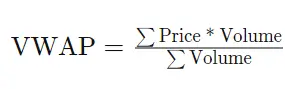
VWAP is basically made by multiplying each trade's price by its volume, adding all this together, and then dividing by the total number of coins traded.
Traders use VWAP to see if a coin is trending up or down.
Below VWAP -> Cheap
Above VWAP ->Expensive
On LTF.
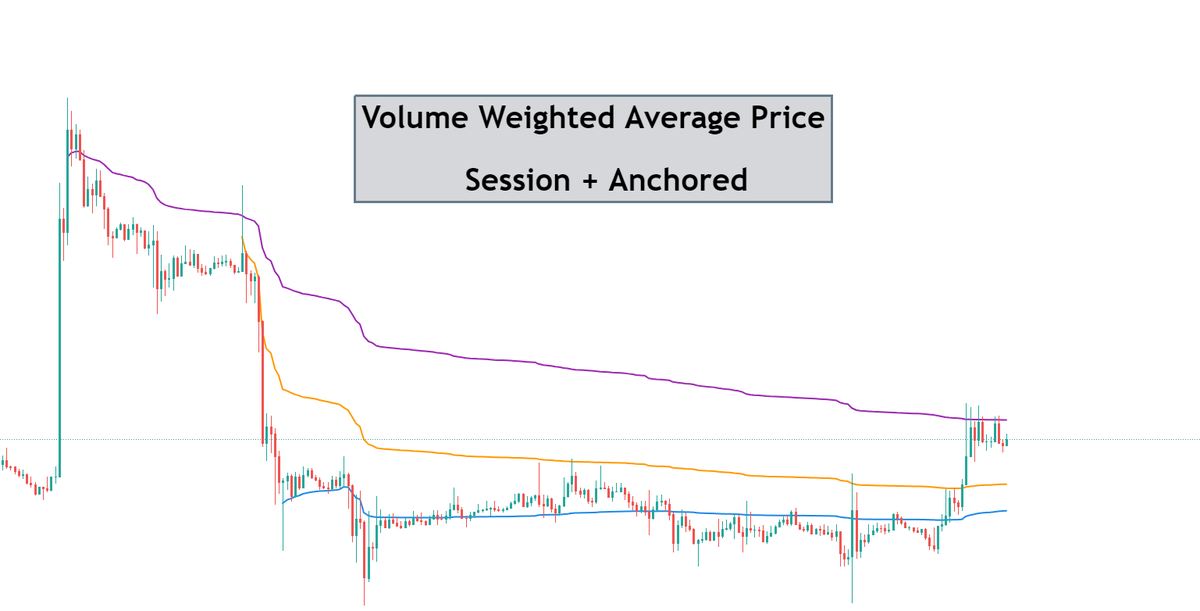
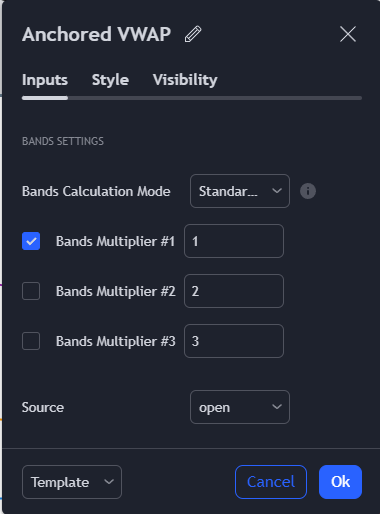
I will show both session VWAP and Anchored VWAP (AVWAP).
but we use the latter the most often and these are my default settings:
When anchoring to a high, use 'high'. When anchoring to a low, use 'low'.
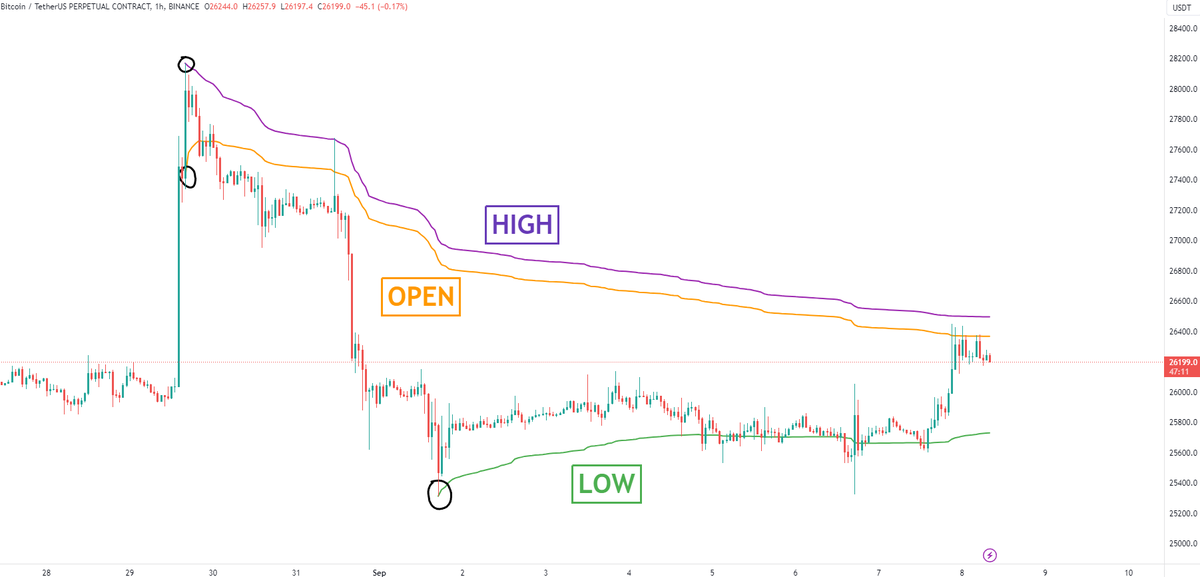
Here is a recent Bitcoin chart showing how you can anchor AVWAP to the high/low as well as open simultaneously. Read it well Chads.
You can consider entering somewhere between the 2 VWAPs.
I use it as an entry tool.
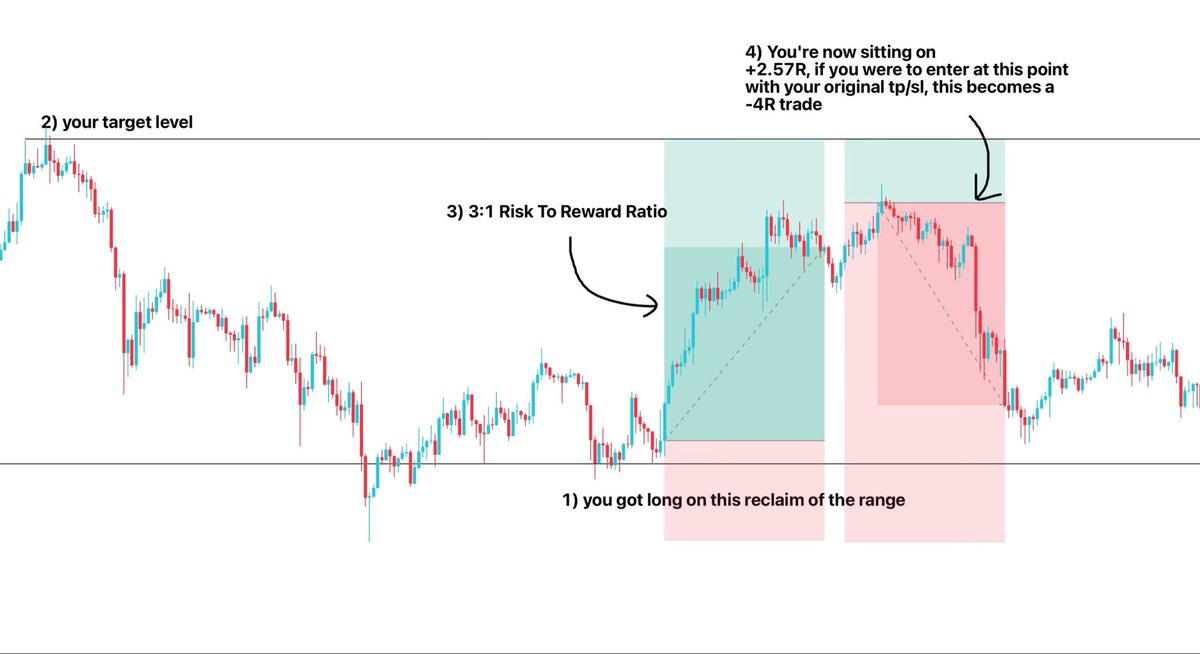
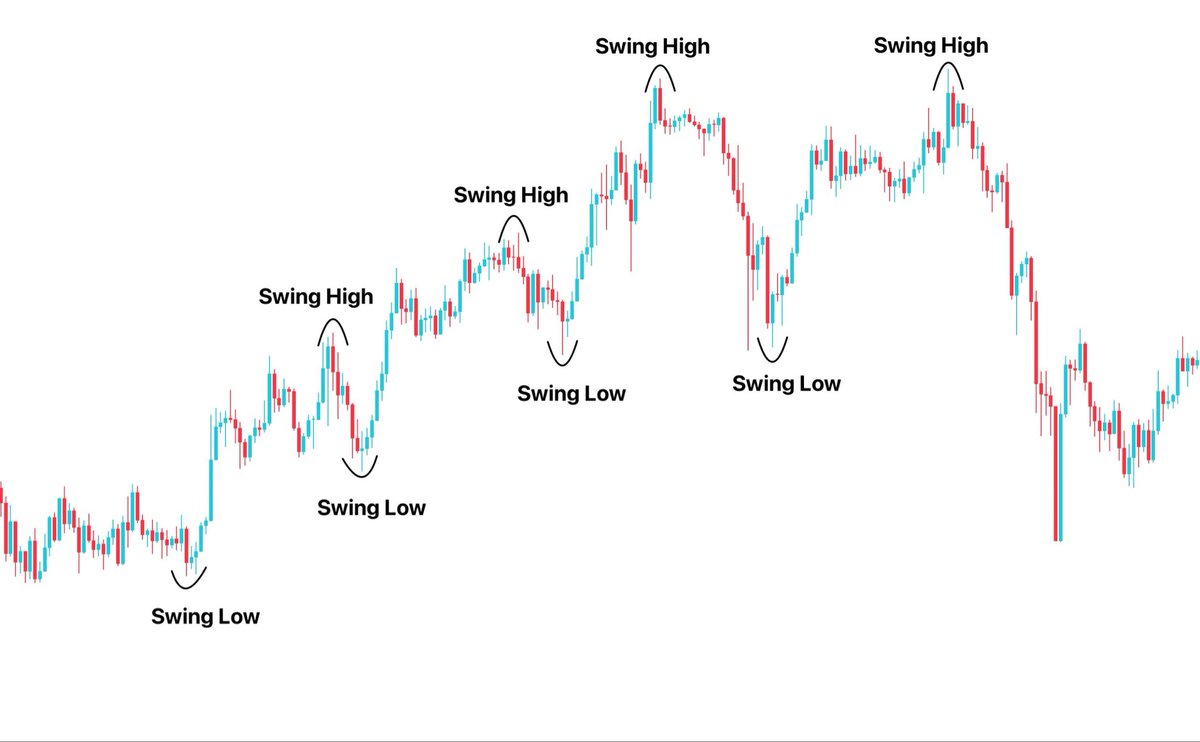
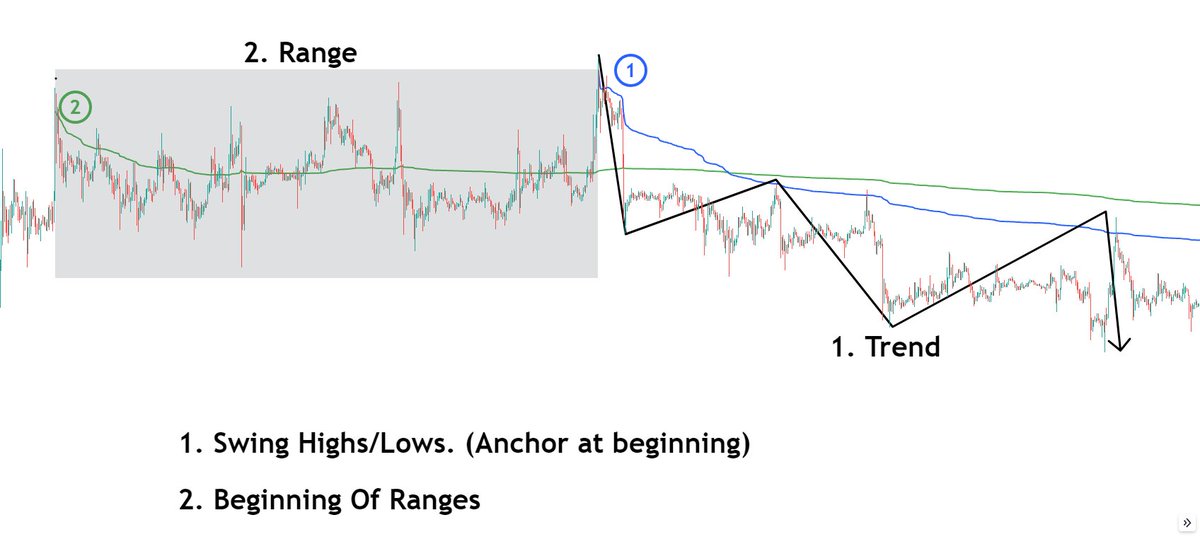
There are two places where I anchor the VWAP:
1. Swing Highs/Lows. (Anchor at beginning)
2. Beginning Of Ranges
Now let's jump into how I take trades in both scenarios:
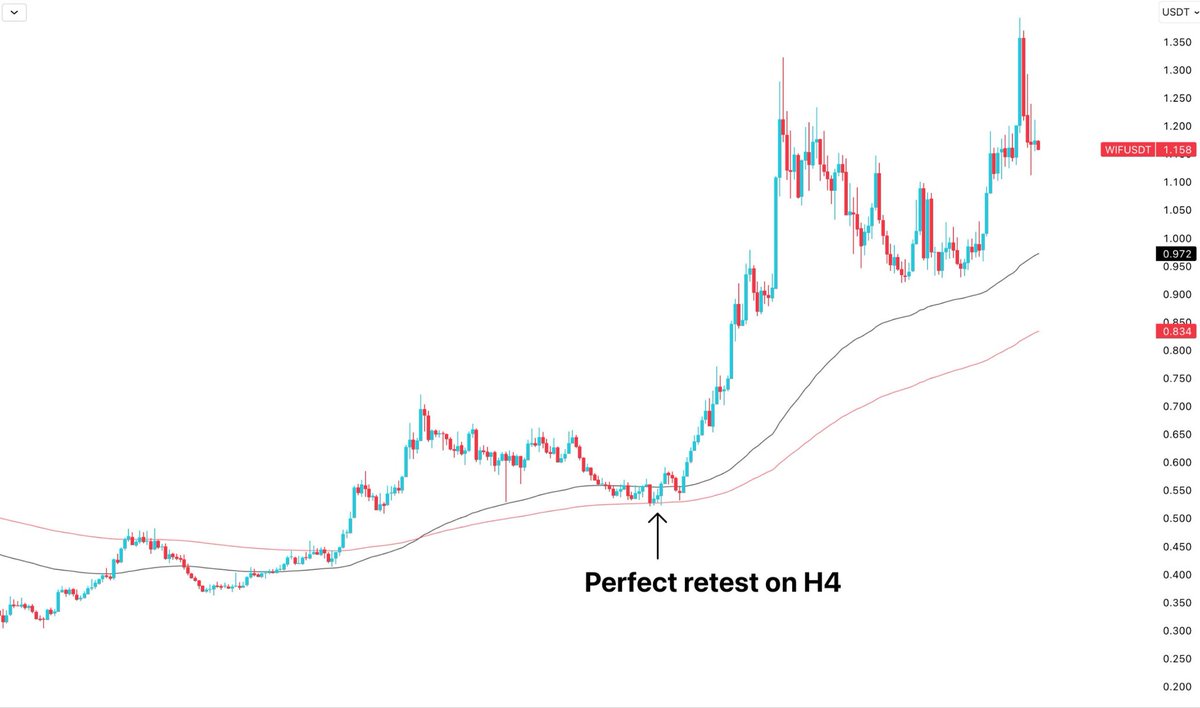
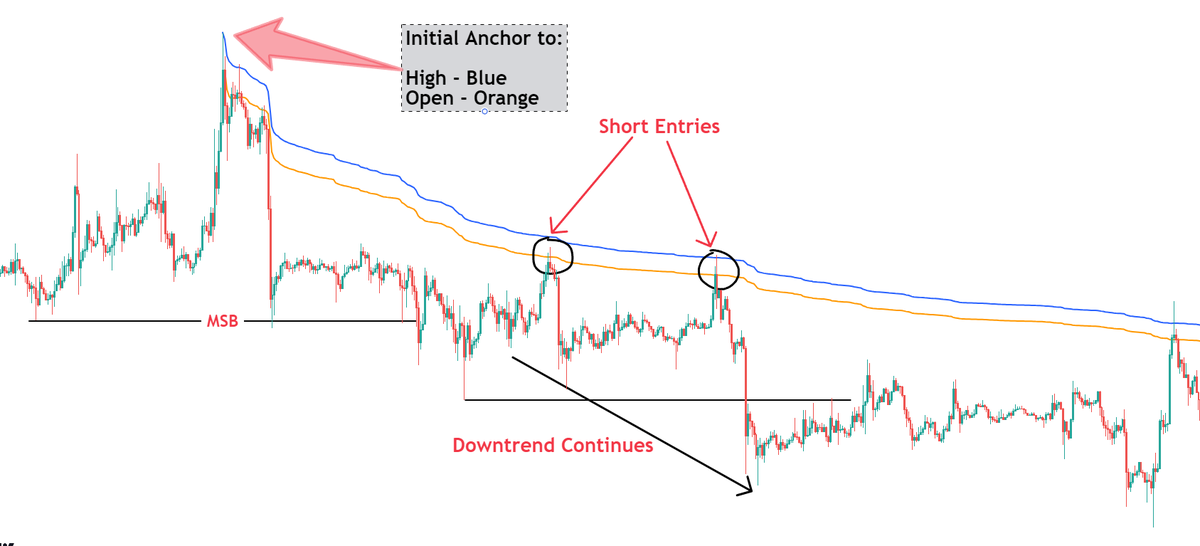
1. Trend Following Trade
NOTE: The more immediate and violent the reaction, the better.
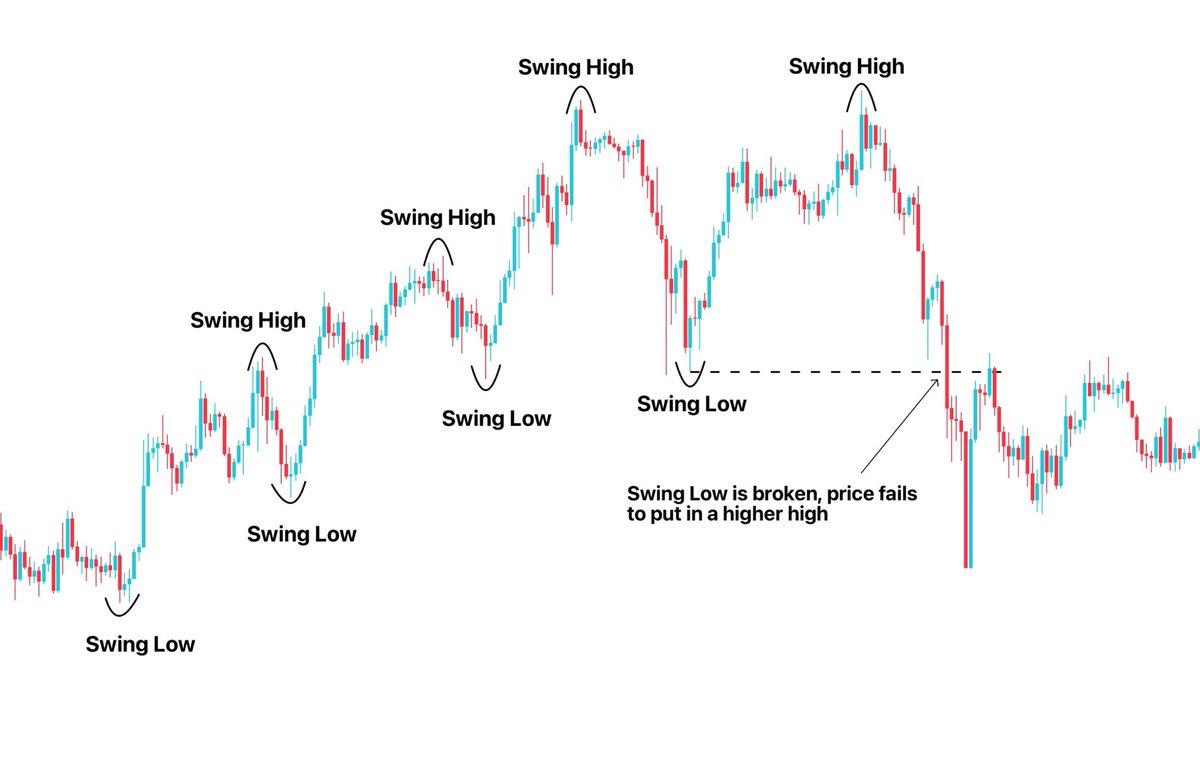
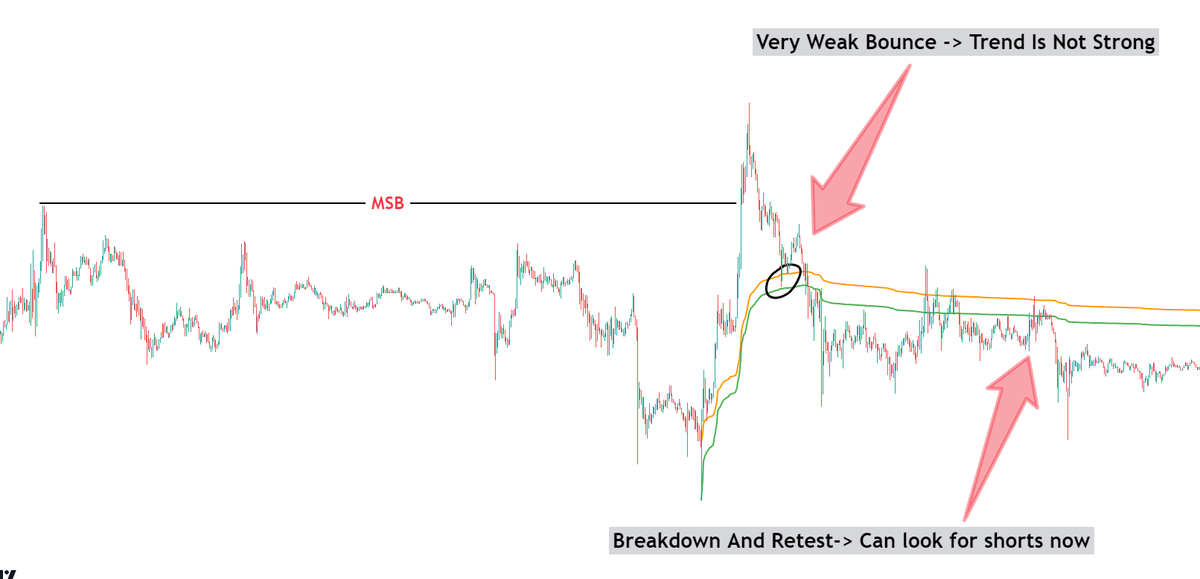
2. Trend Failure
This is a more nuanced setup where more confluence is needed. I mostly scalp trade the range on 1m TF when this happens
NOTE: If price immediately tests VWAP after first high/low, that is a bad sign.
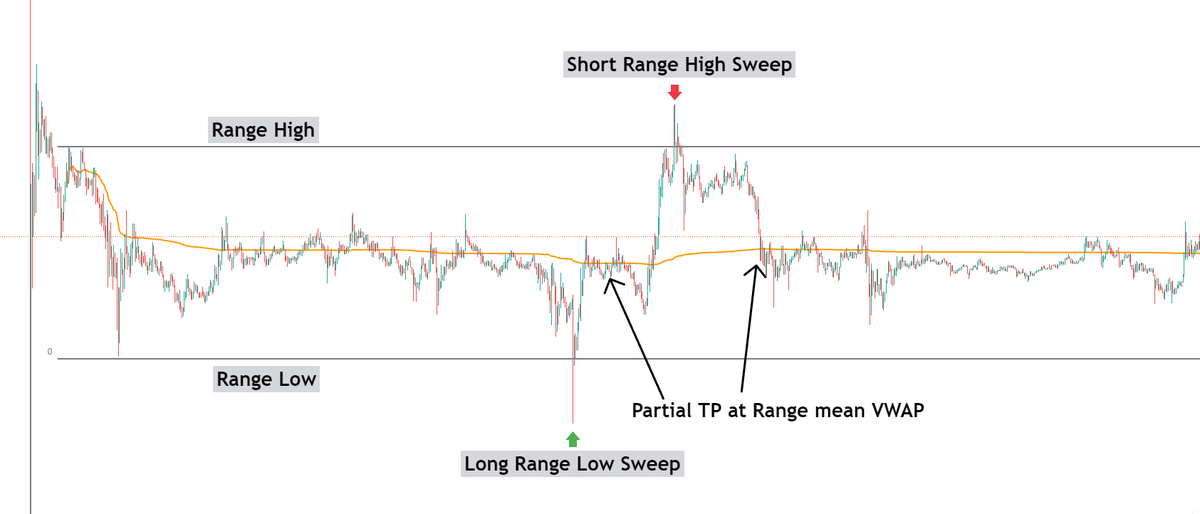
3. VWAP as range mean.
Here we mostly use it on "open" setting.
It is a point of interest in terms of target, also for entries (sometimes)
NOTE: Not the best way to use VWAP.
So this ia the trick I use for VWAP to make intraday trades. You can use it Chads and tell me how it works for you.
Follow me @BullyDCrypto for more tricks each day.
• • •
Missing some Tweet in this thread? You can try to
force a refresh
One of the most overlooked and misunderstood orderflow indicator out there. Personally VWAP is the base of my trading model and something I use every trading day.
This is a detailed guide on how to trade using VWAPs
1) Intraday VWAPs
You can use VWAPs to build bias for the day, where a particular market session is going to trend and how to effectively position yourself.
- Rounded bottom structure forms
- Reclaim of EMA200 for H4 or D1, please check what works best for the asset you’re looking at
- Reclaim of EMA200 with volume is usually a sign that we can gap up to EMA100 fairly quickly
Open Interest (OI) represents the total value of open positions on a specific contract. In simple terms, if the OI on btc perps is $1 billion, it means there’s $1 billion worth of long and short positions currently active on that contract.
Every time a new position is opened, it involves a Maker and a Taker, always a 1:1 relationship. In other words, two parties are needed to complete a trade, one who places the order (maker) and one who takes it (taker). For instance, if we decide to market buy one BTC perpetual contract as the taker, the OI for that contract will increase by the value of 1 BTC.
How to Read OI
When the price rises and OI increases, it means new long positions are being opened at market.
When the price rises and OI decreases, shorts are closing their positions at market.
When the price falls and OI increases, new short positions are being opened at market.
When the price falls and OI decreases, long positions are being closed.
The larger the timeframe you use, the less precise this data becomes. Lower timeframes are the most reliable for this.
Time-Based vs Non Time Based Charts
Most data is traditionally organised by time, alternative chart types offer clearer insights.
Popular alternatives are, Range/Volume, Tick, and pure Volume charts.
Lower timeframes tend to provide more precise, real time data.
As you move to higher timeframes, data becomes more averaged and details get lost. On higher timeframes, metrics like Open Interest can lose practical meaning as they become too broad and theoretical.
This Concept popularised by Trader Dante refers to:
- Dynamic nature of the risk to reward ratio (R) as a trade progresses
- Trade EV gradually changing, not worth price but also with time
- JUST AVOID ROUND-TRIPPING
Evolving R refers to the dynamic nature of the risk to reward ratio (R) as a trade progresses. Initially, traders set a fixed R based on their entry, stop loss, and target levels
However, once the trade is active, the potential reward and risk fluctuate with price movements
At trade entry:
You set your stop loss (risk)
You set your target (reward)
Your initial risk to reward ratio (R) is fixed on paper.
In this case risking 3% for 9% target, which equates to 3R
But once the trade moves into your direction, the potential (R) shifts, you're now risking your unrealised gains as well
Let’s say your trade moves halfway to target.
In this case your unrealised profit is now +2.57R
If you don’t trail your stop, you’re now risking your unrealised 2.57R to make additional 0.43R and if you were to enter at this point with your original take profit and stop loss, this would be a negative 4R trade
So ask yourself, if you would open a new position at this point, with the same Tp/Sl, if not?
Time to trail your stops
Your live R isn’t what you set initially.
It’s evolving in real time as the trade progresses
Understanding The market trend + trend reversal is key for any trading idea being formed
Here’s my structured approach for it: 🧵
You can view the market from two different lens:
1. Market moves in a “range-impulse-range” framework 2. Market Moves in Trends and alternates (will use this framework to keep this simple and will cover the nuances later)
NOTE: My assumption to structure this properly is - A trend remains in effect until there is clear evidence of reversal
Trends Have Three Phases:
1. The accumulation phase (books are typically thick here)