
Full time Bitcoin trader. Part time Shit poster.
Free TG - https://t.co/92VKYXYOn1
Youtube: https://t.co/993E63YH8W
8 subscribers
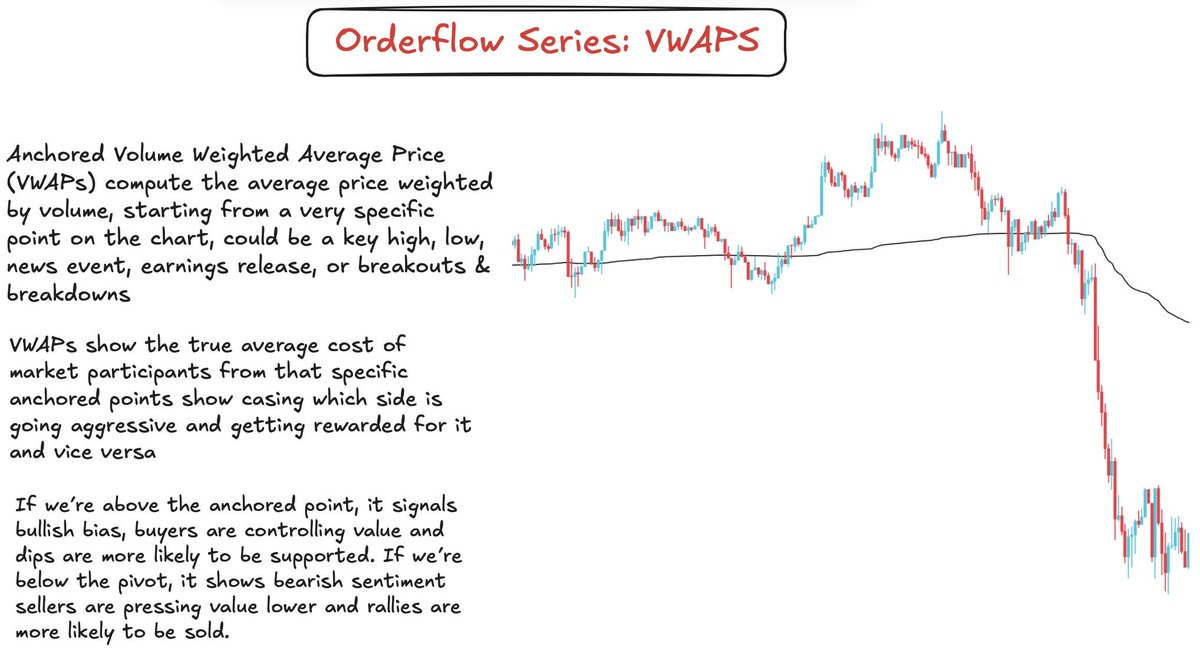 1) Intraday VWAPs
  Normal trend-based bias forming:
 How to Read OI
 Evolving R refers to the dynamic nature of the risk to reward ratio (R) as a trade progresses. Initially, traders set a fixed R based on their entry, stop loss, and target levels
 You can view the market from two different lens:
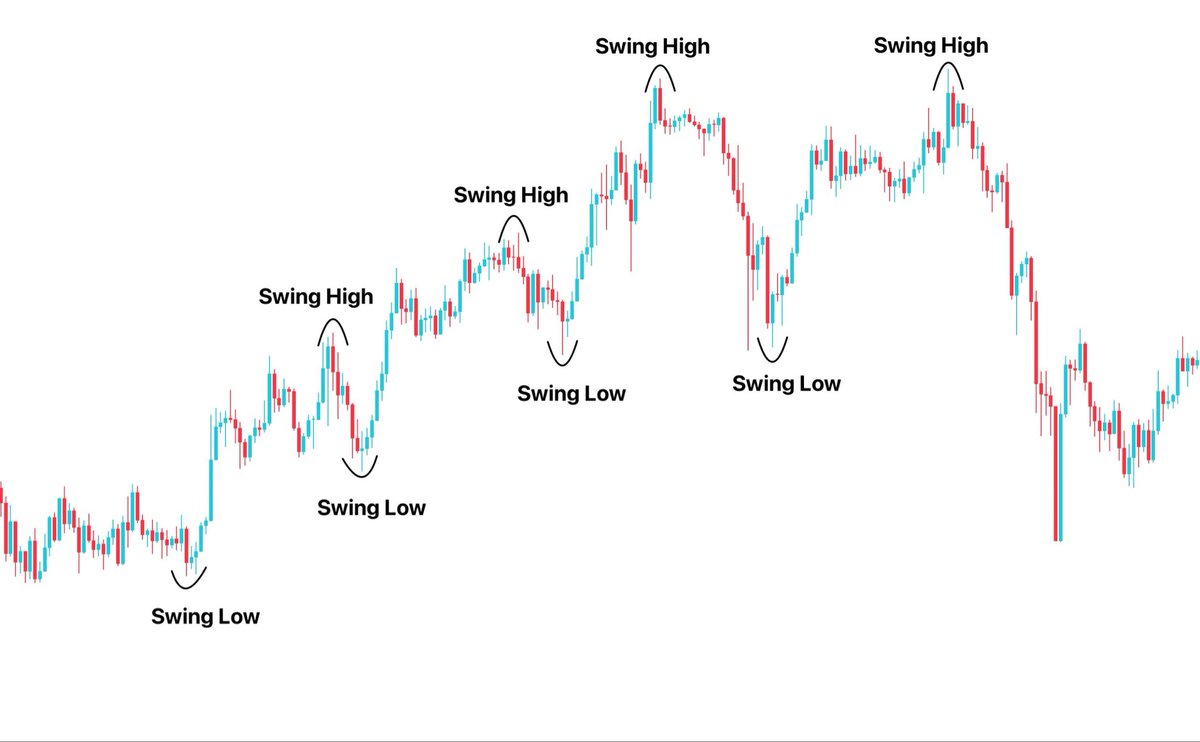
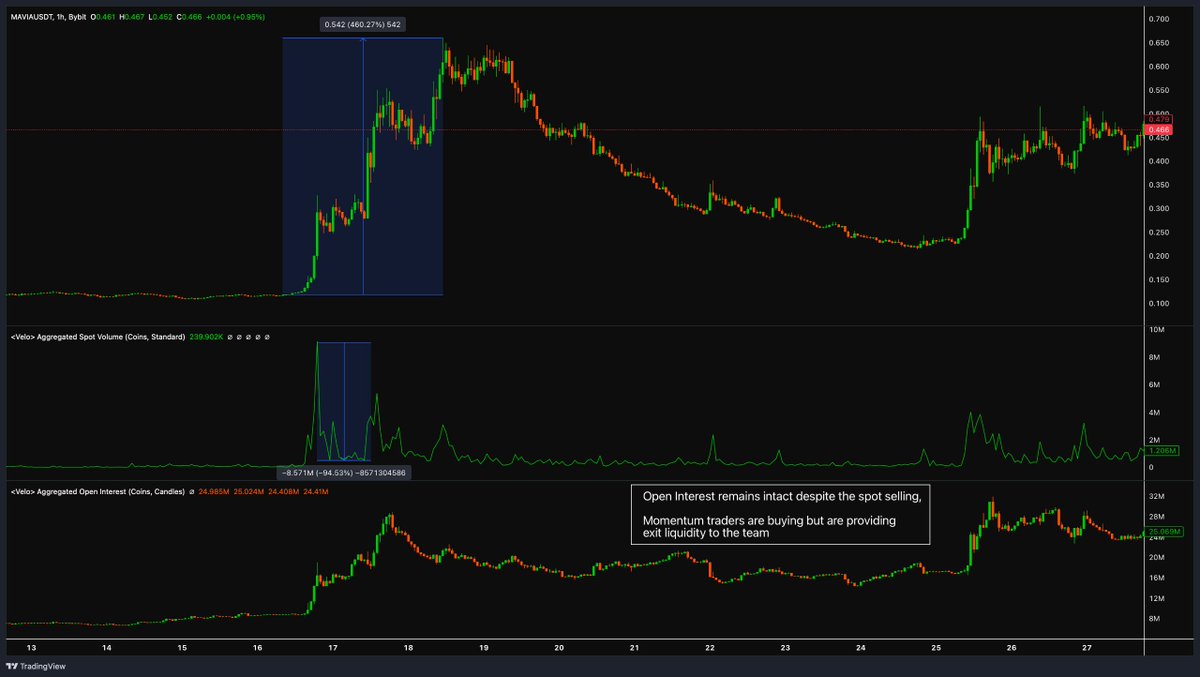 $MAVIA


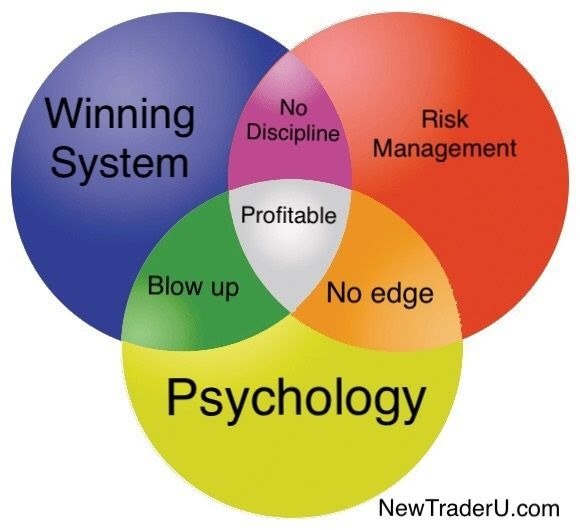
 1. Risk Management
 Exploiting Naked Points of Control (NPOCs), areas where liquidity is left unfilled. By identifying these levels, you can capitalize on price’s natural tendency to revisit them. This strategy offers precise entries, targeting areas where the market is most likely to react, providing a powerful edge for intraday trading setups.
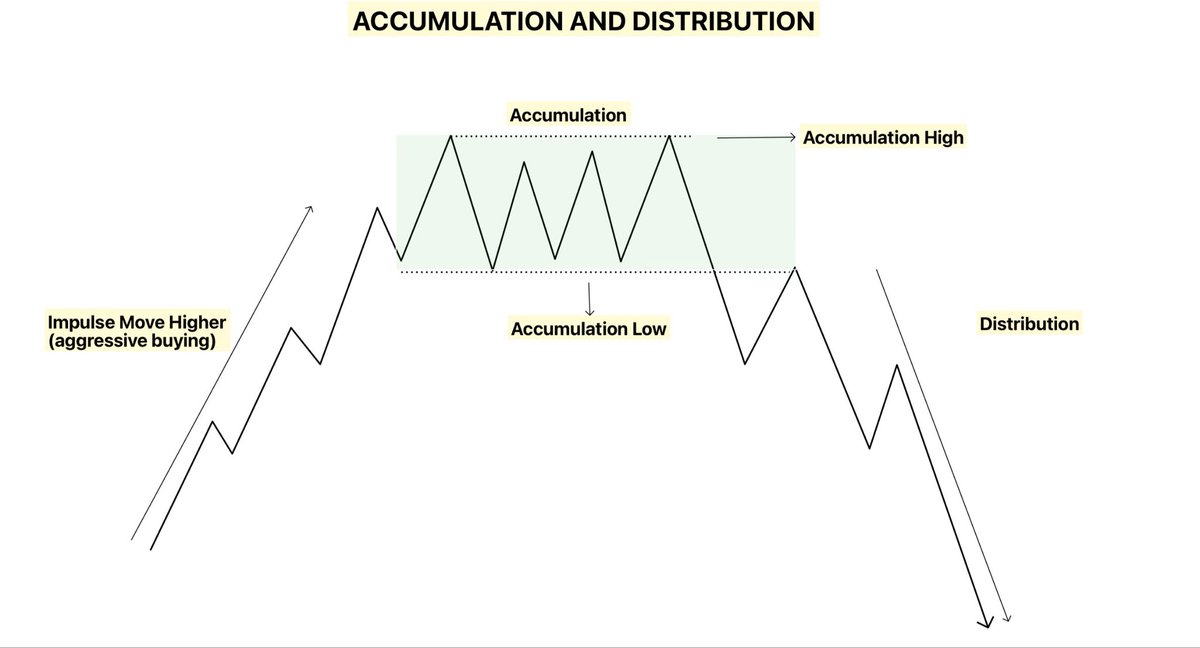
 Understanding Context Of Market Environment:
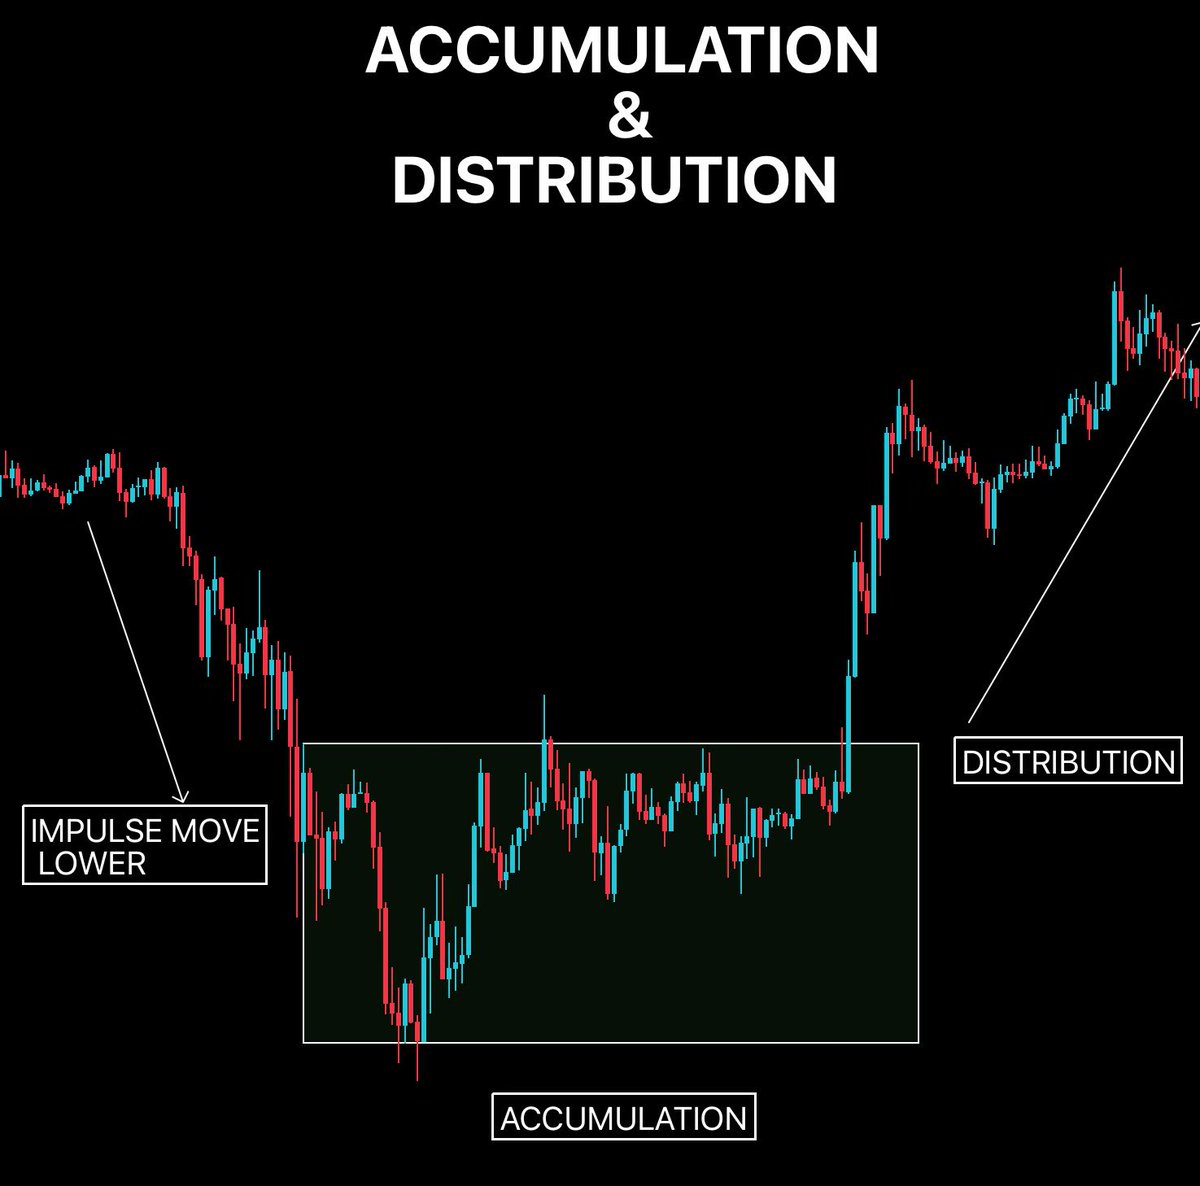 Why does Accumulation & Distribution Work in Trading
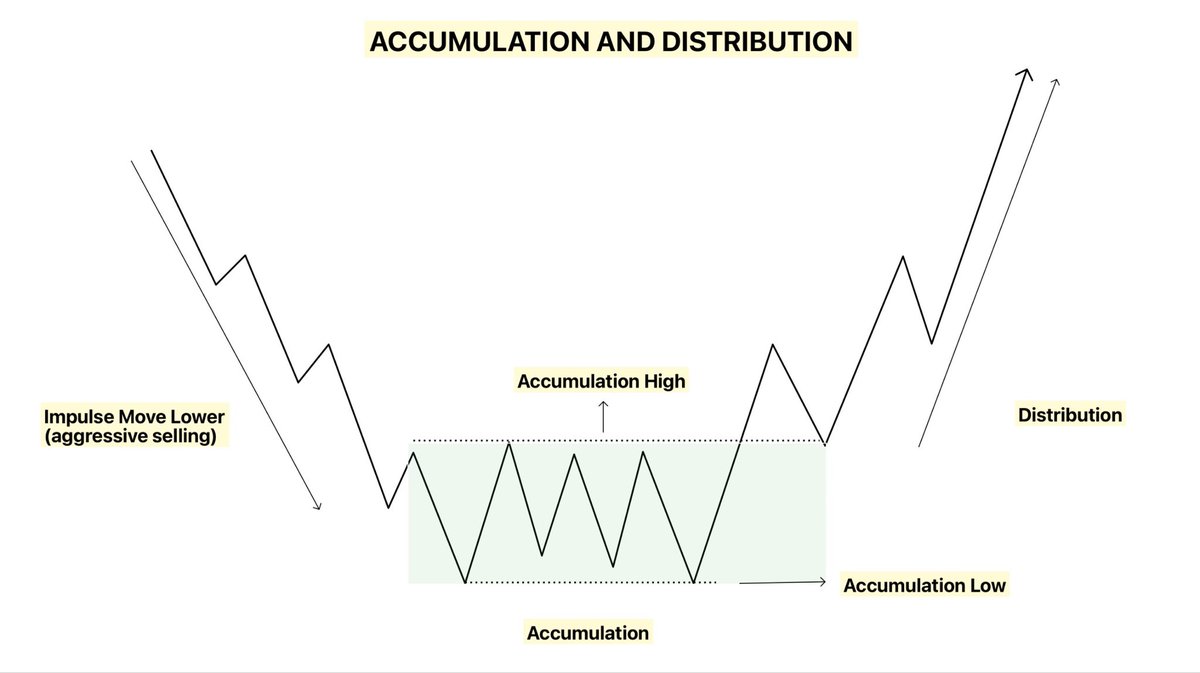
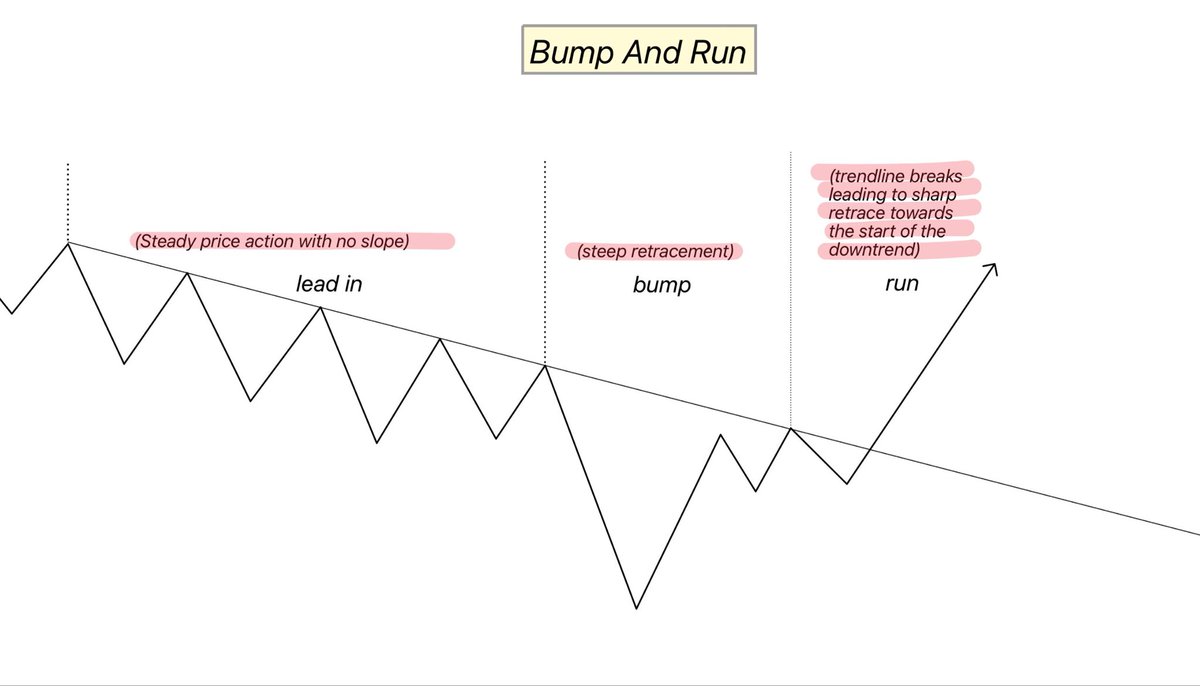
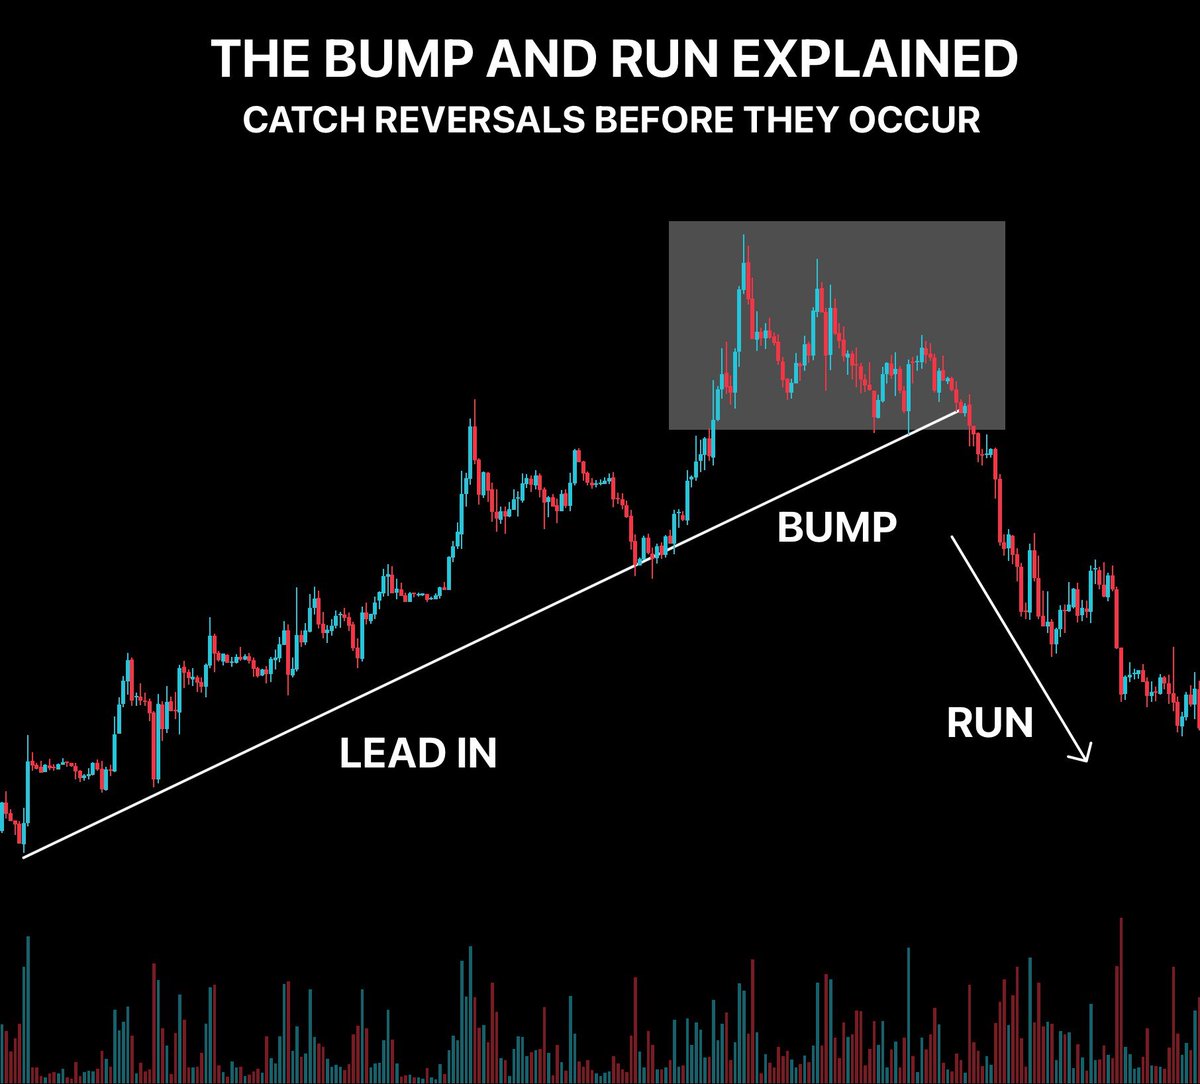 One of my favourite indicator that signals a potential trend reversal. It typically occurs after a sharp price increase or decrease, often driven by excessive momentum, followed by a steep uptrend/decline.
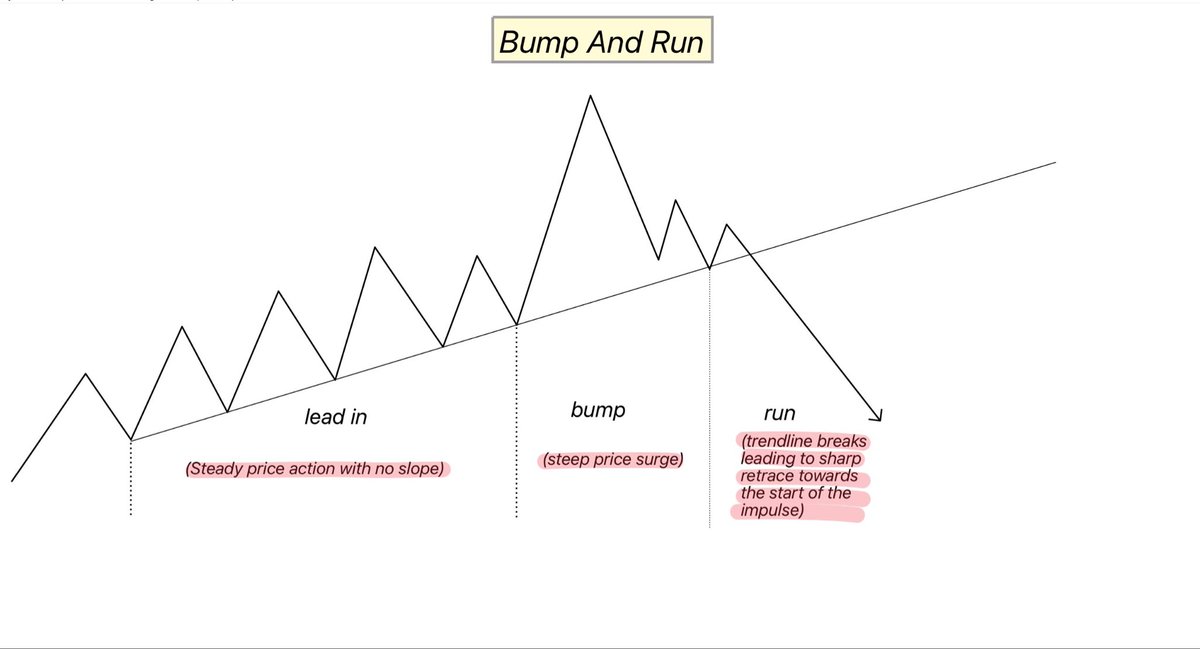
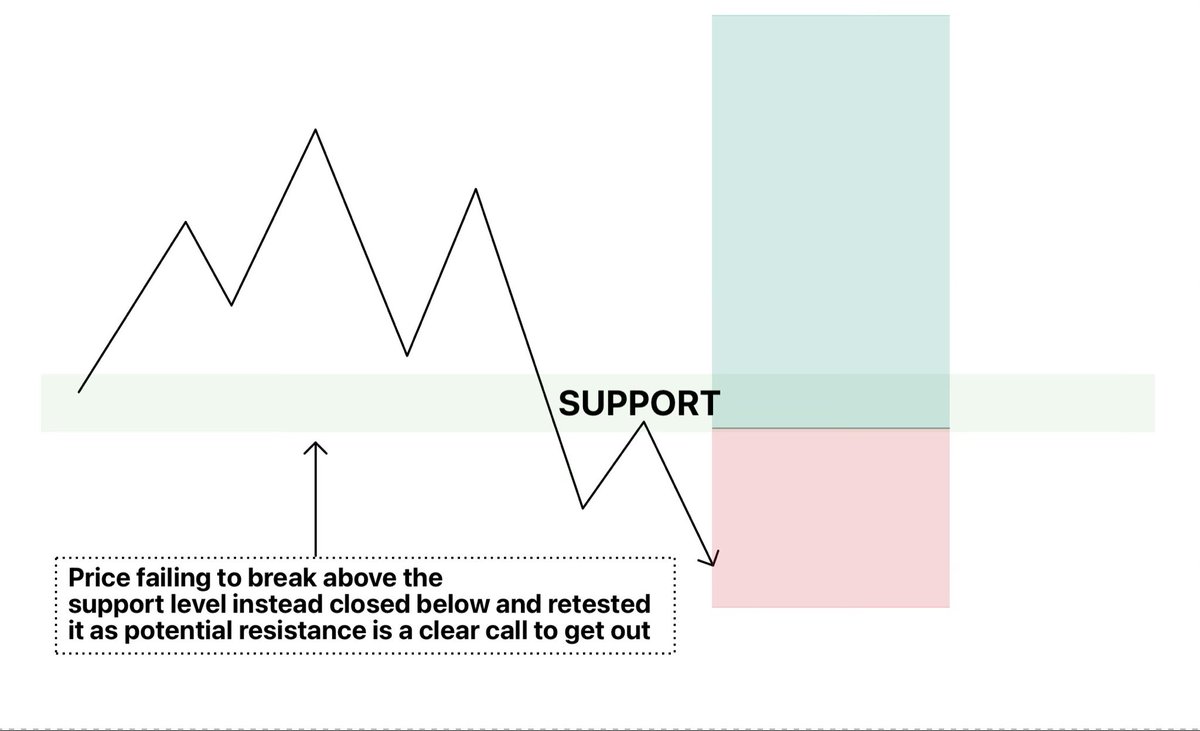
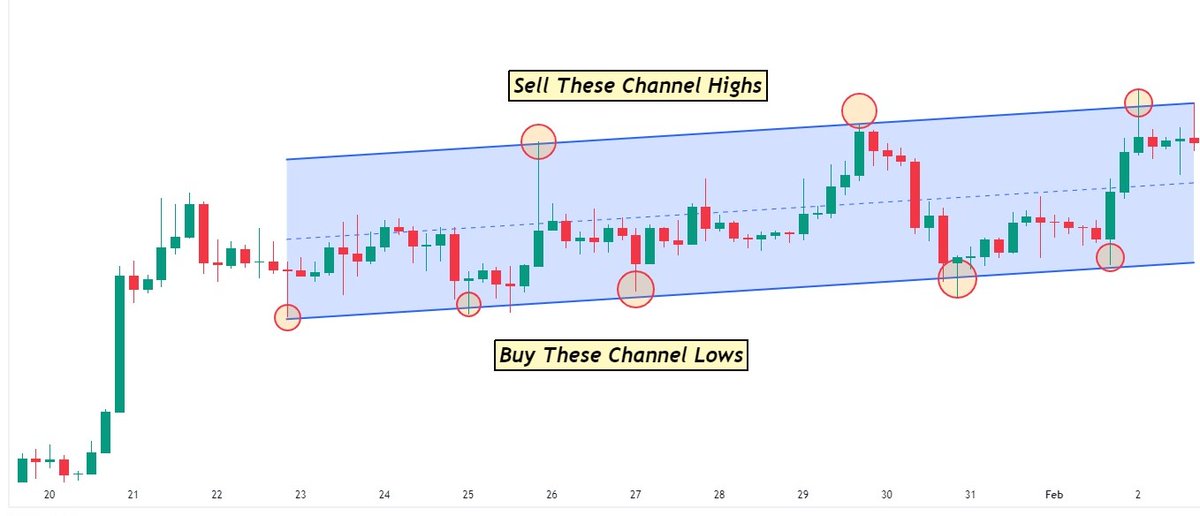
 1) Understanding Support And Resistance
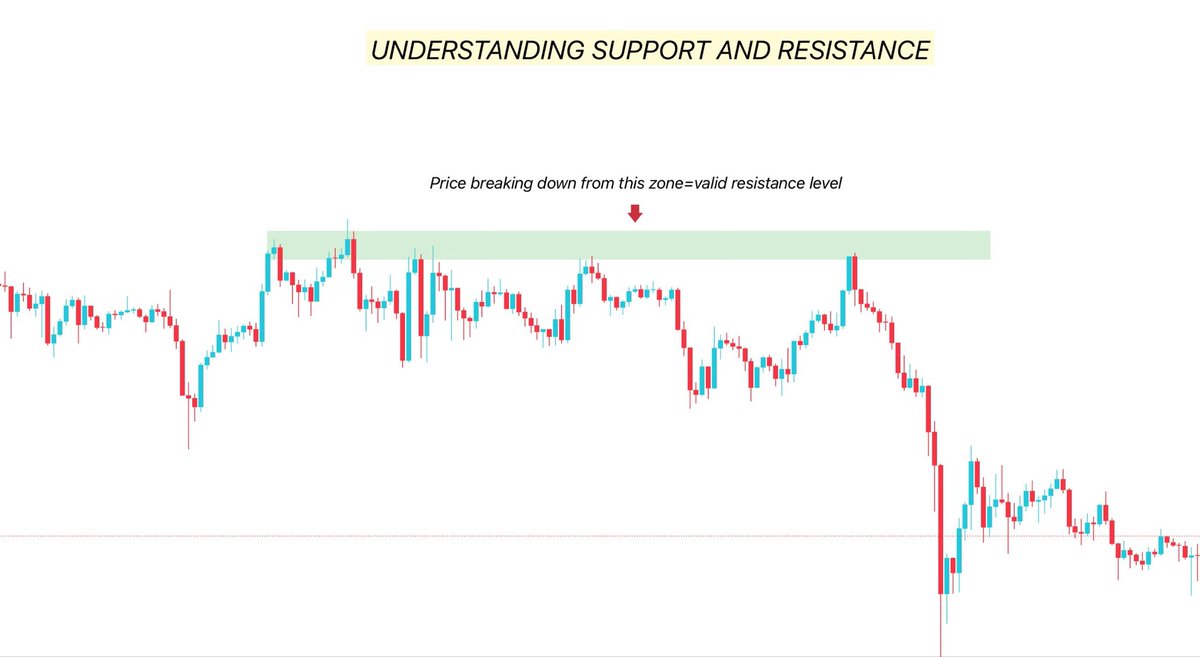

 How to find swing points?
 - ETH often shows strength during illiquid periods, attracting traders before a sudden liquidation event where it drops 20-30% as market makers pull bids
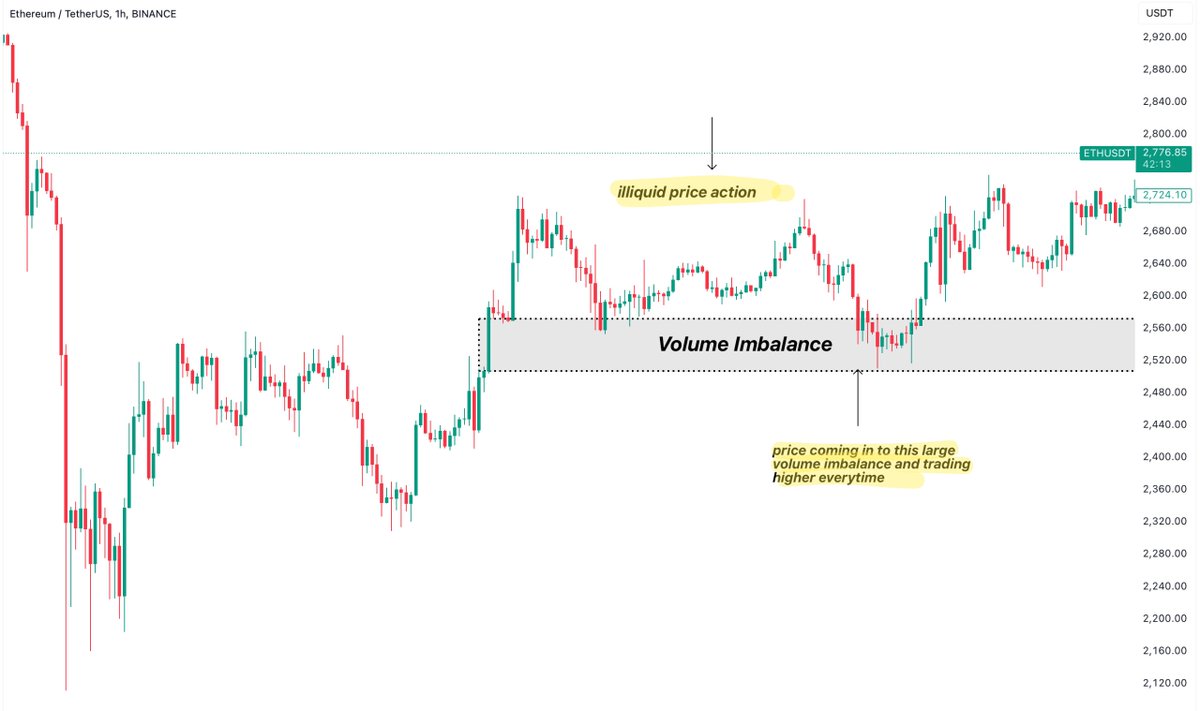

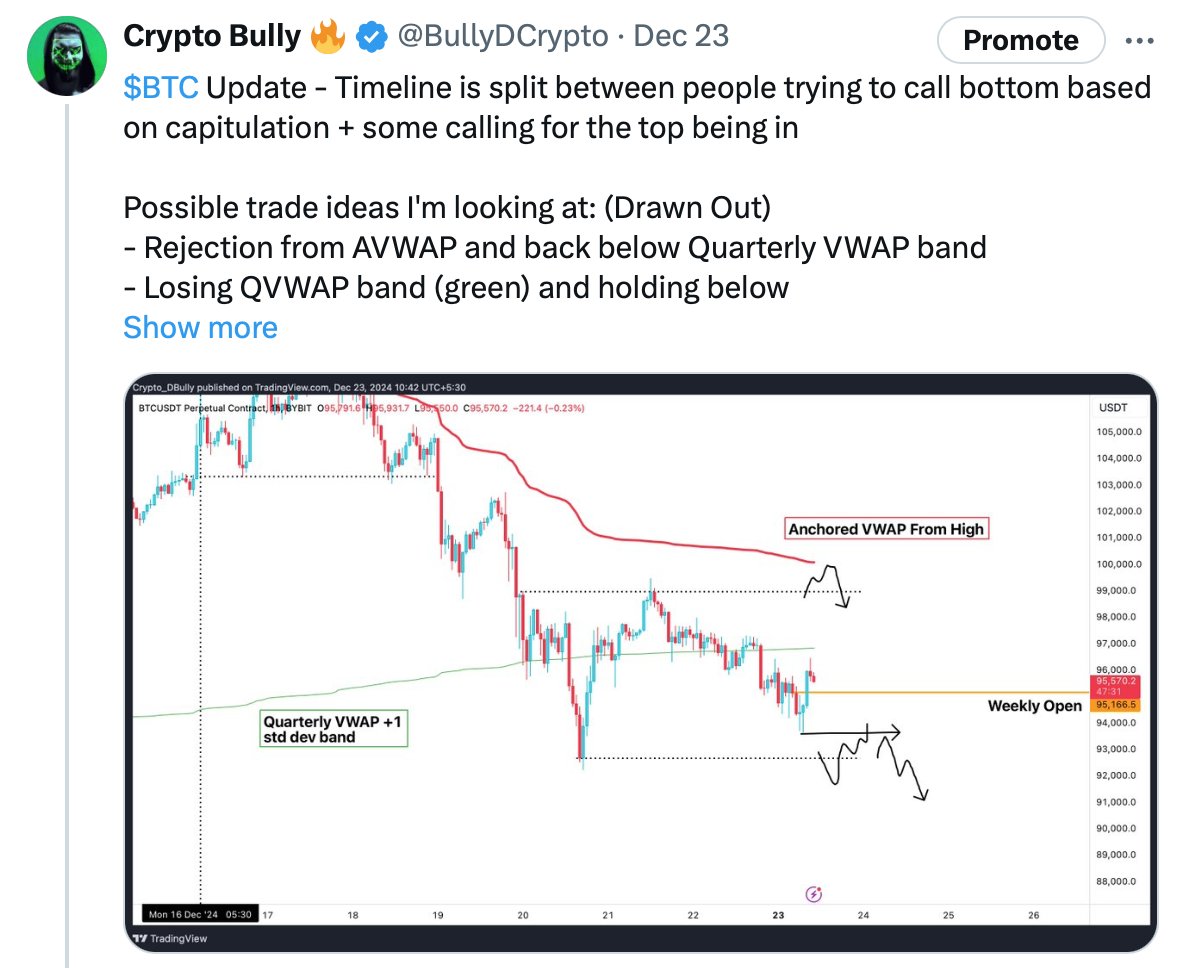
 Now the immediate playbook:
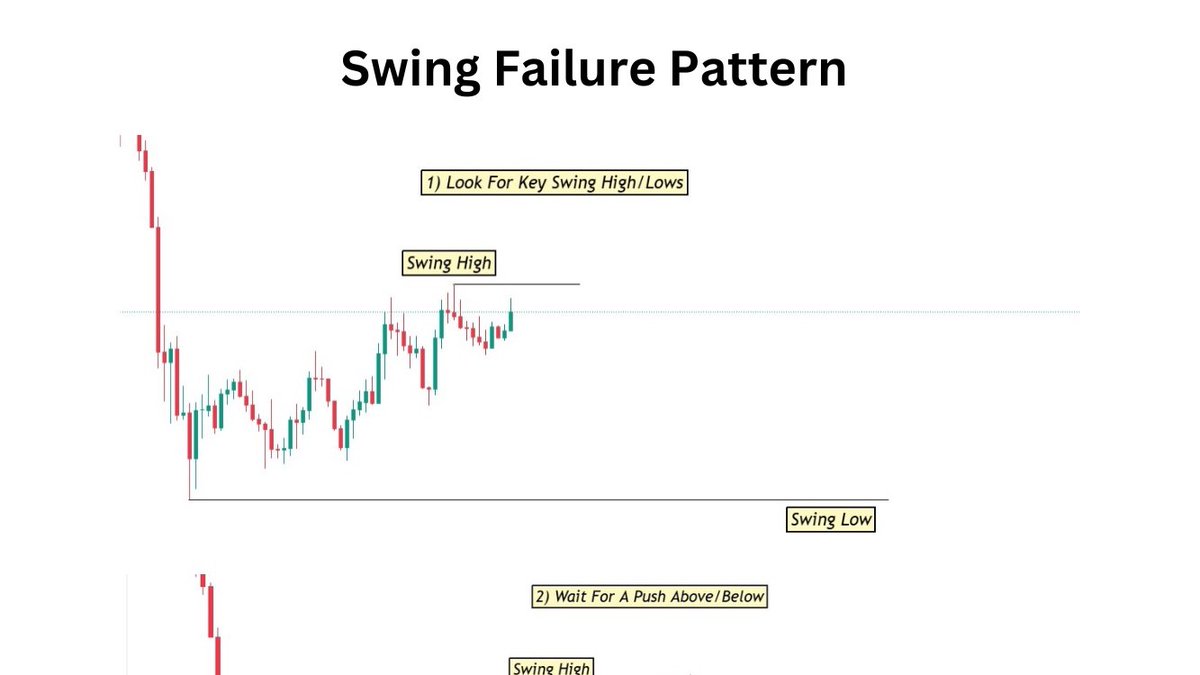 What is A swing failure pattern (SFP)?
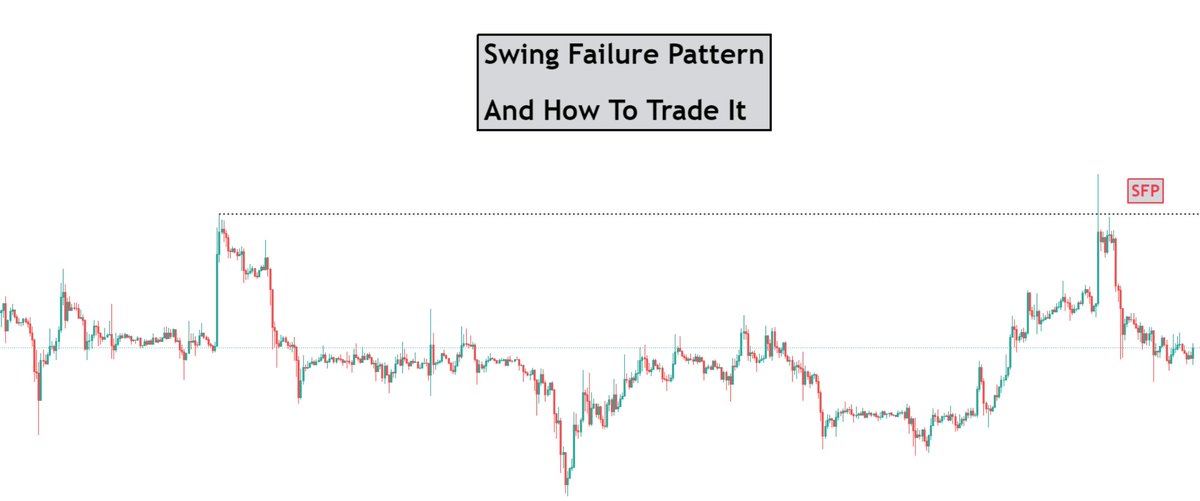
 How to preserve profits and increase your account size
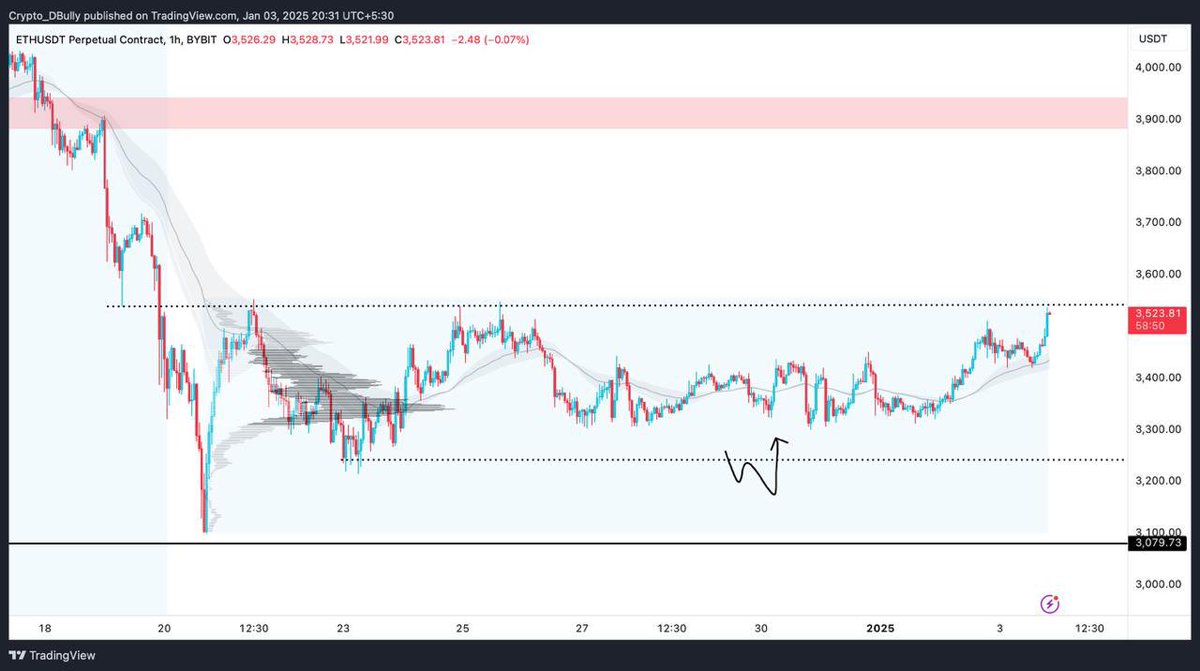 $ETH
$ETH 

 What's next?

 The Three Drive Pattern
